
How To Creat Tableau Dashboards? – Practical Guide For FREE
Last updated on 10th Jul 2020, Blog, Tutorials
A dashboard is a consolidated display of many worksheets and related information in a single place. It is used to compare and monitor a variety of data simultaneously. The different data views are displayed all at once. Dashboards are shown as tabs at the bottom of the workbook and they usually get updated with the most recent data from the data source. While creating a dashboard, you can add views from any worksheet in the workbook along with many supporting objects such as text areas, web pages, and images.
Each view you add to the dashboard is connected to its corresponding worksheet. So when you modify the worksheet, the dashboard is updated and when you modify the view in the dashboard, the worksheet is updated.
Tableau is the traditional BI tool that makes rapid results in useful information. It provides an easy way to use applications for fast analytics and visualization. There are so many choices to present our work outside. For data visualizations, we pick up the different charts to convey the results. Tableau workbook contains sheets and dashboards. Sheets are for creating individual visualizations. the dashboard is for combining multiple sheets. On the other hand, Story points are a collection of worksheets and dashboards that work together to link data. Tableau has some added features like Tableau desktop, Actions, Aggregate dimensions.
A tableau is a software tool that was first introduced back in 2003 in Seattle, Washington, United States. If we want to use any Business Intelligence tool visually analyzing the data, the first software which comes to our mind is Tableau. Tableau helps the user to create and distribute an interactive dashboard. It is interesting to know that this interactive creatable dashboard is shareable too. Tableau can be connected to files, relational and Big Data sources to acquire and process data.
This tableau software easily allows data blending along with real-time collaboration, which additionally provides it the feature of uniqueness. It is generally used by academic researchers, businesses, and many government organizations for visual data analysis.
Tableau Dashboard
In general, the dashboard is a high-level business data view where the reports are originated. Dashboarding in tableau gives high performance and allows non- technical users to access and use the data with creative and real-time visualization. The dashboard is a collection of worksheets allows analyzing multiple views at once. The dashboard consists of size, sheets, objects, tiled, dashboard (where we can see the device preview).
Any dashboard that is built in Tableau public or desktop can be published for public consumption on the web. And when you distribute the worksheets on the cloud privately Tableau Server is required with proper licenses.
Types of Dashboard are
- Explanatory Dashboard: They are static.
- Exploratory Dashboard: They are interactive.
- Explanatory/ Exploratory Dashboard: Includes both annotations and interactive controls.
- Story Telling dashboards: Convey series of events.
What is the Tableau Dashboard?
Dashboard actions (provide flexible interactivity) are the key features. They allow the worksheet to work outside the domain of the view. There are 3 types of actions: Filter actions, Highlight actions, URL actions.
Layout (automatically resizes the objects) and size portion provide various ways of interacting and customizing the dashboard.
Web pages can be embedded by the dragging web page tool from the left side. The hyperlink is available on the dashboard.
Steps for creating a dashboard are:
- Select a metric
- Visual Presentation
- Design
- Refine
- Publish
What one can do with Tableau Dashboard?
The following are the various things for which users can use Tableau and indeed Tableau dashboard. Let us read each one by one.
Speed of Analysis of Data: As it is quite easy to build a Tableau dashboard, and does not require any high level of expertise one can use it analyzing of data. Not only it will help for analyzing data but it also provides it in a rapid manner.
Self-Reliant: As Tableau dashboard is self-reliant and does not require complex setup, hence dashboard could be easily customized so that it contains all the features needed to complete analysis of data
Visual Discovery: Using Tableau dashboard, the user can analyze the data and explore it. Users can add several visual tools like charts, graphs, trends, etc for better visualization of data. All features are available by simply dragging and dropping and hardly requires very little handling
Blending Diverse Data Sets: Tableau Dashboard allows us to blend different raw data sources which may be semi-structured or different relational data without any expensive upfront integration costs. A user need not to know the inner detailing of data communication.
Centralized Data: Since tableau follows a centralized data concept hence we can customize tableau dashboard to view all data in a centralized form
Purpose of Creating a Dashboard in Tableau Desktop
Users like to see some of the views on a single page to save time. While creating a new dashboard, data pane is replaced with a list of worksheets. Having a dashboard supports bi-directional communication between dashboards and source sheets.
Objects can be added by simply dragging them to the dashboard, by default they are added as ‘Tiled’. Tiled objects are the best in adding worksheets to the dashboard. The dashboard can be sized based on the following options: Automatic, Exactly, Range, Pre-sets.
The Layout tab allows setting the dimensions and location of individual components. The sizes are in the pixel. The major component of the dashboard view:
- The list of worksheets
- Dashboard objects to add
- Tiled versus Floating Objects
- Dashboard Layout outline, size control
- The dashboard Itself
Advantages and Disadvantages of Tableau Dashboard
Below are the pros and cons of Tableau dashboard which are as follows:
Advantages
- Centralized Data visualization
- Ease of Implementation
- Quickly create an interactive visualization
- Can show a large amount of data
- Mobile support
- Responsive dashboard
- Descriptive Texts
- KPI’s (Key Performance Indicator) and metrics
- Multiple annotations
- Filters
- Sweet Action
- Multimedia
It is possible to enable a live website in a dashboard by dragging the web Page Dashboard object onto the canvas.
We can add Dynamic Google Maps satellite images to the dashboard by choosing the dashboard file menu, click Actions Then add action button and choose URL. And adding youtube videos to the dashboard (need a spreadsheet to add all the videos). We can add filters to the sheets available in the dashboard to be more interactive by selecting the drop-down options ->all data sources. Applying single filters to all sheets, Dashboard-> actions.
Disadvantages
- No custom visual imports
- Limited column table
- Static and single value parameters
- Limited data preprocessing
- Scaling issue
- Is Expensive
Limitations of the Tableau dashboard
Screen resolution on tableau dashboards gets disturbed if the developer’s resolution is different from end-users’ strengthen dashboards are not responsive. When comparing two bars, the number on the axis can be used to give large differences. If we want to refresh the data we need to re-run the flow.
Create a Dashboard
Version: 2020.2
Applies to: Tableau Desktop, Tableau Online, Tableau Server
After you’ve created one or more sheets, you can combine them in a dashboard, add interactivity, and much more.Create a dashboard, and add or replace sheets
You create a dashboard in much the same way you create a new worksheet.
- At the bottom of the workbook, click the New Dashboard icon:
- From the Sheets list at left, drag views to your dashboard at right.
- To replace a sheet, select it in the dashboard at right. In the Sheets list at left, hover over the replacement sheet, and click the Swap Sheets button.
Note: When you replace a sheet, Tableau retains any padding, border, or background color. However, you may need to adjust sheet size if content differs significantly. You may also need to delete dashboard items specific to the previous sheet, such as filters, which become blank.
Add dashboard objects and set their options
In addition to sheets, you can add dashboard objects that add visual appeal and interactivity. Here’s guidance about each type:

Get Experts Curated Tableau Training with Industry Trends Concepts
- Instructor-led Sessions
- Real-life Case Studies
- Assignments
- Horizontal and Vertical objects provide layout containers that let you group related objects together and fine-tune how your dashboard resizes when users interact with them.
- Text objects can provide headers, explanations, and other information.
- Image objects add to the visual flavor of a dashboard, and you can link them to specific target URLs.
- Web Page objects display target pages in the context of your dashboard. Be sure to review these web security options, and be aware that some web pages don’t allow themselves to be embedded—Google is one example.
- Blank objects help you adjust spacing between dashboard items.
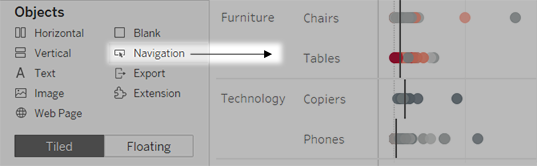
- Navigation objects let your audience navigate from one dashboard to another, or to other sheets or stories. You can display text or an image to indicate the button’s destination to your users, specify custom border and background colors, and provide informational tooltips.
- Export objects let your audience quickly create a PDF file, PowerPoint slide, or PNG image of a dashboard. Formatting options are similar to Navigation objects.
- Extension objects let you add unique features to dashboards or integrate them with applications outside Tableau.
Add an object
Select an item under Objects on the left, and drag it to the dashboard sheet on the right:
Set options for objects
Click the object container to select it. Then click the arrow in the upper corner to open the shortcut menu. (The menu options vary depending on the object.)
Detailed options for navigation and export objects
Navigation and export objects have several unique options that help you visually indicate a navigation destination or file format.
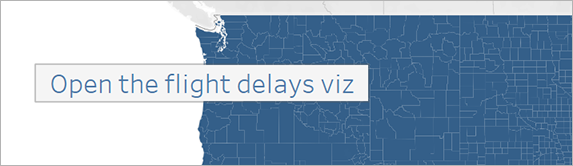
A navigation button using text for the button style
- In the upper corner of the object, click the object menu, and choose Edit Button.
- Do one of the following:
- From the Navigate to menu, choose a sheet outside the current dashboard.
- From the Export to menu, choose a file format.
- Choose image or text for Button Style, specify the image or text you want to appear, and then set related formatting options.
- For Tooltip text, add explanatory text that appears when viewers hover over the button. This text is optional and typically best used with image buttons. (For example, you might enter “Open Sales viz” to clarify the destination for a navigation button that appears as a miniature sales chart.)
Note: When viewing a published dashboard, simply clicking a button navigates or exports. When authoring a dashboard, however, you need to Alt-click (Windows) or Option-click (macOS).
Add interactivity
You can add interactivity to dashboards to enhance users’ data insights. Try these techniques:
- In the upper corner of sheet, enable the Use as Filter option to use selected marks in the sheet as filters for other sheets in the dashboard.
- When authoring in Tableau Desktop, add actions to use multiple sheets as filters, navigate from one sheet to another, display web pages, and more. For details, see Actions and Dashboards.