MicroStrategy: A Concise Tutorial Just An Hour – FREE
Last updated on 08th Jul 2020, Blog, Tutorials
MicroStrategy designed and built its MicroStrategy platform from the ground up with the goal of easy Internet accessibility, rapid deployment, fast responses to report requests, and sophisticated analysis and reporting functionality.
The following diagram shows the rich set of business intelligence functionality that the MicroStrategy platform provides.

The MicroStrategy Tutorial is a MicroStrategy project, which includes a warehouse, and a set of demonstration applications designed to illustrate the platform’s rich functionality. The MicroStrategy Tutorial Reporting metadata is provided as part of the MicroStrategy Analytics Module metadata.
A project is the highest-level of intersection of a data warehouse, metadata repository, and user community. Conceptually, the project is the environment in which all related reporting is done. A typical project contains reports, filters, metrics, and functions. You create projects that users access to run reports.
The theme of the MicroStrategy Tutorial project is a retail store for the time 2009 to 2012 that sells electronics, books, movies, and music. The key features of the MicroStrategy Tutorial project include the following:
- Hierarchies, including Customer, Geography, Products, and Time. Each hierarchy can be viewed graphically through MicroStrategy Developer and MicroStrategy Web.
- Numerous customers and purchased items.
- Reporting areas: Customer Analysis, Enterprise Performance Management, Human Resources Analysis, Inventory and Supply Chain Analysis, Sales and Profitability Analysis, and Supplier Analysis.
- Options to create reports from MicroStrategy Developer and MicroStrategy Web focusing on a particular analysis area, such as Customer, Inventory, Time, Products, Category, Employee, or Call Center.
MicroStrategy Tutorial reporting areas
MicroStrategy Tutorial reports and documents are grouped into various folders within the Public Objects\Reports folder of the MicroStrategy Tutorial project. These reports and documents are grouped into the following folders:
- Business Roles: This folder contains subfolders that reflect different types of business intelligence users within an organization, including Billing Managers, Brand Managers, Category Managers, Company Executives, District Sales Managers, Operations Managers, Regional Sales Managers, and Suppliers. Each subfolder contains reports that would be of interest to the type of business user for which the subfolder is named. For instance, the Billing Managers folder contains an Invoice report and a customer-level transaction detail report. The Supplier folder contains a Supplier Sales report, and the Brand Managers subfolder contains a report called Brand Performance by Region.
- Dashboards and Scorecards: This folder contains various examples of different types of scorecards and dashboards. Using of MicroStrategy Report Services documents, you can create scorecards and dashboards. A Report Services document of this type is a visually intuitive display of data that summarizes key business indicators for a quick status check. Dashboards usually provide interactive features that let users change how they view the dashboard’s data. For information on using dashboards, scorecards, and other Reporting Services documents, see the Document and Dashboard Analysis Guide.
- Enterprise Reporting Documents: This folder contains examples of different types of standard enterprise reporting documents, such as scorecards and dashboards, managed metrics reports, production and operational reports, invoices and statements, and business reports. They are a sample of the types of reporting documents that can be built using MicroStrategy Report Services.
- MicroStrategy Platform Capabilities: This folder contains examples of many of the sophisticated capabilities within the MicroStrategy platform. Evaluators of the software, as well as customers, can use the examples to get a better feel for many of the platform’s capabilities. Customers can use the examples to guide the development of there own MicroStrategy applications.
The subfolders under these folders are named according to the capabilities that their reports exemplify. For example, the Graph Styles folder contains examples of most of the graph types that can be created in MicroStrategy, the MicroStrategy Data Mining Services folder contains examples of Linear Regression models and other data mining models built within MicroStrategy, and the MicroStrategy Mobile folder contains examples of reports and documents that can be viewed on a mobile device through the use of MicroStrategy Mobile.
- Subject Areas: This folder contains reports that are categorized further by topic. Topics covered include Customer Analysis, Enterprise Performance Management, Human Resource Analysis, Inventory and Supply Chain Analysis, Sales and Profitability Analysis, and Supplier Analysis.
- Customer Analysis: Reports analyzing the customer base, studying areas such as Customer Income, Customer Counts, Revenue per Customer, and Revenue Growth.
- Daily Analysis: Dashboards and reports containing information about sales, cost, revenue, revenue forecast, profit, and profit margins that are used to analyze the typical workflow of a company. The dashboards and reports are useful for a standard MicroStrategy demonstration.
- Enterprise Performance Management: Reports containing information on revenue amounts, trends and forecasts, profits, profit margins, and profit forecasts. These reports make it easy for an executive at any level of the company to understand how the company is performing as a whole or at the region, category, and subcategory levels.
- Human Resource Analysis: Reports containing information on employees, including headcount, birthdays, length of employment, and the top five employees by revenue. These reports are based on employees, time, geography, and sales. The Human Resources Analysis reports provide insight into human capital so that managers can boost the efficiency and effectiveness of their employees. Human Resource Representatives can highlight under-performing employees and misallocated headcount. Managers at all levels can focus on the performance of their employees, drill down to an individual employee detail level, view trends, and extract intelligence not otherwise evident.
- Inventory and Supply Chain Analysis: Reports containing information based on supplier, product, cost, revenue and profit, such as Inventory and Unit Sales, or Inventory Received from Suppliers by Quarter. The Inventory reports track inventory information within the company and through to suppliers. Essentially, these reports show how many units of an item are on hand, how many are expected from a particular supplier, and how many units have been sold. Inventory reports are used to ensure that the supply chain is as efficient as possible. Using these reports, employees can analyze trends and details, quickly adjust inventory and distribution, and understand underlying supply chain costs and inefficiencies.
- Sales and Profitability Analysis: Reports analyzing revenue and profit from multiple perspectives. Examples include Sales by Region, Revenue over Time, and Brand Performance by Region. The Product Sales reports allow managers and analysts to monitor and analyze sales trends, track corporate revenue goals, compare store-to-store performance, and respond more quickly and accurately to feedback from the marketplace. In turn, executives can analyze sales trends and details, quickly adjust pricing and promotions, identify product affinities and key profit centers, and understand costs and revenue trends.
- Supplier Analysis: Reports containing supplier, sales, profit, and revenue information, such as Brand Sales by Supplier, Supplier Sell-Through Percentage, and Units Sold and Profit by Supplier. The Supplier reports allow managers and analysts to monitor and analyze vendor performance so that they can quickly identify performance problems. These reports track brands and items sold that came from a particular vendor. They also correlate profit and revenue information with particular suppliers so that relationships with key vendors can be strengthened.
You can deploy the out-of-the-box documents to your project by reconciling the documents’ content to your own project objects. For example, you can use any of the Tutorial documents or dashboards mentioned above, or any of the documents and dashboards in the Human Resource Analytic Module, in your own project. To do this, you use the portable documents feature. A portable document contains all the design of the document without the data, allowing you to copy documents between projects, even when the projects do not have the same metadata. When you import the document into the replacement project, you map the document to the new project (referred to as reconciling the document).
Why is MicroStrategy so widely used?
Here are the major pros/benefits of using MicroStrategy:
- It can connect with existing enterprise apps and systems.
- It is deployed in the cloud. Thus, it saves your infrastructure costs.
- It is a useful tool for solving big data related issues.
- It offers features for mobile analytics.
- It allows you to directly access a database with in-memory
- Provide BI ecosystem which helps you to eliminate the requirement for other tools
- It is user-friendly, thus eliminating the need for IT support.
- It offers advanced and predictive analytics features
Features of MicroStrategy
Here, are essential features of MicroStrategy:
- Ease of use and self-service
- Offers highest user scalability
- Plug and play components
- Highest report scalability
- Automated report maintainability
- Highest data scalability
- Allows you to prompt parameterized reporting
- Helps you to format tabular grid reports using a range of built-in styles
- Conditional formatting of data and visual indicators
- Allows you to convert tabular reports in the form of graphs and charts
- You can drill down granular level data using Microstrategy
- Allows you to export inMS-Excel, HTML or text formats
Important terms used in MicroStrategy
Data Discovery
MicroStrategy offers an excellent feature for data discovery. It is part of the BI process which allows you to connect data from disparate sources in the form of data silos. The tool also helps you to connect data in formats like big data, flat files, etc.
Data Wrangling:
It is a method for cleaning and transforming data in a format which can be adapted easily for extracting business insights. It allows you to structure, cleanse, and enrich data to perform business intelligence reporting.
Data Mining and Predictive Analysis
MicroStrategy offers data mining features like report designers to business users and analysts. It allows you to build predictive analytics reports and distribute them to any device.
Library of Analytic Functions
MicroStrategy offers a comprehensive library that provides data mining, financial and mathematical functionalities. It helps to tie data, performance metrics, and statistical analysis reports.
Extensible Visualization Library
MicroStrategy offers hundreds of open source tools for visualizing the data along with the built-in tools. It allows you to deploy the visualization builder, or you can also even build a new visualization from.
Real-time Dashboards
The real-time dashboard allows you to work with real-time data. It also helps to monitor business information in real-time. You can also get a regular update with the latest data.
Embedded BI
MicroStrategy offer option of Embedded BI which allows you to connect with SharePoint, WebSphere, NetWeaver, etc. The tool provides a simple integration kit that includes sample coding and documentation.
Installation and setup of Microsoft strategy
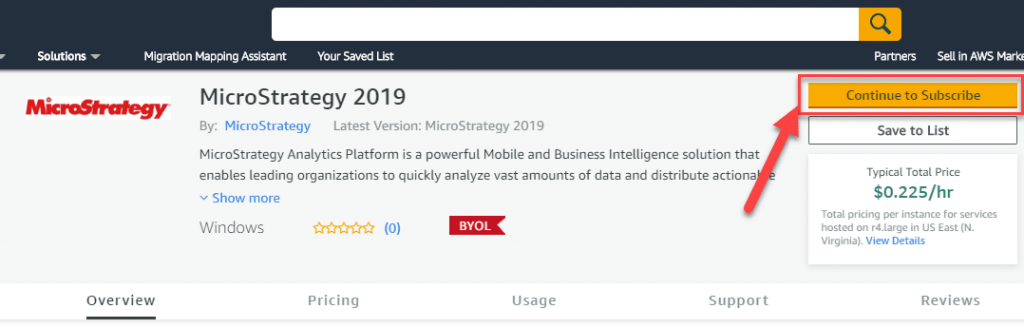
Step 1) Go to the link and click “Continue to Subscribe.”
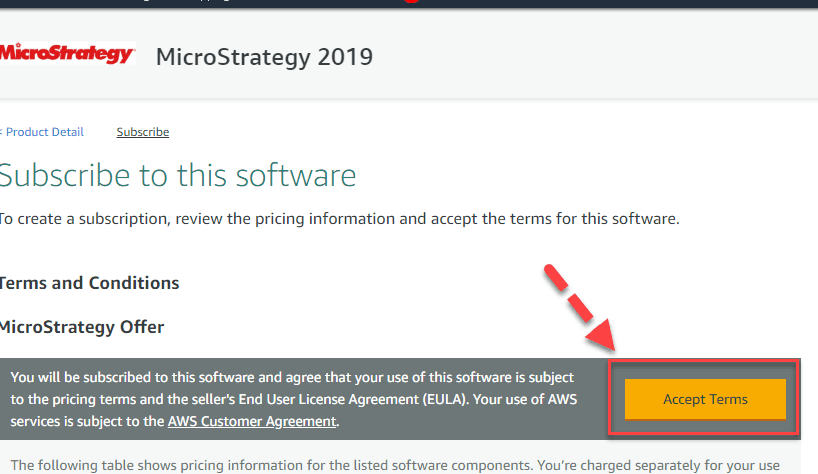
Step 2) Accept the Terms
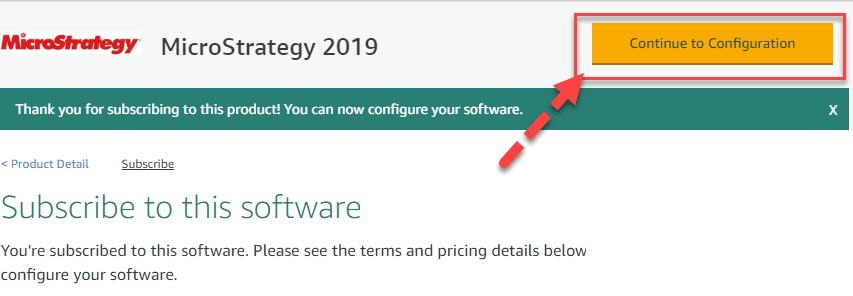
Step 3) Wait for some time. One the same page you see “Continue to Configuration” button. Click on it
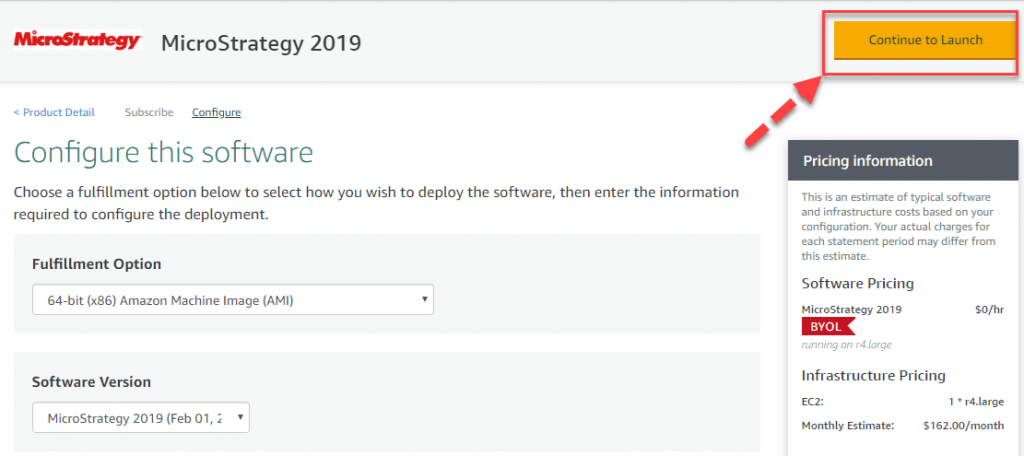
Step 4) Keep the settings default and click “Continue to Launch.”
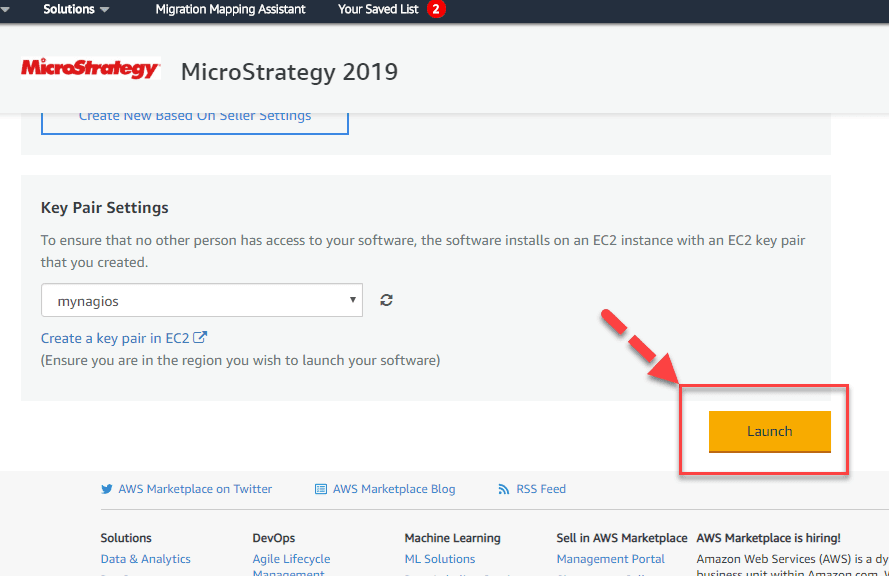
Step 5) Keep the settings default and Click “Launch.”
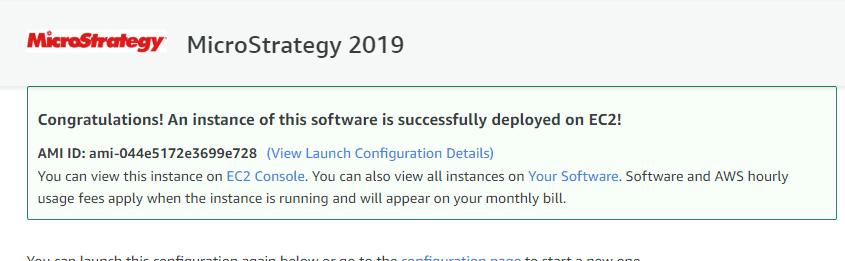
Step 6) You will be shown a confirmation screen. Wait for some time, for instance, to launch.
Step 7) Find the public IP of the instance from your EC2 Console.
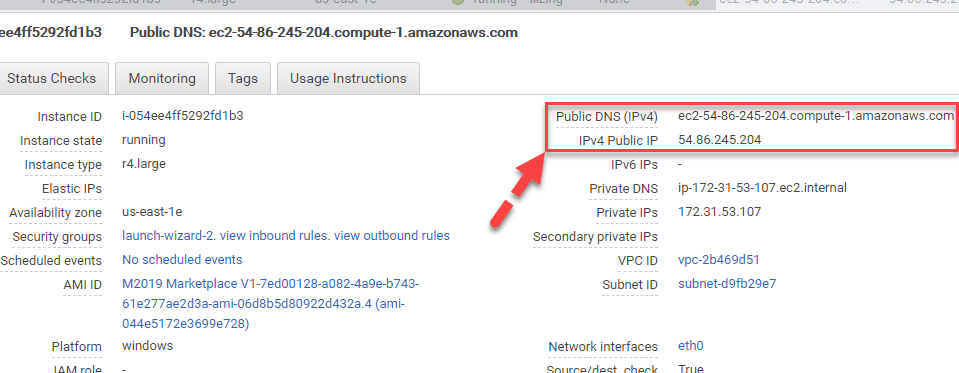
Step 8) Use the link
http://<ip-address>:8080/MicroStrategy/servlet/mstrWeb
To access MicroStrategy in our case, the link is:
http://ec2-54-86-245-204.compute-1.amazonaws.com:8080/MicroStrategy/servlet/mstrWeb

Get Experts Curated Microstrategy Certification Course to Build Your Skills
Weekday / Weekend BatchesSee Batch Details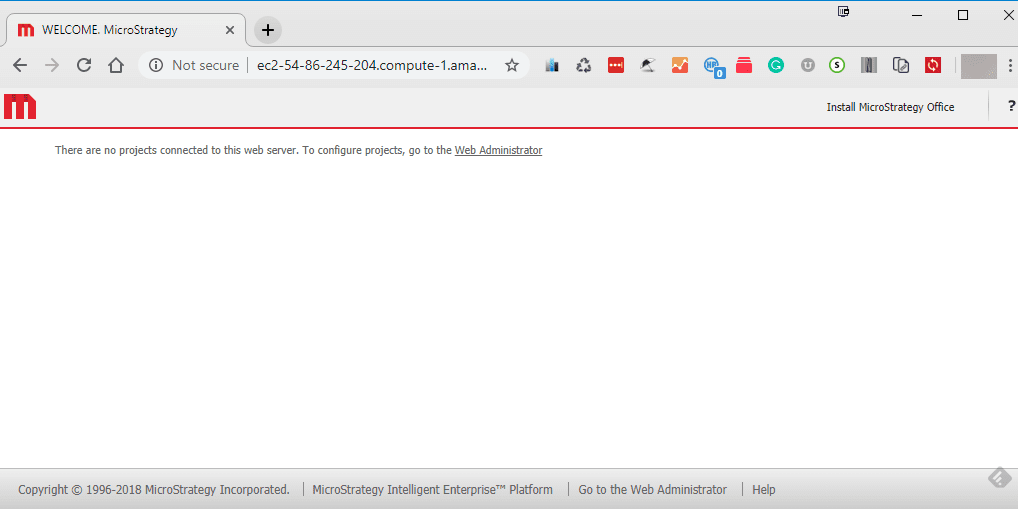
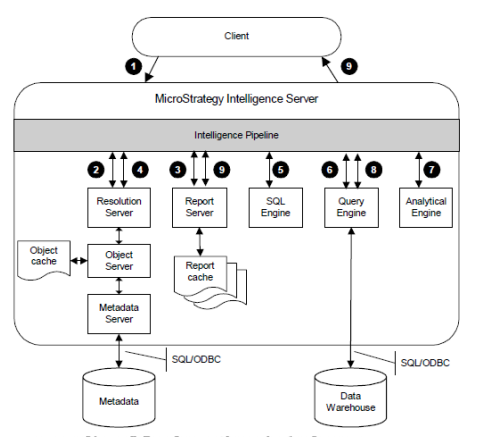
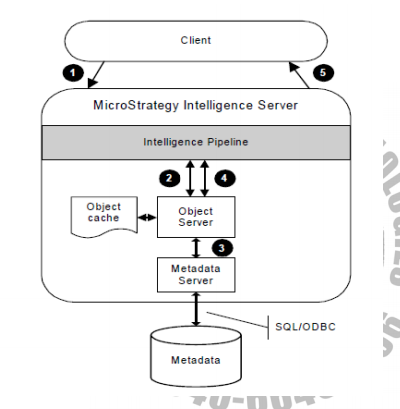
MicroStrategy Architecture
A MicroStrategy system is built around a three-tier or four-tier structure. The diagram below illustrates a four-tier system.
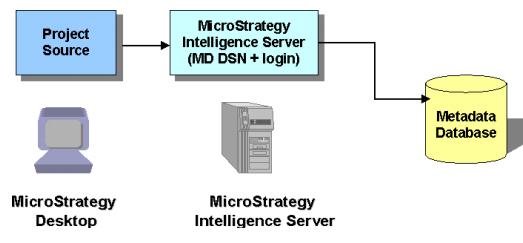
MicroStrategy metadata
MicroStrategy users need connectivity to the metadata so that they can access projects, create objects, and execute reports. MicroStrategy Intelligence Server connects to the metadata by reading the server definition registry when it starts.
What happens when Intelligence Server starts?
When Intelligence Server starts, it does the following:
- Initializes internal processing units
- Reads from the machine registry which server definition it is supposed to use and connects to the specified metadata database
- Loads configuration and schema information for each loaded project
- Loads existing report cache files from automatic backup files into memory for each loaded project (up to the specified maximum RAM setting)
- Loads schedules
- Loads MDX cube schemas
Intelligence Server job processing
The following is a high-level overview of the processing that takes place:
- A user makes a request from a client application such as MicroStrategy Web, which sends the request to Intelligence Server.
- Intelligence Server determines what type of request it is and performs a variety of functions to prepare for processing.
- Depending on the request type, a task list is composed that determines what tasks must be accomplished to complete the job, that is, what components the job has to use within the server that handle things like asking the user to respond to a prompt, retrieving information from the metadata repository, executing SQL against a database, and so on. Each type of request has a different set of tasks in the task list.
- The components within Intelligence Server perform different tasks in the task list, such as querying the data warehouse, until a final result is achieved.
- Those components are the stops the job makes in what is called a “pipeline,” a path that the job takes as Intelligence Server works on it.
- The result is sent back to the client application, which presents the result to the user.
Processing report execution
Processing object browsing
MicroStrategy User Model
MicroStrategy users
- Like most security architectures, the Micro Strategy security model is built around the concept of a user. To do anything useful with Micro Strategy, a user must log in to the system using a login ID and password. The user can then perform tasks such as creating objects or executing reports and documents, and can generally take advantage of all the other features of the Micro Strategy system.
- Users are defined in the Micro Strategy metadata, and exist across projects. You do not have to define users for every project you create in a single metadata repository.
- Each user has a unique profile folder in each project. This profile folder appears to the user as the “My Personal Objects” folder. By default other users’ profile folders are hidden. They can be viewed by, in the Desktop Preferences dialog box, in the Desktop: Browsing category, selecting the Display Hidden Objects check box.
- Administrator is a built-in default user created with a new Micro Strategy metadata repository. The Administrator user has all privileges and permissions for all projects and all objects.
MicroStrategy user groups
A user group (or “group” for short) is a collection of users. Groups provide a convenient way to manage a large number of users.
Instead of assigning privileges, such as the ability to create reports, to hundreds of users individually, you may assign privileges to a group. Groups may also be assigned permissions to objects, such as the ability to add reports to a particular folder.
Controlling access to objects: Permissions
Permissions define the degree of control users have over individual objects in the system. For example, in the case of a report, a user may have permission to view the report definition and execute the report, but not to modify the report definition or delete the report.
While privileges are assigned to users (either individually, through groups, or with security roles), permissions are assigned to objects.
Controlling access to functionality: Privileges
Privileges give users access to specific MicroStrategy functionality. For example, the Create Metric privilege allows the user to use the Metric Editor to create a new metric, and the Monitor Caches privilege allows the user to view cache information in the Cache Monitor.
Defining sets of privileges: Security roles
A security role is a collection of project-level privileges that are assigned to users and groups. For example, you might have two types of users with different functionality needs: the Executive Users who need to run, sort, and print reports, and the Business Analysts who need additional capabilities to drill and change subtotal definitions. In this case, you can create two security roles to suit these two different types of users.
Modes of Authentication
The available authentication modes are:
- Standard: Intelligence Server is the authentication authority. This is the default authentication mode.
- Anonymous: Users log in as “Guest” and do not need to provide a password. This authentication mode may be required to enable other authentication modes, such as database warehouse or LDAP.
- Database warehouse: The data warehouse database is the authentication authority.
- LDAP (lightweight directory access protocol): An LDAP server is the authentication authority Single sign-on: Single sign-on encompasses several different third-party authentication methods, including:
- Windows authentication: Windows is the authentication authority o Integrated authentication: A domain controller using Kerberos authentication is the authentication authority
- Tivoli or SiteMinder: A third-party single sign-on tool, such as Tivoli or SiteMinder, is the authentication authority.
Managing and verifying your licenses
MicroStrategy uses two main categories of licenses:
- Named User licenses in which the number of users with access to specific functionality is restricted.
In a Named User licensing scheme, the privileges given to users and groups determine what licenses are assigned to users and groups. Intelligence Server monitors the number of users in your MicroStrategy system with each privilege, and compares that to the number of available licenses.
- CPU licenses, in which the number and speed of the CPUs used by MicroStrategy server products are restricted.
When you purchase licenses in the CPU format, the system monitors the number of CPUs being used by Intelligence Server in your implementation and compares it to the number of licenses that you have. You cannot assign privileges related to certain licenses if the system detects that more CPUs are being used than are licensed. For example, this could happen if you have MicroStrategy Web installed on two dual-processor machines (four CPUs) and you have a license for only two CPUs.

Enroll in Best Microstrategy Training and Get Hired by TOP MNCs
- Instructor-led Sessions
- Real-life Case Studies
- Assignments
Caching
A cache is a result set that is stored on a system to improve response time in future requests. With caching, users can retrieve results from Intelligence Server rather than re-executing queries against a database.
Intelligence Server supports the following types of caches:
- Result caches: Report and document results that have already been calculated and processed, that are stored on the Intelligence Server machine so they can be retrieved more quickly than re-executing the request against the data warehouse.
- Report caches can only be created or used for a project if the Enable report server caching check box is selected in the Project Configuration Editor under the Caching: Result Caches: Creation category.
- The History List is a way of saving report results on a per-user basis. The History List is a folder where Intelligence Server places report and document results for future reference. Each user has a unique History List.
With the History List, users can:
- Keep shortcuts to previously run reports, like the Favorites list when browsing the Internet.
- Perform asynchronous report execution. For example, multiple reports can be run at the same time within one browser, or pending reports can remain displayed even after logging out of a project.
- Element caches: Most-recently used lookup table elements that are stored in memory on the Intelligence Server or MicroStrategy Desktop machines so they can be retrieved more quickly.
- When a user runs a prompted report containing an attribute element prompt or a hierarchy prompt, an element request is created.
- Object caches: Most-recently used metadata objects that are stored in memory on the Intelligence Server and MicroStrategy Desktop machines so they can be retrieved more quickly.
When you or any users browse an object definition (attribute, metric, and so on), you create what is called an object cache. An object cache is a recently used object definition stored in memory on MicroStrategy Desktop and MicroStrategy Intelligence Server.
Scheduling
Scheduling is a feature of MicroStrategy Intelligence Server that you can use to automate various tasks. Time-sensitive, time-consuming, repetitive, and bulk tasks are ideal candidates for scheduling. Running a report or document is the most commonly scheduled task since scheduling reports, in conjunction with other features such as caching and clustering, can improve the overall performance of the system.
Time-Triggered and Event – Triggered
With a time-triggered schedule, you define a specific date and time at which the scheduled task is to be run. For example, you can execute a particular task every Sunday night at midnight. Time-triggered schedules are useful to allow large, resource-intensive tasks to run at off-peak times, such as overnight or over a weekend.
An event-triggered schedule causes tasks to occur when a specific event occurs. For example, an event may trigger when the database is loaded, or when the books are closed at the end of a cycle.
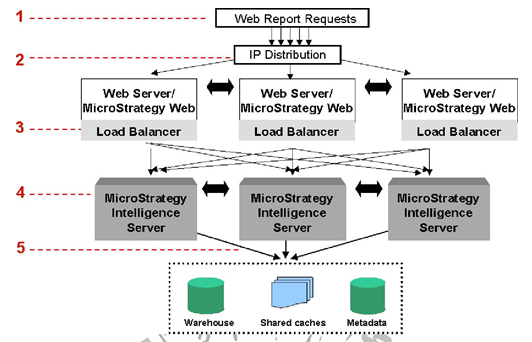
Clustering
A clustered set of machines provides a related set of functionality or services to a common set of users. MicroStrategy recommends clustering Intelligence Servers in environments where access to the data warehouse is mission-critical and system performance is of utmost importance.
A cluster is a group of two or more servers connected to each other in such a way that they behave like a single server. Each machine in the cluster is called a node. Because each machine in the cluster runs the same services as other machines in the cluster, any machine can stand in for any other machine in the cluster.
- Failover support
- Load balancing
- Project distribution and project failover
What are Various Objects in MicroStrategy?
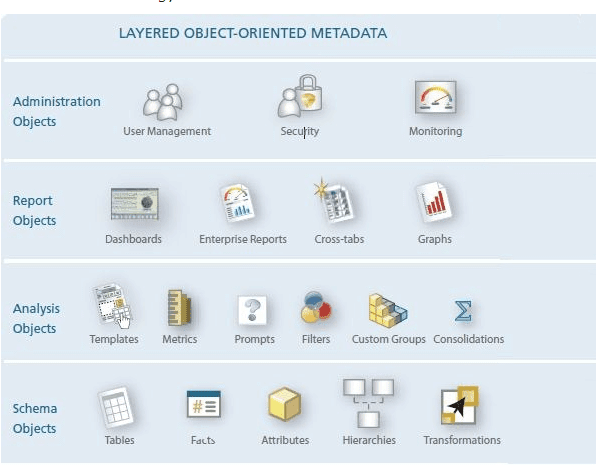
Configuration objects:
In Microstrategy, Object appears in the system layer for use in multiple projects. It includes configuration objects such as Schedules, Data Warehouse, and Login ID.
Schema Objects:
They are used for the logical representation of structures in Data Warehouse. This type of objects acts as a building block for BI. This helps you to map columns in database, functions, and operations.
Report Objects:
This objects layer helps you to assembles the building blocks from the Schema and Analysis. It provides insightful textual and visual analysis.
Public Objects:
Helps users to access the project and create objects to store them in personal folders during the project. Non-Administrative users can only view objects on the public folder so you can’t delete or create new objects in public folders. For example, Drill Maps, Documents, Templates and searches, Metrics.
Applications of MicroStrategy
- Allows you to garner customer feedback using social media analysis
- It is used for Predictive analytics in the banking and insurance domain.
- Offers omnichannel experience using many different customer touchpoints
- Helps you launch new products with the help of market and customer data
- It helps you to convert big data into reports.