In several vertical areas, you will also be exposed to industrially based ETP projects. Our Business Analytics with R Course course strives to give quality training, which provides a practical approach to strong foundational knowledge of key ideas. This exposure to existing applications and scenarios in the sector will assist students to expand their skills and do projects in real-time with best practices.
Additional Info
Course Overview :
The Business Analytics with R Institute provides courses on R programming, R for the analysis, R classification rules for decision trees, as well as a practical implementation of business analytics with R. Learn the various sub-setting methods of R, R for the analysis, and functions used in R for data inspection. As part of this program, you will also work on Real-time projects across various industries.
Intro Of R Analytics :
This Business Analytics with R Online Course open-source programming language and software environment known as Business Analytics With R is a programming language and environment developed by statisticians and for statisticians. Statistical computations and advanced graphics are primarily carried out using it. Hence, it is a popular language for applied mathematicians, statisticians, data analysts, and also for scientists to analyze data. Statistical computing or graphics is performed using R programming language, an open-source programming language. Data mining and statistical analysis often use this programming language. By identifying patterns and building practical models, it can serve as an analytics tool. Additionally, R can be used to develop software applications that analyze data and perform statistical analysis, such as the creation of data analysis software. R offers a graphical user interface that can be used to develop programs, including classical statistical tests, cluster analysis and other time-series analysis techniques, as well as linear and nonlinear modeling methods. There are four windows on the interface: a script window, console window, workspace and history window, and tabs for different areas (help, packages, plots, and files). Plots and graphics can be written in R for publication and analytics can be stored for future use.
Throughout the years, R has grown in popularity, and it is one of the most popular analytics languages for colleges and universities. Academics and corporations throughout the world have accounted for its reliability, accuracy, and robustness. In recent years, the user interface of R has become more user-friendly, which was initially seen as a barrier to non-statisticians learning this programming language. The application now supports extensions and other plugins like R Studio and R Excel, which assists new users in learning it more quickly and effectively. As more graduates enter the workforce as R-trained analysts, it is expected to become the industry standard for statistical analysis and data mining projects.
R Analytics: Why Should You Get Started?
A strong community of R users makes it possible to find sample codes for a variety of data analysis projects using this open source coding language. You can also experiment with these tools for free if your company wants to start using analytics. R is used for demonstrating the benefits of further investment by management by testing new analytics projects or Proof of Concepts. The countless R forums and tutorials available for learning the language help analysts use R in their own work. The languages are used by over two million people.
What can I use R analytics for?
1. Today, R is being used in multiple industries and fields, across a range of different sectors. Data collection, clustering, and analytics models are some of the ways R is used in business analytics.
2. Rather than using a ready-made approach, R data analysis allows companies to create their own statistics engines that provide better, more accurate insights, because data is collected and stored more precisely.
3. Furthermore, using R instead of boxed software makes it possible for companies to create ways to test for errors in analytical models while reusing existing queries and conducting ad-hoc analyses. Using R and its sister language, Python, as part of your analytics stack is essential if you want to maximize data value. The integration of these technologies can make them as easy to use as SQL.
4. Academics and more research-oriented areas often require highly specific and unique modeling methods, so R has proven invaluable in these fields.
5. With this flexibility, organizations can now rapidly design custom analytical programs that can integrate with existing statistical analyses while providing insight into much deeper and richer data sets.
6. The Business Analytics with R online Course can provide models that can typically deliver better or more specific insights when it comes to social media data or web data, even when standard measures like page views or bounce rates are used.
R Analytics: What are the benefits?
Business data can be analyzed more efficiently using R's business analytics. Companies that use R in their analytics programs achieve some of the following benefits:
Organizational Democratization of Analytics :
Using interactive data visualization and reporting tools, R enables business users to gain insight into their data. In order for business users and citizen data scientists to make better business decisions, R can be used for data science by nondata scientists. Additionally, R analytics allows data scientists to concentrate their efforts on more complex data science initiatives, reducing the amount of time they devote to data preparation and data wrangling.
Insights that are more Deep and Precise :
Nowadays, the majority of successful companies rely on data and data analytics affects virtually every aspect of their operation. Despite the fact that R is a powerful language for creating models to analyze large amounts of data, there are a lot of powerful data analysis tools that are available. Using R analytics, companies are able to collect and store data more accurately, which provides them with more valuable insight to users. Business insights are gained more accurately and more deeply with the use of analytics and statistical engines using R. R is capable of producing detailed analyses of very specific data.
Utilizing big data :
Big data can be queried with R, and many industry leaders are leveraging big data across their businesses with this tool. R analytics enables organizations to discover new insights for their data sets and give their information a coherent context. As easy as, or perhaps easier than, most other analysis tools available today, R uses big datasets to handle these big data sets.
Visualizing Interactive Data :
As another benefit, Business Analytics with R online Course allows you to create graphs and diagrams to aid in creating data visualizations and data exploration. Visualizations, 3D charts, and graphs are among the features that help users communicate with each other.
The best way to implement R analytics?
Originally designed for statisticians, R programming is now used to perform a variety of tasks, including modeling data, predictive analytics, and data mining. R provides a platform where businesses can create custom models for data collection, clustering, and analysis. The use of R analytics for business intelligence can provide a valuable way to rapidly build models that target specific areas of the business and provide tailored insights tailored to meeting every day needs.
The following purposes can be achieved using R analytics :
-
- Statistical analysis
- Predictive analytics
- Analytical prediction
- Analyzing time series
- Analyzing what-if scenarios
- Models of regression
- Exploration of data
- The forecasting process
- Searching for text
- Mining data
- Analyzing visual data
- Analytics on the web
- Analyzing social media
- Analyzing sentiment
By Turbocharging an organization's analytics program, R can be used to solve real-world business problems. An analytics platform can integrate this tool into a business's system to help users maximize data usage. You can apply statistical models to your analysis using R by applying its extensive library of functions and advanced statistical techniques. Among its advantages are that it enables businesses to identify opportunities and risks, predict business outcomes, and build interactive dashboards for an overview of the data. A better understanding of this can allow businesses to make better decisions and increase revenue.
Skills of Business Analytics with R :
Ability :
Professionals are struggling to keep up with the huge changes to the big data landscape, which makes it tough to know where to concentrate their efforts. Despite the rapidly evolving nature of the business analytics discipline, there are certain core competencies that are essential for a solid career in this field.
Business analysts should have the following characteristics :
- Communication Skills are Important :
Making sure that all stakeholders understand insights and can implement recommendations requires the ability to present findings in a clear and concise manner. Writing and presenting data can be powerful tools for people who work in analysis.
- Inquisitive :
This field requires individuals with a natural curiosity and a desire to keep learning and understanding how things function. It is important to keep up-to-date on changes in the industry, even as analysts become managers.
- The ability to solve problems :
Using logical thinking, predictive analytics, and statistics, analysts make recommendations for solving problems and propelling companies forward. An ability to solve problems naturally is crucial for a profession that strives to turn data into answers.
- Critical thinking :
It is crucial that business analytics professionals consider not only what data they collect, but about what data they should collect in the first place. In order to make good decisions, they are expected to analyze and highlight only the most relevant data.
- Using a Visualizer :
Data that is disorganized won't help anyone. An analytics professional must be able to translate and visualize data in a concise and accurate way that's easy to digest in order to create value from it.
- A detail-oriented thinker as well as a big picture thinker
-
As much as business analytics professionals need to understand complex data, they must also ensure that their recommendations will have a positive impact on the bottom line of a company. If you don't know how to leverage large quantities of information for analyzing and improving strategies, tactics and processes, having access to data is pointless.
The Technical Skills Necessary for Business Analytics :
Analytics professionals are responsible for fulfilling the demand for technical expertise in a business environment that rapidly becomes dominated by big data by wearing both analyst and developer hats. To translate data into tangible solutions, it is important to both understand tools and programming languages conceptually and practically.
Business analytics professionals should be aware of these top tools :
1. SQL :
An analytics professional's toolkit should contain the language SQL, which codes databases. SQL queries are written by professionals to retrieve and analyze data from transaction databases and to create visualizations for stakeholders to see.
2. Languages of Statistical Analysis :
R, which is used for statistical analysis, and Python, which is used in general programming, are the two most commonly used languages in analytics. Although big data sets are analyzed using either of these languages, expert knowledge in either is not necessary.
3. Software for Statistical Analysis :
A career in analytics is sometimes suited to those who are able to program. However, expertise in writing code is not necessary. For managing and analyzing data, you can utilize statistical software such as SPSS, SAS, Sage, Mathematica, and even Excel.
Benefits of Learning :
-
Use analytics tools, such as R and advanced Excel, to explore, analyze, and solve business problems
-
Learn how to collect data and the 'what' and 'how'
-
Discover how to measure and analyze data using Industry Best Practices
-
Business Objectives will be communicated to data analysts in a focused manner & they will be able to formulate better conclusions from data analysis.
-
Develop business strategies that are goal-oriented
-
Integrate+integrate+analyse customer data from multiple sources and engage with customers in real time to gain an overall view of customers across multiple channels
-
Analyzing transactional data helps to determine the affinity of products.
-
Understanding analytically-based financial decision making will assist in bolstering your company's profit margins
-
Market share can be increased by taking actionable data-driven decisions
-
Predictive models can be adjusted to macro changes with this tool
Career Benefits :
- Prepare yourself for jobs requiring a background in analytics
- Opening doors to international job opportunities requiring specialized skills
- Talent Shortage gives you access to thousands of untapped analytics jobs that pay well
- You will be promoted within your current profile with the most highly sought-after skills
- When interviewing for a job, separate your profile from those of your peers
- The 'Certified Business Analytics Practitioner' (CBAP) certification is rewarding and a great career switch
- Add your name next to the Hallmark of Global Credential-CBAP Professional to your business card
- The best way to improve your CV and LinkedIn profile is to develop your skills
- Provide high ROI support for startups
- Become a leader in today's most exciting field, Analytics!
The Career Benefits of R Programming Training :
-
We offer our students a variety of career-related benefits. Students who go through this course often get better jobs as a result of their education. Other people started their own businesses as well, including consulting firms. We have a student who became so passionate about machine learning and statistics that he is now doing a Ph.D. in machine learning full time.
-
A candidate's aspirations determine how much he or she will gain from a career change. In fact, many of our students moved into data-science roles after taking this course, whether looking for a new job or even moving within their company. Freshers seeking career advancement who do not only wish to do web development, testing, or typical software engineering jobs may find this course to be a great difference maker in their career and life goals.
-
Therefore, we suggest to our students to not worry too much about benefits. Rather, learn all the concepts, learn the skill, become confident in coding and solving problems, and then you will certainly receive the benefit because you will be the one receiving it, not the third person. In fact, R programming is more relevant now than it has ever been, and we cover everything a student needs with extensive practice and real-world applications. This seventy-hour course covers everything a student needs.
At the End of the Training, You will Get :
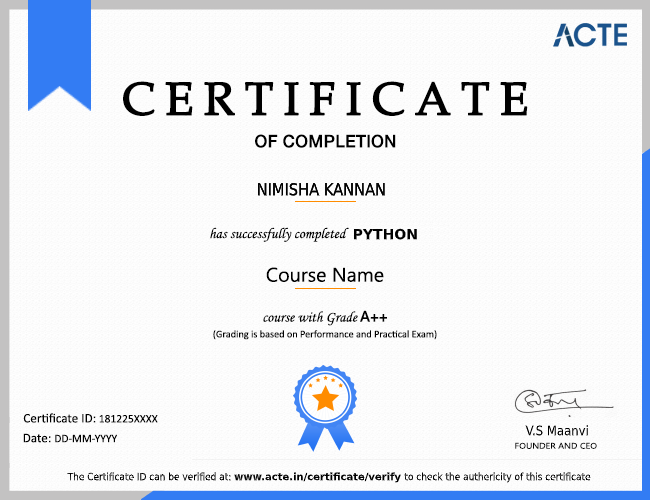
You will learn all the topics required to pass the Business Analytics with R certification course in our Business Analytics with R course. Participants will receive a Business Analytics with R certification guide, Business Analytics with R certification practice questions, and Business Analytics with R certification sample questions.


