Essential Skills Need to Master in Data Analyst – Expert’s Top Picks
Last updated on 15th Jul 2020, Blog, General
- Today, with the deepening of the concept of data operation, more and more companies are aware of the value of data-driven business strategies and emphasize the participation of all employees in data operations.
- Developing the ability to analyze data is also a future trend. So do you know how to be a good data analyst and how to stay competitive in the job market?
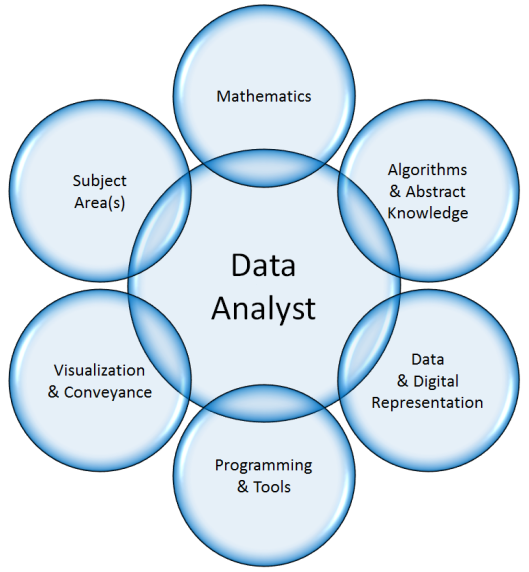
- Here are the key skills that data analysts need to master.
1. SQL
- SQL, or Structured Query Language, is the ubiquitous industry-standard database language and is possibly the most important skill for data analysts to know.
- The language is often thought of as the “graduated” version of Excel; it is able to handle large datasets that Excel simply can’t.
- Almost every organization needs someone who knows SQL—whether to manage and store data, relate multiple databases (like the ones Amazon uses to recommend products you may be interested in,) or build or change those database structures altogether.
- Each month, thousands of job postings requiring SQL skills are posted, and the median salary for someone with advanced SQL skills sits well over $75,000. While even non-techies can benefit from learning this tool, if you’re looking to work with Big Data, learning SQL is the first step.
- Data analysts should be familiar with commonly used databases such as Oracle, SQL Server, DB2, MySQL and MongoDB. Moreover, they know how to write SQL, including various statistical functions like join, group by, order by, distinct, sum, count, average, etc.
- In addition to the skilled use of SQL statements, data analysts should also know about the storage and reading process of the database.
- When dealing with large data volumes, how to find ways to speed up the program, reduce network traffic, and improve the security of the database is very important.
2. Microsoft Excel
- When you think of Excel, the first thing that comes to mind is likely a spreadsheet, but there’s a lot more analysis power under the hood of this tool.
- While a programming language like R or Python is better suited to handle a large data set, advanced Excel methods like writing Macros and using VBA lookups are still widely used for smaller lifts and lighter, quick analytics.
- If you are working at a lean company or startup, the first version of your database may even be in Excel. Over the years, the tool has remained a mainstay for businesses in every industry, so learning it is a must.
- Luckily, there is an abundance of great free resources online to help you get started, as well as structured data analytics classes for those looking for a deeper understanding of the tool.
- Excel is a common data analysis tool in daily work. And it is easy to get started with this tool. It can not only do simple two-dimensional tables, complex nested tables, but also create line charts, column charts, bar charts, area charts, pie charts, radar charts, combo charts, scatter charts, etc.
- Besides, Excel can implement more advanced features, including PivotTables (similar to BI’s multidimensional analysis model Cube), and complex functions such as Vlookup. It can easily process hundreds of thousands of pieces of data.
Learning excel is a gradual process.
- Basics: simple table data processing, printing, querying, filtering, sorting
- Functions and formulas: common functions, advanced data calculations, array formulas, multidimensional references
- Visualization: graphic display, advanced charts, chart plugins
- PivotTable, VBA program development
3. Critical Thinking
- Using data to find answers to your questions means figuring out what to ask in the first place, which can often be quite tricky.
- To succeed as an analyst, you have to think like an analyst. It is the role of a data analyst to uncover and synthesize connections that are not always so clear.
- While this ability is innate to a certain extent, there are a number of tips you can try to help improve your critical thinking skills.
- For example, asking yourself basic questions about the issue at hand can help you stay grounded when searching for a solution, rather than getting carried away with an explanation that is more complex than it needs to be.
- Additionally, it is important that you remember to think for yourself instead of relying on what already exists.
4. R or Python–Statistical Programming
- Anything Excel can do, R or Python can do better—and 10 times faster. Like SQL, R and Python can handle what Excel can’t.
- They are powerful statistical programming languages used to perform advanced analyses and predictive analytics on big data sets.
- And they’re both industry standard. To truly work as a data analyst, you’ll need to go beyond SQL and master at least one of these languages.
- So which one should you learn? Both R and Python are open source and free, and employers typically don’t care which their employees choose to use as long as their analyses are accurate.
- Since it was built specifically for analytics, however, some analysts prefer R over Python for exploring data sets and doing ad-hoc analysis.
Pro Tip: Wondering about SPSS or SAS? Learning R or Python over these tools is considered best practice because, like Excel, SAS programs are limited.
5. Data Visualization
- Being able to tell a compelling story with data is crucial to getting your point across and keeping your audience engaged. If your findings can’t be easily and quickly identified, then you’re going to have a difficult time getting through to others. For this reason, data visualization can have a make-or-break effect when it comes to the impact of your data.
- Analysts use eye-catching, high-quality charts and graphs to present their findings in a clear and concise way.
- Tableau’s visualization software is considered an industry-standard analytics tool, as it is refreshingly user-friendly.
- The results of the data analysis are ultimately presented to others, and visualization skills are also a measure of the level of data analysts.
- We want to make sure that the right chart type is chosen for the data and that the results are displayed quickly and clearly.
- Data visualization tools like D3.js, HighCharts, Tableau and PowerBI all have their own advantages.
- You must be proficient in at least one visualization tool. If you want to know which tools you can learn, you can read this article 9 Data Visualization Tools That You Cannot Miss in 2019.
- In my case, I often use FineReport at work, which is designed based on “no-code development” concept. FineReport can be directly connected to all kinds of databases, and it is convenient and quick to customize various complex reports and cool dashboards.
- At this point, if you master the above skills, you can be considered a qualified analyst.
- Data analysts at this stage need to know how to use tools to process data, understand business scenarios, and analyze and solve basic problems.
- After that, if you want to delve into the technology and even develop in the direction of data scientists, you should learn the following skills.
6. Presentation Skills
- Data visualization and presentation skills go hand-in-hand. But presenting doesn’t always come naturally to everyone, and that’s okay! Even seasoned presenters will feel their nerves get the best of them at times.
- As with anything else, start with practice—and then practice some more until you get into your groove.
- Forbes also suggests setting specific goals for your improvement and focusing on the audience rather than yourself as ways of getting more comfortable with presenting.
7. Machine Learning
- As artificial intelligence and predictive analytics are two of the hottest topics in the field of data science, an understanding of machine learning has been identified as a key component of an analyst’s toolkit.
- While not every analyst works with machine learning, the tools and concepts are important to know in order to get ahead in the field. You’ll need to have your statistical programming skills down first to advance in this area, however. An “out-of-the-box” tool like Orange can also help you start building machine learning models.

Best Data Analytics Certification Training Courses to Boost UP Your Skills
Weekday / Weekend BatchesSee Batch Details8.Statistics
- First you have to learn the statistics systematically. Pure machine learning emphasizes the predictive ability and implementation of algorithms, but statistics have always emphasized interpretability.
- You need to understand the principles behind the data. The following statistical methods are all you can learn.
- Statistical methods related to data mining: multivariate logistic regression analysis, nonlinear regression analysis, discriminant analysis, etc.
- Quantitative methods: time axis analysis, probability model, optimization
- Decision analysis: multi-purpose decision analysis, decision tree, influence diagrams, sensitivity analysis
- Analysis of competitive advantages: learning basic analytical concepts through projects and success cases
- Database principles: data model, database design
- Predictive analysis: time axis analysis, principal component analysis, nonparametric regression, statistical process control
- Data management: ETL (Extract, Transform, Load), data governance, management responsibility, metadata
- Optimization and heuristics: integer programming, nonlinear programming, local exploration, super-inspiration (simulated annealing, genetic algorithm)
- Big data analysis: learning of unstructured data concepts, MapReduce technology, big data analysis methods
- Data mining: clustering (k-means method, segmentation method), association rules, factor analysis, survival time analysis
- Computer simulation of risk analysis and operational analysis
- Software-level analytics: analytical topics at the organizational level, IT and business users, change management, data topics, presentation and communication
9. Programming Language
- Proficiency in some programming languages can make data analysis work more flexible. Programming languages are suitable for all types of data.
- Most of the new and amazing dashboards can be implemented with code or drawing software.
- Python
The biggest advantage of Python is that it is good at handling large amounts of data, with good performance and no downtime. It is especially suitable for cumbersome calculations and analysis. Moreover, Python’s syntax is easy to read. It is more popular with IT staff because of the ability to create data graphs with many modules.
- HTML & JavaScript & CSS
Many visualization softwares are web-based, and visualization development is inseparable from programming languages. As people become more reliant on browser work, the function of web browsers is getting better and better. With HTML, JavaScript, and CSS, you can run the visual display program directly.
- R
The R language is the most favorite analysis software for the statisticians. It is open source and free, and its graphic function is very powerful.
R is designed for data analysis. And it was originally intended for statisticians and data scientists. However, due to the increasing popularity of data analysis, the use of the R language is not limited.
The use flow of R is very clear. There are many toolkits that support R. Just load the data into R and write one or two lines of code to create the data graph. For example, use the Portfolio toolkit to quickly create the following hierarchy diagram.