
35+ BEST Data Science [ Google ] Interview Questions & Answers
Last updated on 04th Jul 2020, Blog, Interview Questions
Google plays a significant role in data science through its diverse tools and services. Google Cloud Platform (GCP) offers BigQuery, a serverless data warehouse for fast SQL queries, and TensorFlow, an open-source machine learning framework widely utilized for building and training models. Google Colab provides a collaborative Jupyter notebook environment with free access to GPU and TPU resources. Additionally, Dataflow enables stream and batch processing of big data, and Cloud Storage offers a scalable and secure object storage service.
1. What is the difference between supervised and unsupervised learning?
Ans:
Supervised learning involves training a model on a labeled dataset, where the algorithm learns from both input data and corresponding output labels. The goal is to map input features to the correct output.
Unsupervised learning, on the other hand, deals with unlabeled data. The algorithm explores the data’s inherent structure or patterns without explicit guidance on the output.
2. Explain the bias-variance tradeoff.
Ans:
The bias-variance tradeoff is a crucial concept in machine learning model evaluation. Bias refers to the error introduced by approximating a real-world problem, making it too simple. Variance, on the other hand, is the error introduced by the model’s sensitivity to small fluctuations in the training data, making it too complex.
3. What is regularization, and why is it important?
Ans:
Regularization is a technique used to prevent overfitting in machine learning models. In overfitting, a model learns not only the underlying patterns in the training data but also noise, making it less effective on new data. Regularization is crucial when dealing with complex models and limited datasets, helping to improve a model’s generalization performance.
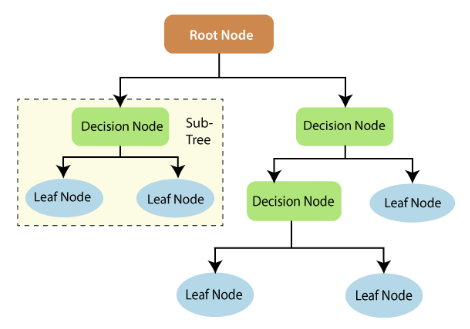
4. How does a decision tree work?
Ans:
A decision tree is a tree-like model where each internal node represents a decision based on a particular feature, and each leaf node represents the predicted outcome. The tree is constructed by recursively splitting the dataset based on the most informative feature at each node. The decision-making process starts at the root node, where the dataset is split into subsets based on a selected feature.
5. What is the curse of dimensionality?
Ans:
The curse of dimensionality refers to the challenges and issues that arise when dealing with high-dimensional data. As the number of features or dimensions in a dataset increases, the amount of data required to generalize accurately grows exponentially.
Several problems stem from the curse of dimensionality:
- Sparsity of Data
- Increased Computational Complexity
- Overfitting
- Data Visualization Challenges
6. Explain the term “one-hot encoding.”
Ans:
One-hot encoding is a method used to represent categorical variables in a binary format, making them suitable for machine learning algorithms that require numerical input. In one-hot encoding, each unique category in a categorical variable is represented by a binary vector.
7. What is cross-validation, and why is it useful?
Ans:
Cross-validation is a model evaluation technique that helps assess a model’s performance by partitioning the dataset into multiple subsets, training the model on some of these subsets, and testing it on the remaining subsets. It helps detect issues like overfitting or underfitting, as the model is evaluated on multiple subsets of the data.
8. Explain the concept of feature engineering.
Ans:
Feature engineering is the process of creating new features or modifying existing ones to enhance a model’s performance. It involves selecting, transforming, and creating features to improve a model’s ability to capture patterns and relationships in the data. Examples include creating interaction terms, handling missing values, and scaling features.
9. What is the difference between bagging and boosting?
Ans:
Bagging (Bootstrap Aggregating) and boosting are ensemble learning techniques. Bagging involves training multiple models independently on random subsets of the data and averaging their predictions. Random Forest is a popular bagging algorithm.
Boosting, on the other hand, focuses on training models sequentially, giving more weight to misclassified instances in each iteration. Gradient Boosting and AdaBoost are common boosting algorithms.
10. How does K-means clustering work?
Ans:
K-means clustering is an iterative algorithm used for partitioning a dataset into K distinct, non-overlapping subsets (clusters). The steps of the K-means algorithm are as follows:
Initialization: Randomly select K data points from the dataset as initial cluster centroids.
Assignment: Assign each data point to the nearest centroid, forming K clusters.
Update Centroids: Recalculate the centroids of each cluster as the mean of the data points assigned to that cluster.
Repeat: Repeat steps 2 and 3 until convergence, where the centroids no longer change significantly or a specified number of iterations is reached.
11. Explain the purpose of the confusion matrix in classification.
Ans:
A confusion matrix is a table used to evaluate the performance of a classification model. It compares the predicted labels against the true labels and includes metrics such as true positives, true negatives, false positives, and false negatives. From the confusion matrix, various metrics like accuracy, precision, recall, and F1 score can be derived, providing a comprehensive assessment of the model’s performance.
12. What is the role of activation functions in neural networks?
Ans:
Activation functions introduce non-linearity to neural networks, enabling them to learn complex relationships in the data. Common activation functions include sigmoid, tanh, and Rectified Linear Unit (ReLU).
Sigmoid and tanh are often used in the hidden layers to squash the output between 0 and 1 or -1 and 1, while ReLU is popular for its simplicity and efficiency, promoting the activation of neurons with positive inputs.
13. Explain the term “gradient descent” in the context of machine learning.
Ans:
Gradient descent is an optimization algorithm used to minimize the cost function of a model during training. It iteratively adjusts the model’s parameters in the direction of the steepest decrease in the cost function, determined by the negative gradient. The learning rate controls the step size in each iteration. There are variations of gradient descent, including stochastic gradient descent (SGD) and mini-batch gradient descent, which use subsets of the training data to update the parameters.
14. What is the difference between L1 and L2 regularization?
Ans:
| Aspect | L1 Regularization | L2 Regularization | |
| Penalty |
\(\lambda \sum |w_i|\) |
\(\lambda \sum w_i^2\) | |
| Effect on Model | Encourages sparsity, some coefficients become exactly zero | Penalizes large values, but doesn’t encourage sparsity | |
| Use Cases | Feature selection | Prevents overfitting | |
| Mathematical Form |
\(\lambda \sum |w_i|\) (L1 norm) |
\(\lambda \sum w_i^2\) (L2 norm) |
15. Explain the concept of word embeddings in natural language processing (NLP).
Ans:
Word embeddings are vector representations of words in a continuous vector space, capturing semantic relationships between words. Techniques like Word2Vec, GloVe, and FastText are used to generate word embeddings. These embeddings are valuable in NLP tasks as they encode semantic meaning and enable algorithms to better understand the contextual relationships between words in a document.
16. What is the difference between precision and recall?
Ans:
Precision and recall are two metrics used in classification models. Precision is the ratio of correctly predicted positive observations to the total predicted positives, emphasizing the accuracy of positive predictions. Recall, on the other hand, is the ratio of correctly predicted positive observations to the total actual positives, focusing on capturing all positive instances.
17. Explain the concept of cross-entropy loss.
Ans:
Cross-entropy loss, or log loss, is a measure of the difference between the predicted probabilities and the actual outcomes in classification problems. It is commonly used as the loss function for models performing binary or multiclass classification. The goal is to minimize the cross-entropy loss, indicating that the predicted probabilities align closely with the true labels.
18. Explain the concept of a ROC curve and AUC in binary classification.
Ans:
The Receiver Operating Characteristic (ROC) curve is a graphical representation of a binary classification model’s performance across different decision thresholds. It plots the true positive rate (sensitivity) against the false positive rate (1-specificity) for various threshold values.
The Area Under the ROC Curve (AUC) summarizes the overall performance of the model, with a higher AUC indicating better discrimination between classes. AUC is a valuable metric for assessing the model’s ability to distinguish between positive and negative instances.
19. What is the purpose of the term frequency-inverse document frequency in NLP.
Ans:
Term frequency-inverse document frequency (TF-IDF) is a numerical statistic that evaluates the importance of a term in a document within a collection of documents. It consists of two components: term frequency (TF), which measures how often a term appears in a document, and inverse document frequency (IDF), which penalizes terms that are common across many documents. TF-IDF is used to vectorize text data, representing documents as numerical vectors that capture the importance of terms while mitigating the impact of common words.
20. Explain the concept of batch normalization in neural networks.
Ans:
- Batch normalization is a technique used in neural networks to normalize the inputs of each layer, mitigating issues related to internal covariate shift.
- It involves normalizing the inputs of a layer by subtracting the mean and dividing by the standard deviation of the mini-batch during training.
21. What is the purpose of the term “precision-recall trade-off” in machine learning?
Ans:
The precision-recall trade-off refers to the inherent tension between precision and recall in classification models. Increasing precision typically leads to a decrease in recall and vice versa. This trade-off is especially relevant when adjusting decision thresholds in a model. Finding the right balance depends on the specific requirements of the task; for instance, in medical diagnosis, achieving high recall may be more critical than precision.
22. Explain the concept of collaborative filtering in recommendation systems.
Ans:
Collaborative filtering is a technique used in recommendation systems to make predictions about a user’s preferences based on the preferences of other users.
There are two main types: user-based collaborative filtering, which recommends items based on the preferences of similar users, and item-based collaborative filtering, which recommends items similar to those the user has liked.
23. What is the purpose of A/B testing, and how is it typically conducted in practice?
Ans:
A/B testing is a method used to compare two versions of a product or feature to determine which performs better. It involves dividing users into two groups: Group A experiences the existing version (control), while Group B experiences a modified version (treatment). Metrics such as conversion rates or user engagement are then compared between the groups to assess the impact of the changes.
24. Explain the concept of LSTMs in recurrent neural networks.
Ans:
- LSTMs are a type of RNN designed to address the vanishing gradient problem, allowing for the learning of long-term dependencies in sequential data.
- LSTMs use memory cells with gating mechanisms to control the flow of information, enabling them to selectively remember.
25. What is the purpose of the Kullback-Leibler (KL) divergence in probability theory?
Ans:
The Kullback-Leibler (KL) divergence measures the difference between two probability distributions. In machine learning, it is often used to quantify the dissimilarity between a predicted probability distribution and the true distribution. KL divergence is commonly employed in variational autoencoders and other probabilistic models for training and assessing the quality of generated samples.
26. Explain the concept of bag-of-words in natural language processing (NLP).
Ans:
Bag-of-words is a text representation technique where a document is represented as an unordered set of words and their frequencies. It discards word order and grammar, focusing only on the occurrence and frequency of words. This representation is often used in text classification and information retrieval tasks, forming the basis for techniques like term frequency-inverse document frequency (TF-IDF) and Naive Bayes classifiers.
27. What is the purpose of the Expectation-Maximization (EM) algorithm?
Ans:
The Expectation-Maximization (EM) algorithm is an iterative optimization technique used in unsupervised learning, particularly in cases where data is incomplete or partially observed. It aims to maximize the likelihood function of the observed data by iteratively estimating the distribution of latent (unobserved) variables.
28. What is the purpose of a p-value in statistical hypothesis testing?
Ans:
In statistical hypothesis testing, a p-value is a measure of the evidence against a null hypothesis. It represents the probability of obtaining the observed data, or more extreme results, under the assumption that the null hypothesis is true.
A low p-value (typically below a significance level, e.g., 0.05) suggests that the observed data is unlikely to have occurred by chance alone, leading to the rejection of the null hypothesis.
29. Explain the concept of Bayes’ Theorem and its relevance in machine learning.
Ans:
Bayes’ Theorem is a fundamental probability theorem that describes the probability of an event based on prior knowledge of conditions related to the event. In the context of machine learning, Bayes’ Theorem is often used in Bayesian statistics and Bayesian inference. It provides a framework for updating beliefs about a hypothesis as new evidence becomes available. In Bayesian machine learning, it’s particularly relevant in the context of probabilistic models, such as Naive Bayes classifiers.
30. Explain the concept of transfer learning in the context of deep learning.
Ans:
Transfer learning is a technique in deep learning where a pre-trained model on a large dataset is used as the starting point for a new, related task. Instead of training a neural network from scratch, transfer learning leverages the knowledge gained from the pre-trained model to expedite learning on the new task. This approach is especially useful when the new task has limited data, as the model has already learned useful features from the original dataset.

Learn Hands-on Experience from Google Data Science Training Course
Weekday / Weekend BatchesSee Batch Details31. What are autoencoders, and how are they used in unsupervised learning?
Ans:
Autoencoders are a type of neural network designed for unsupervised learning and dimensionality reduction. The goal is to minimize the difference between the input and the reconstructed output.
The architecture consists of an encoder that compresses input data into a lower-dimensional representation (encoding), and a decoder that reconstructs the input data from this encoding.
32. Explain the concept of time series analysis and its applications.
Ans:
- Time series analysis involves studying and modeling data points collected over time to identify patterns, trends, and seasonality.
- It is widely used in various fields such as finance, economics, and weather forecasting.
- Techniques in time series analysis include autoregressive integrated moving average (ARIMA) models, seasonal decomposition of time series (STL), and machine learning methods like recurrent neural networks (RNNs) for predicting future values based on historical data.
33. Explain the concept of hyperparameter tuning in machine learning.
Ans:
Hyperparameter tuning involves optimizing the hyperparameters of a machine learning model to improve its performance. Hyperparameters are external configuration settings that are not learned from the data but impact the model’s behavior. Techniques for hyperparameter tuning include grid search, random search, and more advanced methods like Bayesian optimization. Proper tuning can significantly enhance a model’s ability to generalize well to new, unseen data.
34. What is the role of dropout in neural networks, and how does it prevent overfitting?
Ans:
Dropout is a regularization technique used in neural networks to prevent overfitting. During training, randomly selected neurons (units) are “dropped out” or excluded from the network in each iteration.
This means their contributions to the forward and backward pass are ignored. Dropout introduces a form of ensemble learning, where different combinations of neurons are active in each training iteration.
35. Explain the concept of a Gaussian Mixture Model (GMM) in unsupervised learning.
Ans:
- A Gaussian Mixture Model (GMM) is a probabilistic model used for unsupervised learning.
- It represents the data as a mixture of several Gaussian distributions, each with its own set of parameters (mean, covariance, and weight).
- GMMs are frequently used for clustering jobs because they can detect underlying subpopulations in data.
- To estimate the parameters of a GMM, the Expectation-Maximization (EM) technique is widely utilised.
36. How do precision and recall relate to the F1 score?
Ans:
The F1 score, being the harmonic mean of precision and recall, strikes a balance between the two, offering a single metric that considers both false positives and false negatives. This makes it particularly valuable in scenarios with imbalanced class distributions, providing a comprehensive evaluation of a model’s effectiveness.
37. What are the advantages of using decision trees in machine learning?
Ans:
- Easy to understand and interpret visually.
- Can handle both numerical and categorical data.
- Requires minimal data preprocessing (e.g., normalization).
- Robust to outliers.
38. Explain the concept of word2vec and its significance in NLP.
Ans:
Word2Vec is a popular word embedding technique in NLP that represents words as dense vectors in a continuous vector space. It captures semantic relationships between words by learning distributed representations based on the context in which words appear. Word2Vec models, such as Skip-gram and Continuous Bag of Words (CBOW), are trained on large corpora to generate word embeddings that encode syntactic and semantic similarities.
39. Explain the concept of Principal Component Analysis (PCA).
Ans:
Principal Component Analysis (PCA) is a dimensionality reduction technique used to transform high-dimensional data into a lower-dimensional representation while retaining as much of the original variance as possible. PCA identifies orthogonal axes (principal components) along which the data varies the most.
40. What is the purpose of LDA (Latent Dirichlet Allocation) in topic modeling?
Ans:
- Latent Dirichlet Allocation (LDA) is a generative probabilistic model used for topic modeling in natural language processing.
- LDA assumes that documents are mixtures of topics and that each topic is a distribution over words.
- The model aims to infer the latent topics that generated the observed documents.
- LDA has applications in document clustering, summarization, and understanding the underlying thematic structure in large text corpora.
41. What is the role of the learning rate in gradient descent?
Ans:
The learning rate is a hyperparameter in gradient descent that determines the step size during each iteration of parameter updates. It influences the convergence and stability of the training process. A too-small learning rate may lead to slow convergence, while a too-large learning rate may cause the algorithm to overshoot the optimal solution or even diverge. Techniques like learning rate schedules, adaptive learning rates, and momentum are often used to improve the efficiency of gradient descent.
42. Explain the concept of the Expectation-Maximization (EM) algorithm.
Ans:
The Expectation-Maximization (EM) algorithm is an iterative optimization technique used in unsupervised learning. It is employed when dealing with models that have latent variables or incomplete data. The algorithm alternates between an Expectation (E) step, where the expected values of the latent variables are computed given the observed data, and a Maximization (M) step, where the model parameters are updated to maximize the likelihood function.
43. Explain the concept of the curse of dimensionality.
Ans:
The curse of dimensionality refers to the challenges and issues that arise when dealing with high-dimensional data. As the number of features or dimensions increases, the amount of data needed to generalize accurately grows exponentially. This can lead to problems such as increased computational complexity, sparsity of data, and the risk of overfitting.
44. Explain the concept of regularization in machine learning.
Ans:
- Regularization is a technique used in machine learning to prevent overfitting by adding a penalty term to the cost function.
- The penalty discourages the model from becoming too complex, thus improving generalization to new, unseen data.
- Common regularization methods include L1 regularization (Lasso), which adds the absolute values of the coefficients to the cost function, and L2 regularization (Ridge), which adds the squared values of the coefficients.
45. Explain the concept of imbalanced datasets in machine learning.
Ans:
Imbalanced datasets occur when one class is significantly underrepresented compared to others. Techniques to address imbalanced datasets include:
Resampling: Upsampling the minority class or downsampling the majority class to balance the class distribution.
Synthetic data generation: Creating synthetic examples of the minority class using techniques like SMOTE (Synthetic Minority Over-sampling Technique).
Algorithmic approaches: Adjusting model parameters or using algorithms designed to handle imbalanced datasets, such as cost-sensitive learning or ensemble methods like balanced bagging.
46. Explain the concept of time series decomposition.
Ans:
Time series decomposition involves breaking down a time series into its constituent components: trend, seasonality, and residual (error). Trend represents the long-term progression, seasonality captures repeating patterns, and the residual is the random noise or error.
47. What is the role of activation functions in neural networks?
Ans:
Activation functions introduce non-linearity to neural networks, enabling them to learn complex relationships in the data. While sigmoid and tanh were popular choices in the past, ReLU (Rectified Linear Unit) has gained popularity due to its simplicity and efficiency. ReLU sets negative values to zero, accelerating convergence by allowing the network to focus on more informative features.
48. What is the purpose of word embeddings, and how are they generated using methods?
Ans:
- Word embeddings are vector representations of words in a continuous vector space that capture semantic relationships between words.
- Methods like Word2Vec and GloVe generate word embeddings by learning distributed representations based on the context in which words appear.
49. Explain the concept of word frequency-inverse document frequency (TF-IDF).
Ans:
TF-IDF is a numerical statistic that evaluates the importance of a term in a document within a collection of documents. It combines two components: term frequency (TF), which measures how often a term appears in a document, and inverse document frequency (IDF), which penalizes terms that are common across many documents.
50. What is the difference between bag-of-words and Word2Vec in NLP?
Ans:
Bag-of-words represents a document as an unordered set of words and their frequencies, discarding word order and grammar.
Word2Vec, on the other hand, is a word embedding technique that represents words as dense vectors in a continuous vector space.

Enroll in Google Data Science Training from Expert Instructors
- Instructor-led Sessions
- Real-life Case Studies
- Assignments
51. Explain the purpose of the Naive Bayes classifier in machine learning.
Ans:
The Naive Bayes classifier is a probabilistic model based on Bayes’ theorem. It assumes that features are conditionally independent given the class label, leading to the “naive” assumption. Despite its simplicity, Naive Bayes is effective for classification tasks, especially in natural language processing (NLP).
52. Explain the concept of the K-Nearest Neighbors (KNN) algorithm.
Ans:
- KNN is a simple and intuitive algorithm used for classification and regression tasks.
- It classifies a new data point based on the majority class of its k-nearest neighbors in the feature space.
- The choice of k influences the algorithm’s sensitivity to local variations.
53. Explain the concept of word sense disambiguation in natural language processing.
Ans:
Word sense disambiguation (WSD) is the task of determining the correct meaning (sense) of a word based on its context in a sentence. Many words have multiple meanings, and WSD helps algorithms understand the intended sense in a given context. Techniques for WSD include rule-based methods, supervised learning, and unsupervised learning. WSD is crucial for tasks such as machine translation, sentiment analysis, and information retrieval.
54. Explain the concept of ensemble learning and its advantages.
Ans:
- Ensemble learning involves combining the predictions of multiple models to improve overall performance.
- Common ensemble methods include bagging (e.g., random forests) and boosting (e.g., AdaBoost).
- The advantages of ensemble learning include increased accuracy, robustness, and generalization performance.
55. Explain the concept of sentiment analysis in natural language processing.
Ans:
Sentiment analysis, or opinion mining, involves determining the sentiment expressed in a piece of text, such as positive, negative, or neutral. It has applications in social media monitoring, customer feedback analysis, and product reviews. Sentiment analysis can be approached using techniques ranging from rule-based methods to machine learning models, including supervised learning with techniques like Naive Bayes or more advanced methods like recurrent neural networks (RNNs) and transformers.
56. What is the purpose of the term “mean squared error” in regression?
Ans:
Mean Squared Error (MSE) is a common metric used to evaluate the performance of regression models. It measures the average squared difference between predicted and actual values.
A lower MSE indicates better model performance, as it signifies that the model’s predictions are closer to the actual values.
MSE is sensitive to outliers and amplifies large errors, making it important to consider the context of the data and potentially explore alternative metrics.
57. Explain the concept of the term “precision” in classification.
Ans:
Precision is a metric used in classification models that measure the accuracy of positive predictions among the instances predicted as positive. It is calculated as the ratio of true positives (correctly predicted positive instances) to the sum of true positives and false positives (instances incorrectly predicted as positive). Precision is particularly relevant in scenarios where minimizing false positives is crucial.
58. Explain the concept of Bayesian inference and its application in machine learning.
Ans:
- Bayesian inference is a statistical method that involves updating probability estimates based on new evidence.
- In machine learning, it is applied in Bayesian models, such as Bayesian networks or Bayesian classifiers.
- Bayesian inference allows for the incorporation of prior knowledge and updating beliefs as new data becomes available.
59. Explain the concept of entropy in decision trees and information gain.
Ans:
Entropy is a measure of impurity or disorder in a set of data. In decision trees, entropy is used to quantify the uncertainty or randomness of a particular split. Information gain is a metric that measures the reduction in entropy achieved by a split. Decision tree algorithms, such as ID3 or C4.5, aim to find splits that maximize information gain, leading to nodes with more homogeneous groups of data. Lower entropy indicates a more pure or ordered set.
60. Explain the concept of A/B testing and its applications in data science.
Ans:
- A/B testing, or split testing, is a method used to compare two versions (A and B) of a product, feature, or intervention to determine which performs better.
- It involves dividing users or participants into two groups: one exposed to the existing version (control) and the other to a modified version (treatment).
- Metrics such as conversion rates, click-through rates, or user engagement are then compared between the two groups to assess the impact of the changes.
61. What is the purpose of the term “bias” in machine learning?
Ans:
Bias in machine learning refers to the systematic error or deviation of predictions from the true values. It can occur when a model makes overly simplistic assumptions that do not capture the underlying patterns in the data. Bias can be addressed through techniques such as feature engineering, model complexity adjustments, and using more sophisticated algorithms.
62. Explain the concept of imputation in data preprocessing.
Ans:
Imputation is the process of filling in missing values in a dataset. Handling missing data is crucial for preventing bias and ensuring the robustness of machine learning models.
Imputation methods include mean or median imputation, where missing values are replaced with the mean or median of the observed values, and more sophisticated methods like k-nearest neighbors imputation or regression imputation.
63. What is the purpose of the term “confounding variable” in statistical analysis?
Ans:
- A confounding variable is a variable that is related to both the independent variable and the dependent variable in a study.
- It can introduce bias and affect the interpretation of results by falsely suggesting a causal relationship between the independent and dependent variables.
- Controlling for or stratifying by confounding variables is essential to isolate the true relationship between variables.
64. Explain the trade-off between bias and variance in machine learning models.
Ans:
The bias-variance trade-off involves finding the right balance between a model’s ability to represent the underlying patterns in the data (low bias) and its sensitivity to noise (low variance). A model with high bias may oversimplify the data, while high conflict can lead to overfitting.
65. How does k-fold cross-validation work, and why is it useful?
Ans:
- Dividing the dataset into k folds.
- Training the model on k-1 folds.
- Validating it on the remaining fold.
K-fold cross-validation involves:
This process is repeated k times, and the performance metrics are averaged. It helps assess a model’s performance on different subsets of the data, reducing the risk of overfitting.
66. What are embeddings in natural language processing (NLP)?
Ans:
Embeddings in NLP represent words or phrases as vectors in a continuous vector space. Word embeddings capture semantic relationships between terms and are often pre-trained on large corpora, such as Word2Vec or GloVe.
67. How does the MapReduce paradigm work?
Ans:
MapReduce is a programming model for processing and generating large datasets that parallelize computation across distributed clusters. It consists of two phases: the Map phase, where data is split into key-value pairs, and the Reduce phase, where these pairs are processed. MapReduce is widely used for processing big data in a scalable and fault-tolerant manner.
68. What is the difference between a probability density and a cumulative distribution function?
Ans:
- A probability density function (PDF) describes the likelihood of a continuous random variable taking on a particular value.
- In contrast, a cumulative distribution function (CDF) gives the probability that the variable is less than or equal to a specific value.
69. Explain the use of ROC curves in binary classification tasks.
Ans:
ROC (Receiver Operating Characteristic) curves are used to evaluate the performance of binary classification models by plotting the actual positive rate against the false positive rate at various threshold settings. The area under the ROC curve (AUC-ROC) provides a summary measure of the model’s performance.
70. How does the Expectation-Maximization (EM) algorithm work?
Ans:
The Expectation-Maximization algorithm is an iterative optimization algorithm that estimates parameters in statistical models with latent variables.
It involves two steps: the E-step computes the expected values of the latent variables given the observed data, and the M-step maximizes the likelihood function based on these expectations.
71. How should a deployed model be maintained?
Ans:
A deployed model should be regularly monitored for performance, and updates should be made as needed. This includes retraining the model with new data, addressing concept drift, and updating dependencies to ensure compatibility. Regular evaluations and quality checks help maintain the model’s effectiveness over time.
72. What role does the p-value play?
Ans:
The p-value in statistical hypothesis testing indicates the evidence against a null hypothesis. A low p-value (typically less than 0.05) suggests that there is significant evidence to reject the null hypothesis, indicating a potential relationship between variables or an effect in the data.
73. Mention a few sampling strategies.
Ans:
- Simple random sampling
- Stratified sampling
- Systematic sampling
- Cluster sampling
74. What does power analysis entail?
Ans:
Power analysis is a statistical method used to determine the probability that a study will detect an effect if it exists. It involves calculating statistical power, which is influenced by factors such as sample size, effect size, and significance level. Higher power indicates a greater likelihood of detecting true effects.
75. What is the analysis of the root cause?
Ans:
Root cause analysis involves identifying the fundamental reason(s) behind a problem or an event. It aims to discover the underlying factors that contribute to an issue, allowing for effective solutions to be implemented to prevent recurrence.
76. What distinguishes “Long” format data from “Wide” format data?
Ans:
Long format data typically has multiple rows for each subject, with a column indicating a variable name and another column containing the variable values.
Broad format data, on the other hand, represents variables with multiple columns, often with one row per subject. A long format is more suitable for specific analyses and visualization tasks.
77. What does linear regression mean?
Ans:
A linear equation is fitted to the observed data using the statistical technique of linear regression to represent the connection between a dependent variable and one or more independent variables. The goal is to find the line that fits the data and reduces the sum of squared discrepancies between the expected and actual values.
78. Enumerate the many categories of categorization algorithms.
Ans:
Categorization algorithms can be broadly categorized into decision trees, support vector machines, k-nearest neighbors, naive Bayes, neural networks, and ensemble methods like random forests and gradient boosting.
79. How should missing values be handled during analysis?
Ans:
Missing values can be handled in one of three ways: First, by deleting rows that include missing data, by imputing values using statistical approaches, or by estimating missing values using sophisticated methods like predictive modeling. The decision is based on the data’s characteristics and how they affect the study results.
80. What distinguishes underfitting from overfitting?
Ans:
Underfitting occurs when a model is too simple and fails to capture the underlying patterns in the data, leading to poor performance on both training and test sets. Overfitting, on the other hand, occurs when a model is too complex, capturing noise in the training data and performing poorly on new, unseen data. Balancing model complexity is crucial to achieving optimal performance.
81. What distinct selection biases do we have?
Ans:
Selection biases include sampling bias, where the sample is not representative of the population; survivorship bias, when only surviving entities are considered; and response bias, where respondents may not accurately represent the entire population due to non-response or self-selection.
82. Distinction between analyses that are univariate, bivariate, and multivariate.
Ans:
Univariate analysis involves examining a single variable, bivariate analysis explores the relationship between two variables, and multivariate analysis involves studying more than two variables simultaneously. Multivariate analysis is more complex but provides a comprehensive understanding of relationships within a dataset.
83. Describe cluster sampling.
Ans:
Cluster sampling involves dividing the population into clusters and randomly selecting entire collections for inclusion in the sample. It is often more practical and cost-effective than selecting individual elements, especially when the population is large and geographically dispersed.
84. How would you respond if eliminating missing values from a dataset led to bias?
Ans:
If eliminating missing values introduces bias, alternative methods like imputation or using advanced techniques to handle missing data, such as multiple imputation, should be considered. It’s crucial to assess and understand the potential impact of missing data on the analysis and choose an appropriate strategy.
85. In the field of data science, how helpful is R?
Ans:
R is handy for statistical analysis, data manipulation, and visualization in data science. It has a rich ecosystem of packages and libraries, making it a preferred tool for statisticians and data scientists, particularly in academia and research.
86. How can we determine the statistical power of sensitivity?
Ans:
Sensitivity is a measure of a model’s ability to correctly identify positive instances. The statistical power of sensitivity is assessed by evaluating the true positive rate, which is the number of true positives divided by the sum of true positives and false negatives.
87. What does systematic sampling entail?
Ans:
Systematic sampling involves selecting every kth item from a list after a random starting point. It provides a representative sample when there is a recurring order in the population, such as alphabetical or chronological order.
88. Describe the distinction between a test set and a validation set.
Ans:
A test set assesses the model’s performance after training and validation. A validation set is a subset of the data used during the training phase to fine-tune model parameters. The test set evaluates the model’s generalization to new, unseen data.
89. In a decision tree, what does pruning mean?
Ans:
Pruning in a decision tree involves removing branches that do not provide significant predictive power or may lead to overfitting. It helps simplify the tree, improve interpretability, and enhance its ability to generalize to new data. Regularization techniques are often applied during pruning.
90. Describe the many kinds of categorization algorithms.
Ans:
Categorization algorithms include decision trees, support vector machines, k-nearest neighbors, naive Bayes, and neural networks. Each has its strengths and weaknesses, making them suitable for different types of problems and datasets.