
Last updated on 04th Jul 2020| 4969
TheseNagios Interview Questions have been designed specially to get you acquainted with the nature of questions you may encounter during your interview for the subject ofNagios . As per my experience good interviewers hardly plan to ask any particular question during your interview, normally questions start with some basic concept of the subject and later they continue based on further discussion and what you answer.we are going to cover top 100Nagios Interview questions along with their detailed answers. We will be coveringNagios scenario based interview questions,Nagios interview questions for freshers as well asNagios interview questions and answers for experienced.
1. What is Nagios?
Ans:
Nagios is an open-source monitoring system used for tracking the health and performance of IT infrastructure. It monitors hosts, services, and network devices, sending real-time alerts when issues arise. Nagios employs plugins to perform checks and can be extended for custom monitoring. Its modular design and flexibility make it a popular choice for system administrators.
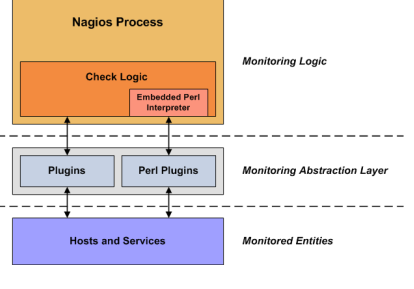
2. Explain the main components of Nagios.
Ans:
Nagios comprises Nagios Core, the central monitoring engine; Plugins, executable scripts for monitoring checks; and NRPE (Nagios Remote Plugin Executor) for monitoring resources on remote machines. Nagios Core processes configurations and executes checks, while Plugins perform monitoring tasks and report results. NRPE enables monitoring of resources on remote systems, enhancing Nagios’ flexibility and scalability.
3. Explain the main components of Nagios?
Ans:
Nagios comprises Nagios Core (central engine), Plugins (executable scripts for monitoring), and NRPE (enabling remote monitoring).
4. How does Nagios work?
Ans:
Nagios functions by regularly executing checks on hosts and services using Plugins. These Plugins collect status information, enabling Nagios to assess and report the health of monitored elements through alerts or notifications.
5. What is a Nagios configuration file and its significance?
Ans:
The Nagios configuration file, typically nagios.cfg, is crucial as it houses global settings and references other configuration files, providing the foundation for Nagios operation.
6. Explain the purpose of the commands.cfg file?
Ans:
commands.cfg defines commands for Nagios to execute checks. It specifies the actual check commands performed by Nagios plugins, allowing customization and flexibility in monitoring.
7. How do you define a host in Nagios?
Ans:
In Nagios, defining a host involves specifying its parameters like hostname, IP address, and monitoring options in a configuration file, such as hosts.cfg, to enable Nagios to monitor that host.
8. What is a service in Nagios?
Ans:
A service in Nagios is a specific aspect or functionality on a host that needs monitoring, such as HTTP, SSH, or disk usage. It is defined in the services.cfg file.
9. What is the purpose of the contacts.cfg file?
Ans:
The contacts.cfg file in Nagios is used to define contacts or individuals who will receive notifications about service or host status changes, allowing for tailored alerting.
10. How do you define time periods in Nagios?
Ans:
Time periods in Nagios are defined in the timeperiods.cfg file or similar configurations, specifying when monitoring is active or when scheduled downtime occurs. This allows for fine-tuned control over monitoring periods.
11. What are Nagios plugins?
Ans:
Nagios plugins are executable scripts or programs responsible for performing the actual monitoring checks on hosts and services. They provide data and status information to Nagios for analysis.
12. Explain the significance of exit codes in Nagios plugins?
Ans:
Exit codes in Nagios plugins are crucial indicators of the result of a monitoring check. A specific exit code represents the status of the check (e.g., OK, WARNING, CRITICAL), informing Nagios about the health or performance of the monitored element.
13. How do you create a custom plugin for Nagios?
Ans:
To create a custom plugin for Nagios, one can write a script or program that follows Nagios plugin guidelines. It should accept relevant command-line arguments, perform the check, and exit with the appropriate exit code. Once created, the plugin is integrated into Nagios configurations.
14. What is SNMP and how is it used in Nagios?
Ans:
SNMP (Simple Network Management Protocol) is a standard protocol for network management. In Nagios, SNMP is used to monitor and collect information from network devices, such as routers and switches. Nagios can query SNMP-enabled devices for data like CPU usage, memory, and network statistics, enhancing comprehensive monitoring capabilities.
15. How does Nagios handle notifications?
Ans:
Nagios handles notifications by sending alerts to specified contacts or individuals when there is a change in the state of a service or host. Notifications can include details about the issue, helping administrators take prompt action.
16. Explain the difference between a soft state and a hard state in Nagios?
Ans:
In Nagios, a hard state indicates a real and persistent problem with a service or host. A soft state is a temporary or intermittent issue. Nagios uses these states to determine when to trigger notifications. Multiple consecutive soft states can escalate the severity, eventually leading to a hard state and triggering notifications.
17. What is the purpose of the contacts.cfg file in relation to notifications?
Ans:
The contacts.cfg file in Nagios is used to define contacts, specifying who should be notified when there is a change in service or host status. It associates individuals or groups with notification commands, allowing for customized and targeted alerting based on the defined contacts and their notification preferences.
18. What is NRPE?
Ans:
NRPE is a Nagios addon enabling remote monitoring by allowing Nagios to execute plugins on remote servers and collect the results.
19. How do you install and configure NRPE on a remote machine?
Ans:
To install NRPE on a remote machine, download the daemon, configure allowed commands, and update the Nagios server config to define the remote host and services.
20. Explain the security considerations when using NRPE.
Ans:
Ensure security by restricting access through allowed hosts, using encryption (e.g., SSH tunnels), limiting commands, and configuring firewalls to permit NRPE traffic while blocking unauthorized access.
21. What is passive checking in Nagios?
Ans:
Passive checking in Nagios involves external systems or devices sending status updates to Nagios rather than Nagios actively polling them. This allows for monitoring of events that are not predictable or constant, such as log entries or external alerts.
22. How do you configure event handlers in Nagios?
Ans:
To configure event handlers in Nagios, you define commands in the Nagios configuration that are triggered based on specific state changes. Event handlers allow for automated responses to certain conditions, such as restarting a service when it goes into a critical state.
23. Explain the concept of dependencies in Nagios.
Ans:
Dependencies in Nagios represent relationships between hosts and services. They define conditions under which certain hosts or services should be checked based on the status of other hosts or services. This helps in preventing unnecessary alerts or checks when a dependent element is already in a problem state.
24. How do you troubleshoot a service that is not being monitored correctly?
Ans:
Configuration Check : Examine services.cfg for correct service parameters.
Plugin Test : Execute the plugin manually on Nagios to verify results.
Permissions : Confirm Nagios process has adequate permissions for plugin execution.
25. What are some common issues with Nagios and how do you resolve them?
Ans:
Plugin Configuration : Validate plugin paths and parameters.
Definition Accuracy : Ensure accurate host and service definitions in configuration files.
Log File Inspection : Check Nagios log files (e.g., /var/log/nagios/nagios.log) for error messages.
26. How do you check the Nagios log files for errors?
Ans:
Location : Nagios log files are commonly found at /var/log/nagios/nagios.log.
Access : Use text editors or commands like tail to view and analyze the logs.
Error Identification : Look for error messages and relevant information in the log files.
Timestamps : Pay attention to timestamps to correlate events with specific times.
Debug Mode : Consider enabling debug mode (-d option) for more detailed information.
27. How do you optimize the performance of Nagios?
Ans:
Parallel Processing : Configure Nagios to run checks in parallel to distribute the load efficiently.
Check Intervals : Adjust check intervals based on the criticality of services and available resources.
Event Handlers : Use event handlers to automate responses, reducing manual intervention.
28. What are the factors to consider when determining check intervals?
Ans:
Parallel Processing : Configure Nagios for parallel checks to distribute the load efficiently.
Check Intervals : Adjust intervals based on service criticality and available resources for optimal monitoring.
Event Handlers : Utilize event handlers to automate responses, reducing manual intervention.
Performance Data : Limit collection of performance data to essential metrics for efficiency.
29. How can Nagios be integrated with other tools or systems?
Ans:
NRPE : Enable remote monitoring with NRPE, executing plugins on target machines from the Nagios server.
SNMP : Integrate Nagios with SNMP-enabled devices for in-depth network monitoring.
API Integration : Leverage Nagios APIs to connect with other tools and systems for data exchange and automation.
30. Explain the role of NSCA (Nagios Service Check Acceptor) in integration.
Ans:
Passive Checks : NSCA allows external systems to send passive check results to Nagios.
Asynchronous Reporting : It facilitates asynchronous reporting, enhancing monitoring capabilities.
Distributed Monitoring : NSCA is crucial for distributed monitoring setups, allowing seamless data exchange between Nagios instances.
31. How do you secure the Nagios web interface?
Ans:
Authentication : Strengthen access control with robust authentication mechanisms.
SSL/TLS : Enhance security by enabling HTTPS through SSL/TLS encryption.
Access Restrictions : Control access to the Nagios web interface based on trusted IP addresses.
Regular Updates : Maintain security by regularly updating Nagios and its components.
32. What are some best practices for securing the Nagios server?
Ans:
Firewall Rules : Safeguard the Nagios server by configuring strict firewall rules.
User Privileges : Mitigate risks by assigning minimal user privileges and avoiding unnecessary superuser access.
Monitoring of Logs : Regularly monitor Nagios logs for suspicious activities and potential security incidents.
Software Patching : Keep the server secure by promptly applying software patches and updates.
33. Explain the importance of regular backups in Nagio?
Ans:
Configuration Safeguard : Backups ensure Nagios configurations are preserved for swift recovery.
Historical Data : Retained for analysis and issue resolution, aiding in performance evaluation.
Disaster Recovery : Essential for promptly restoring the system after crashes or data loss.
Efficient Restoration : Facilitates quick recovery, minimizing downtime impact on monitoring operations.

Enhance Your Career with Nagios Training from Real Time Experts
- Instructor-led Sessions
- Real-life Case Studies
- Assignments
34. How do you handle downtime in Nagios?
Ans:
Scheduled Downtime : Plan during non-critical periods to avoid unnecessary alerts.
Downtime Commands : Temporarily disable notifications using Nagios downtime commands.
Monitoring Suspension : Suspend active monitoring for planned maintenance, preventing false alarms.
Communication : Communicate planned downtime schedules for stakeholder awareness and coordination.
35.How can Nagios be scaled for large environments?
Ans:
Distributed Monitoring : Deploy multiple Nagios instances for efficient load distribution.Load Balancing : Utilize load balancers to evenly distribute monitoring tasks.High Availability : Implement redundancy and failover mechanisms for critical environments.Resource Scaling : Scale server resources to handle increased monitoring load effectively.
36. What considerations should be taken into account when monitoring a distributed environment?
Ans:
Network Latency : Factor in potential latency between Nagios servers and monitored entities.Data Consistency : Ensure consistent data across distributed instances for accurate monitoring.Security : Establish secure communication channels to protect sensitive data.Configuration Management : Use centralized tools for consistent configuration in distributed setups.
37. What are some commonly used plugins in Nagios?
Ans:
check_ping : Monitors network latency and packet loss.
check_http : Verifies the status of web servers and applications.
check_disk : Checks disk space usage on servers.
38. How do you write a simple bash script as a Nagios plugin?
Ans:
Shebang Line : Start with #!/bin/bash for the shell.
Command Arguments : Accept arguments using $1, $2, etc.
Exit Codes : Use exit for OK (0), WARNING (1), or CRITICAL (2).
Output Format : Print in a standard format, e.g., “OK: Message.”
Example Script :
- #!/bin/bash
- threshold=90
- disk_usage=$(df -h | awk ‘/\/$/ {print $(NF-1)}’ | sed ‘s/%//’)
- if [ “$disk_usage” -ge “$threshold” ]; then
- echo “CRITICAL: Disk usage is $disk_usage%.”
- exit 2
- else
- echo “OK: Disk usage is $disk_usage%.”
- exit 0
- fi
39. How does NRPE ensure secure communication between the Nagios server and remote hosts?
Ans:
Encryption : NRPE ensures security with SSL/TLS encryption for communication.
SSL Certificates : Both Nagios server and NRPE daemon use SSL certificates for identity validation.
Access Control : NRPE configurations restrict access to trusted Nagios servers via defined allowed hosts.
Port Configuration : Typically, NRPE uses port 5666 for secure communication.
40. Explain the steps to troubleshoot NRPE-related issues.
Ans:
Check NRPE Logs : Examine remote host logs for error messages or connection issues.
Firewall Settings : Ensure firewalls permit NRPE traffic on the configured port.
SSL/TLS Configuration : Confirm matching SSL/TLS configurations for proper encryption.
Plugin Execution : Manually test NRPE plugins to ensure correct execution on the remote host.
41. What are the key metrics you would monitor on a web server?
Ans:
Response Time : Measure response time for requests.
Request Rate : Monitor the incoming HTTP request rate.
Error Rates : Track server and client error frequencies.
Resource Utilization : Monitor CPU, memory, and disk usage.
Network Throughput : Measure incoming and outgoing data rates.
42. How do you monitor a database server using Nagios?
Ans:
Check Database Connectivity : Ensure Nagios can connect to the database server.
Query Execution Time : Monitor the time taken for critical database queries.
Database Space Usage : Track database storage usage and set thresholds for alerts.
Replication Status : For replicated databases, monitor replication status.
Connection Pooling : Monitor the availability and health of database connection pools.
43. How can automation tools like Ansible be used to deploy and configure Nagios?
Ans:
Inventory Setup : Define Nagios server and monitored hosts in Ansible inventory.
Role-based Configuration : Develop Ansible roles for Nagios server and clients, specifying configurations.
Playbook Execution : Automate Nagios installation and configuration using Ansible playbooks.
Dynamic Templates : Utilize Ansible templates for dynamic configuration file generation based on defined variables.
44. What reporting options are available in Nagios?
Ans:
Nagios provides various reporting options to monitor and analyze system performance. It offers built-in graphical reports that depict status trends and performance metrics. Additionally, users can leverage the Nagios Graph Explorer (Nagiosgraph) as an extension for creating custom graphs and reports tailored to specific needs. Integration with external reporting tools further enhances the reporting capabilities, allowing for a comprehensive understanding of the monitored environment.
45. How do you generate and interpret performance graphs in Nagios?
Ans:
To generate performance graphs in Nagios, configure the system for data collection by enabling performance data for the desired services. Utilize built-in features or external tools like Nagiosgraph to create insightful graphs. These graphs enable users to interpret performance metrics effectively, identifying trends, spikes, or anomalies. It is crucial to set appropriate thresholds based on the graphed data to facilitate proactive monitoring and timely responses to critical or warning-level situations.
46. What is the process for upgrading Nagios to a new version?
Ans:
Backup Configuration : Back up Nagios configuration files and relevant data.
Review Release Notes : Examine release notes for changes and potential impact.
Download New Version : Obtain the latest Nagios release from the official source.
Stop Nagios Service : Temporarily halt the Nagios service to prevent conflicts.
Install New Version : Install the new version, following provided instructions.
47. How do you handle maintenance windows in Nagios?
Ans:
Define Windows : Set specific timeframes as maintenance windows using Nagios configurations.
Suspend Monitoring : During maintenance windows, suspend monitoring for the specified hosts or services.
Avoid Alerts : Prevent unnecessary alerts by configuring Nagios not to trigger notifications during maintenance.
Schedule Tasks : Schedule maintenance tasks such as updates or server maintenance within defined windows.
48. Where can I locate Nagios resources and community support?
Ans:
- The official website of Nagios On its official website, Nagios offers downloads, forums, and documentation.
- Participate in the Nagios community forums to have discussions and work through issues.
- GitHub Repository: You can work together and contribute to the Nagios plugin and component library on GitHub.
49. In what ways do you support the Nagios community?
Ans:
- GitHub Contributions: Send in bug reports, feature requests, or code contributions to support Nagios projects on GitHub.
- Participate in the Nagios forums by contributing to the community, exchanging ideas, and responding to queries.
- Enhance the clarity and comprehensiveness of the Nagios documentation by making a contribution.
50. What are some alternative monitoring tools to Nagios, and how do they compare?
Ans:
Zabbix : User-friendly interface, real-time monitoring, and robust alerting.
Prometheus : Cloud-native, scalable, and flexible data querying.
Icinga : Modernized features and interface, derived from Nagios.
SolarWinds Orion : Commercial solution with an intuitive interface and extensive features.
51. How do you stay updated with Nagios developments and best practices?
Ans:
Official Channels : Regularly check Nagios’ official website, mailing lists, and social media channels.
Community Discussions : Actively participate in Nagios forums to engage with the community and gain insights.
Conferences and Webinars : Attend Nagios conferences and webinars for the latest developments and best practices.
52. Explain the concept of passive checks in Nagios?
Ans:
External entities submit check results to Nagios, allowing monitoring of events that Nagios cannot actively check.
53. What is the purpose of the retention.dat file in Nagios, and how does it impact the system?
Ans:
Purpose : The retention.dat file stores historical state information, aiding in system recovery after restarts.
Impact : It prevents services from being rechecked unnecessarily and ensures Nagios resumes monitoring from the last known state.
54. How do you configure notifications for specific events in Nagios?
Ans:
Process : Define contact groups, contacts, and notification commands in Nagios configurations.
Events : Associate specific events with notification settings, specifying when and how alerts should be sent.
Parameters : Set notification intervals, escalation policies, and other parameters to tailor notifications based on the severity of events.
55. What is the significance of event handlers in Nagios, and how do you configure them?
Ans:
Significance : Automated scripts triggered by state changes for proactive issue resolution.Configuration : Define handlers in Nagios configs, associating them with services or hosts to execute on state changes.
56. Explain the role of macros in Nagios configurations?
Ans:
Role : Macros act as placeholders for dynamic values in Nagios configurations.
Usage : Configure macros to represent variables like host names or thresholds, promoting flexibility in configuration.
57. What is the Nagios Core Worker System, and how does it enhance performance?
Ans:
Significance : Worker system enhances Nagios performance by parallelizing checks and processing.
Operation : It divides monitoring tasks into worker threads, allowing simultaneous execution and efficient resource utilization.
58. How can you implement distributed monitoring in Nagios, and what are the benefits?
Ans:
Implementation : Set up multiple Nagios servers for segment-specific monitoring.
Benefits : Scalability, load distribution, and fault tolerance for efficient large-scale monitoring.
59. Explain the difference between active and passive checks in Nagios?
Ans:
| Active Checks | Passive Checks | |
| Nagios actively queries hosts/services at regular intervals. |
External entities or monitored systems send status updates. |
|
| Nagios initiates the check based on a predefined schedule. | Checks are initiated by external systems or applications | |
| Consumes resources on the Nagios server as it actively. | Typically consumes fewer resources on the Nagios server. |
60. What are the considerations for monitoring cloud-based infrastructure using Nagios?
Ans:
Dynamic Nature : Cloud environments are dynamic, requiring flexible configurations.
Auto-scaling : Adapt monitoring to auto-scaling instances to ensure accurate representation.
Security : Secure communication and access to cloud resources are critical considerations.
API Integration : Leverage cloud provider APIs for real-time information and resource management.
61. How do you troubleshoot connectivity issues between the Nagios server and monitored hosts?
Ans:
Ping Test : Use ping for basic connectivity.
Firewall Inspection : Verify firewall settings.
Log Analysis : Check Nagios logs for errors.
Traceroute : Identify network hops with traceroute.
62. Describe the benefits and challenges of using SNMP for monitoring in Nagios?
Ans:
Benefits : Standardized data gathering enhances monitoring.
Challenges : SNMP complexity, security risks, and limited non-network device support.

Enroll in Nagios Course & Get Noticed By Top Hiring Companies
Weekday / Weekend BatchesSee Batch Details63. How can you integrate Nagios with other IT management tools for a more comprehensive solution?
Ans:
Benefits : Achieve a comprehensive solution by integrating Nagios with IT management tools.
Methods : Utilize APIs, webhooks, or middleware for seamless communication.
Enhancements : Leverage integrations for enhanced reporting, collaboration, and incident response.
64. What is the purpose of NRPE, and how can its communication be secured in Nagios?
Ans:
Purpose : NRPE enables remote execution of plugins for monitoring local resources.
Secure Communication : Ensure secure communication with SSL/TLS and host-based access controls.
65. Explain the role of escalations in Nagios notifications?
Ans:
Role : Escalations define additional notification steps for unresolved alerts to higher-level contacts or teams.
Configuration : Set escalation rules in Nagios configurations, specifying conditions and contacts for escalated notifications.
66. How can you implement custom checks and plugins in Nagios?
Ans:
Procedure : Develop custom scripts or plugins for specific checks.Integration : Place scripts in the appropriate directory, define commands in Nagios configurations, and schedule checks as needed.
67. What is the significance of the nagios.cmd file, and how is it used in Nagios?
Ans:
Significance : nagios.cmd is the command file for submitting external commands.
Usage : Used to control Nagios operations via commands like acknowledging problems or scheduling downtime.
68. Describe the process of setting up and configuring host dependencies in Nagios?
Ans:
Process : Define host dependencies in Nagios configurations.
Configuration : Specify conditions where one host’s status depends on another.
Benefits : Ensures accurate alerts and reduces noise by preventing unnecessary notifications.
69. How do you handle false-positive alerts in Nagios, and what strategies can be employed to minimize them?
Ans:
Identification : Investigate and analyze the root cause of false alerts.
Adjust Thresholds : Modify alert thresholds or parameters to align with actual performance.
Tuning Checks : Fine-tune check parameters and intervals for better sensitivity.
Documentation : Maintain thorough documentation to aid in understanding and resolving false alerts.
70. Explain the role of freshness checks in Nagios and how they contribute to more accurate monitoring?
Ans:
Purpose : Ensure timeliness of monitored data through periodic updates.
Contribution : Enhances accuracy by marking data as stale if not updated within a defined timeframe.
71. What steps do you take to optimize the performance of Nagios in a large-scale environment?
Ans:
Distributed Monitoring : Implement distributed setups for load distribution.
Worker System : Utilize Nagios Core Worker System to parallelize checks.
Resource Allocation : Optimize hardware resources based on monitoring needs.
Tuning Configuration : Fine-tune Nagios configurations for efficient monitoring in large-scale environments.
72. What is the purpose of event handlers in Nagios notifications, and how do you set them up?
Ans:
Event handlers in Nagios notifications are automation scripts designed to respond to state changes. These scripts are triggered by specific events, allowing for automated actions when services or hosts transition between different states. The setup involves defining event handler commands in Nagios configurations and associating them with particular services or hosts. Configuration options include specifying conditions for event handler execution based on state changes, offering a powerful
73. Explain the role of the Nagios Object Configuration Files and their significance?
Ans:
The Nagios Object Configuration Files play a pivotal role in defining and organizing essential elements such as hosts, services, and commands in Nagios. Serving as the backbone of Nagios configurations, these files, typically found in the “objects” directory, provide a structured way to articulate the entire monitoring environment. Each file corresponds to a specific type of object, contributing to the clarity and maintainability of Nagios setups. By encapsulating critical details within these files, administrators can efficiently manage and customize monitoring configurations, ensuring a streamlined and effective monitoring system.
74. How do you configure passive checks using the NSCA (Nagios Service Check Acceptor) in Nagios?
Ans:
To enable passive checks in Nagios, the Nagios Service Check Acceptor (NSCA) comes into play. NSCA is installed and configured on the hosts to be monitored, and corresponding settings are defined in Nagios configurations. Passive checks allow these monitored hosts to transmit service check results securely to the Nagios server through NSCA. The configuration involves specifying passive service checks, associated commands, and encryption settings, facilitating a reliable and secure flow of information from the monitored hosts to the Nagios server.
75. Explain the concept of host and service dependencies and their impact on alerting in Nagios?
Ans:
In Nagios, host and service dependencies help streamline alerting by establishing relationships between different entities. Host dependencies allow administrators to define scenarios where alerts for dependent hosts are suppressed if the master host is in a problem state. Similarly, service dependencies enable the suppression of alerts for specific services when dependent services are in a problematic state. By carefully configuring dependencies, Nagios ensures that alerts are more meaningful, reducing noise and preventing cascading alerts for interconnected elements, resulting in a more accurate and actionable alerting system.
76. Describe the process of setting up and using performance data in Nagios for trend analysis?
Ans:
In Nagios, setting up and utilizing performance data for trend analysis involves configuring checks to collect performance metrics. This is achieved by adding performance data directives in service definitions. Nagios then records and stores this data, which can be graphed and analyzed over time using tools like Nagiosgraph or external solutions. By extracting insights from historical performance trends, administrators can proactively identify potential issues and optimize system resources.
77. How do you implement custom dashboards or visualization tools to complement Nagios monitoring?
Ans:
To complement Nagios monitoring, custom dashboards and visualization tools can be implemented to enhance the user experience. Integration with tools like Grafana or custom-built dashboards allows for more intuitive and comprehensive visualization of Nagios data. This process often involves leveraging Nagios APIs or exporting data to external databases, enabling the creation of tailored dashboards that provide a consolidated view of key metrics and alerts.
78. What considerations should be taken into account when designing notification strategies in Nagios?
Ans:
Relevance : Tailor alerts to critical events to prevent alert fatigue.
Escalation : Implement escalation policies for timely alerts.
Time Periods : Define notification periods to avoid off-hours alerts.
Contact Groups : Efficiently distribute alerts by grouping contacts based on responsibilities.
79. How can you monitor log files using Nagios, and what plugins or methods would you employ?
Ans:
Plugins : Utilize plugins like check_logfiles for log monitoring.Configuration : Define log paths and patterns in Nagios service definitions.Alerting : Configure Nagios to alert on specific log conditions for proactive issue identification.
80. Explain the importance and steps of regularly backing up Nagios configurations and data.
Ans:
Configuration Integrity : Ensure Nagios configurations’ integrity through regular backups.
Disaster Recovery : Facilitate quick recovery in case of system failures or disasters.
Historical Data : Include historical monitoring data in backups for comprehensive recovery.
Steps : Regularly copy configuration files and relevant directories, validating backup restoration processes.
81. How does Nagios manage flapping hosts/services, and what strategies can address this issue?
Ans:
Nagios manages flapping (unstable) hosts or services by automatically detecting fluctuations in their states over time. The system sets thresholds for identifying frequent state changes and provides configurable options to fine-tune flap detection. Damping parameters are employed to control sensitivity, reducing false positives and ensuring accurate identification of genuinely unstable hosts or services. These strategies collectively contribute to a more reliable and robust monitoring system in Nagios.
82. How can you monitor the availability and performance of network devices using Nagios?
Ans:
SNMP Monitoring : Configure SNMP for device status and performance.
Use Nagios SNMP plugins for data collection.
Employ SNMP traps for real-time event notification.
Ping and ICMP Checks : Utilize ICMP checks for device availability.
Set up Nagios to alert on ping test failures.
83. Describe the purpose of the Nagios Event Broker (NEB) and its potential applications?
Ans:
- NEB extends Nagios functionality through event processing.
- Acts as an interface for external applications to react to Nagios events.
- Enables custom event handling and integration with external tools.
84. What are the considerations for implementing high availability in a Nagios environment?
Ans:
Redundancy : Implement redundant Nagios servers for failover.
Ensure multiple instances share the monitoring load.
Database Considerations : Use a high-availability database setup for Nagios data.
Employ clustering or replication for database reliability.
Distributed Monitoring : Distribute monitoring across multiple servers.
Use load balancing to optimize resource utilization.
85. Explain the significance of performance tuning in Nagios and common optimization techniques?
Ans:
Performance tuning is paramount in Nagios to ensure optimal monitoring efficiency. By adjusting check intervals, leveraging the Nagios Core Worker System for parallelized checks, optimizing database queries, and allocating suitable hardware resources, administrators can enhance system responsiveness and resource utilization.
86. How does Nagios enhance notifications using event handlers and custom scripts?
Ans:
Nagios provides flexibility in custom notifications through event handlers and plugins. Administrators can extend notification capabilities by creating tailored scripts, integrating external notification systems, and leveraging Nagios event brokers. This customization empowers users to implement notifications aligned with specific organizational needs.
87. Describe the concept of service groups in Nagios and their role in configuration management?
Ans:
Service groups play a vital role in Nagios configuration management by allowing the grouping of related services. This organizational structure simplifies the application of settings to multiple services simultaneously, facilitating efficient configuration management, maintenance, and updates across the monitoring infrastructure.
88. How does Nagios monitoring work?
Ans:
Nagios monitoring works by periodically executing checks on hosts and services using plugins. These checks can be active or passive. Active checks involve Nagios actively querying hosts and services, while passive checks involve external entities submitting results to Nagios. Nagios evaluates these check results against predefined thresholds and triggers notifications or escalations based on the configured criteria.
89. What is the purpose of the NRPE (Nagios Remote Plugin Executor) plugin?
Ans:
The NRPE plugin allows Nagios to execute plugins on remote Linux/Unix machines. It enables the monitoring of local resources and services on remote hosts. NRPE acts as a communication agent, executing checks requested by the Nagios server on the remote machine and returning the results for evaluation.
90.Explain the role of the Nagios Plugin in the monitoring process.
Ans:
Nagios Plugins are executables or scripts responsible for performing checks on hosts and services. These checks can include monitoring system metrics, verifying service statuses, or evaluating custom conditions. The plugin returns results to Nagios, which then interprets the output to determine the status of the monitored item and triggers alerts or notifications accordingly.