
STATA Interview Questions And Answers [ FRESHERS ]
Last updated on 14th Nov 2021, Blog, Interview Questions
Stata is a powerful statistical software that enables users to analyze, manage, and produce graphical visualizations of data. If you’re attending for STATA Interview Questions for Expert or Novices, you are in right place. There are a lot of opportunities from many reputed companies in the world. According to analysis, the average salary for STATA is approximately $69,870 pa. So, You still can move ahead in your job in STATA. ACTE offers Advanced STATA Interview Questions that supports you in cracking your interview & getting the desired occupation as STATA Analyst.
1. What is the Central Limit Theorem?
Ans:
The central theorem says that a sample drawn from a population with a high sample size will have a regularly distributed mean. Put otherwise, it won’t change anything about the initial distribution of the population. The Central Limit Theorem is frequently used in hypothesis testing and confidence interval computation.
2. What is the assumption of normality?
Ans:
The assumption of normality is a key assumption in many statistical methods and tests. It is based on the idea that the data under consideration follows a normal distribution, also known as a Gaussian distribution. This distribution is characterised by a bell-shaped curve, where the majority of the data points cluster around the mean, with symmetric tails on either side.
3. Explanation of Hypothesis Testing?
Ans:
In statistics, hypothesis testing is performed to find whether an experiment produces significant results. In essence, they are calculating the likelihood that the results could have happened by random aids in evaluating the statistical significance of insight. Knowing the null hypothesis and stating it comes first. Next, if the null hypothesis is correct, further values are ascertained after the p-value has been computed. The relevance is shown by the alpha value, which is changed appropriately.
4. In statistics, what are experimental and observational data?
Ans:
Certain factors observed in observational research are the source of observational data.To find out if there is any link between the variables, observations are made.In order to identify any disparity or causal relationship, experimental data is predicted from experiments in which particular variables are held constant.
5. Explain the Difference between Stata’s “do” and “ado” files.?
Ans:
| Feature | Stata “do” Files | Stata “ado” Files | |
| Purpose |
Execute a sequence of Stata commands in batch.. |
Define custom Stata commands or programs. | |
| Content | Contains a list of Stata commands. | Includes Stata programming code defining new commands, functions, or procedures. | |
| Execution |
Commands are executed sequentially. |
Not directly executed; defines new functionality for use within Stata. | |
| File Extension | “.do” (e.g., “myscript.do”). | “.ado” (e.g., “myprogram.ado”). | |
| Primary Use Case |
Automation of repetitive tasks, data manipulation, analysis scripts. |
Extending Stata’s functionality, creating custom commands and programs. |
6. How should a data set be screened for outliers?
Ans:
- A data set can be screened in a variety of methods to find possible outliers. The two main techniques are explained below:
- Standard deviation/z-score: In a normal distribution, the Z-score or standard score is generated by multiplying the size of one standard deviation by three. Next, the data points that fall outside of the range are found. The mean is used to calculate the Z-score. The data point is above average if the z-score is positive.
- The data point is below average if the z-score is negative.
- The data point is close to average if the z-score is near zero.
- An outlier is present in the data if the z-score is more than or less than 3; it is an outlier, and the data point is considered unusual.
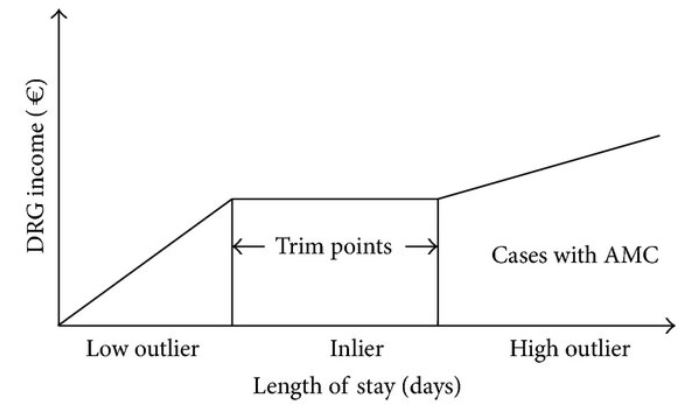
7. What is the meaning of an inlier?
Ans:
An inlier refers to an observation or data point that is consistent with the overall pattern or trend in a dataset. Unlike outliers, which are extreme values that deviate significantly from the general pattern, inliers are data points that conform well to the expected behaviour of the data. Inliers are typically located near the centre of distribution and contribute to the overall coherence of the dataset.
8. In statistics, what does Six Sigma mean?
Ans:
- In statistics, Six Sigma is a quality control technique used to generate a data set free of errors or defects.
- The symbol for standard deviation is σ, or Sigma. The likelihood that a process will operate accurately and result in a defect decreases with increasing standard deviation. A process is deemed Six Sigma if its conclusion is 99.99966% error-free.
- A Six Sigma model is dependable enough to deliver work free of errors and performs better than 1σ, 2σ, 3σ, 4σ, and 5σ processes.
9. What does a KPI in statistics mean?
Ans:
The term “key performance indicator” (KPI) is an acronym. It can be characterised as a measurable indicator to determine whether or not the objective is being met. KPI is a trustworthy indicator of an organisation’s or person’s performance in relation to the goals. The spending ratio is an illustration of a KPI in a business.
10. What is the Pareto principle?
Ans:
The Pareto Principle, also known as the 80/20 Rule, is a statistical concept that suggests that roughly 80% of effects come from 20% of causes. In various contexts, this principle implies that a significant majority of outcomes or outputs result from a small portion of inputs or factors. Originally observed by economist Vilfredo Pareto, the principle has been applied across diverse fields such as business, economics, and quality management.
11. In statistics, what is the Law of Large Numbers?
Ans:
The law of big numbers states that as an experiment’s number of trials increases, the findings will rise positively and proportionately, approaching the predicted value. Let’s check the likelihood of rolling a six-sided die three times, for instance. The actual value is very different from the projected value. Additionally, if we roll the dice a lot, the average outcome will be closer to the predicted value, which in this case is 3.5.
12. What characteristics do normal distributions have?
Ans:
The normal distribution, also referred to as the Gaussian distribution, describes data that is symmetric about the mean, and that is less common than data that is far from the mean. In graphical form, it has the form of a symmetrical bell-shaped curve along the axes.
Among a normal distribution’s characteristics are
- Symmetrical: The form adapts to the values of the parameters.
- Unimodal: consists of just one modality.
- Mean: the central tendency measure
- Central tendency: the curve is absolutely symmetrical at the midway, and the mean, median, and mode all lie at the centre, indicating that they are equal.
13. In what way would you define a “p-value”?
Ans:
In statistics, a P-value is a figure that represents the probability that data occurred by chance and is computed during hypothesis testing. We may determine that there is a 5% possibility that the experiment results happened by chance if the p-value is 0.5 and smaller than alpha. Put another way, this means that 5% of the time, we can witness these outcomes by chance.
14. How can MS Excel be used to calculate the p-value?
Ans:
- In Microsoft Excel, the p-value is calculated using the formula =tdist(x,deg_freedom, tails).
- In Excel, the p-value is expressed as a decimal.
- Locate the Data tab. Click the data analysis icon on the Analysis tab. Select Descriptive Statistics. Click OK. Choose the appropriate column. Enter the confidence level and other variables.
15. What kinds of biases might you run into when sampling versus coverage bias?
Ans:
- Observer Bias
- Survivorship bias
- Self-Selection/Voluntary Response Bias
- Recall Bias
- Exclusion Bias
16. What are significance chasing, P-hacking, and cherry-picking?
Ans:
- Cherry-picking is the technique of selecting just data in statistics that bolsters a particular assertion and ignoring any other data that contradicts the desired conclusion.
- P-hacking is a term for a method where data collection or analysis is altered until meaningful patterns that have no underlying significance are identified.
- Other terms for significance chasing include data snooping, data fishing, and data dredging. When inconsequential data are reported as nearly significant, it is referred to as this.
17. What is the Difference between type I vs. type II errors?
Ans:
Type I Error (False Positive): This occurs when a null hypothesis is incorrectly rejected, indicating a significant effect or relationship when there is none in reality. The probability of committing a Type I error is denoted by the significance level, often denoted as alpha (α), and is set by the researcher.
Type II Error (False Negative): This happens when a null hypothesis is not rejected when it should be. In other words, the test fails to detect a real effect or relationship that exists. The probability of committing Type II errors is mentioned by beta (β). The power of a statistical test is equal to 1 – β and represents the ability to detect a true effect.
18. Explain statistical interactions.
Ans:
A statistical interaction is a phenomenon that arises when an input variable influences an output variable. The interaction of stirring tea while adding sugar is a real-world example. The combination of these two variables affects sweetness; neither of the two variables alone has any effect.
19. Is there a data collection that has a non-Gaussian distribution?
Ans:
Numerous statistical processes frequently result in a non-Gaussian distribution. This occurs when data on a graph is naturally distributed non-normally, with data clumped on one side. Bacteria, for instance, grow according to a Weibull distribution that is naturally non-Gaussian or exponential.
20. What is the formula for the binomial distribution?
Ans:
- This is the formula for the binomial distribution: b(x; n, P) = nCx * Px * (1 – P)n – x. Where:
- Binomial probability, b =
- x is the total “successes” (heads or tails, pass or fail, etc.).
- P is the likelihood of success on a single trial.
- n is the number of attempts.
21. What requirements must binomial distributions satisfy?
Ans:
The following three requirements must be satisfied by binomial distributions:
- There needs to be a set amount of observation trials. It indicates that only a limited number of trials are needed to determine the likelihood of anything.
- Every trial must be autonomous. It implies that the likelihood of any trial should not affect the probability of any other trial; that is, the probability of success is constant for every trial.
22. Linear regression: what is it?
Ans:
A method used in statistics to model the relationship between one or more explanatory factors and one outcome variable is called linear regression. For instance, the link between several predictor variables, such as age, gender, genetics, and food, and outcome variables, like height, can be quantified or modelled using linear regression.
23. Which presumptions are necessary for linear regression?
Ans:
The following are the four main presumptions of linear regression:
- The predictor (independent) variables and the outcome (dependent) variable have a linear relationship. It indicates a linear relationship between X and Y’s mean.
- There is no association between the mistakes, which have a normal distribution. We call this process autocorrelation.
- The predictor variables do not correlate with one another. We refer to this phenomenon as multicollinearity.
- For every value of the independent or predictor variables, the variation in the response variable or result is the same. Homoscedasticity is the term used to describe this assumption of equal variance phenomena.
24. Which machine learning algorithms have a high and low bias?
Ans:
The following are a few popular low- and high-bias machine learning algorithms:
- Low bias: k-Nearest Neighbours, decision trees, support vector machines, etc.
- High bias includes linear discriminant analysis, logistic regression, and linear regression, among others.
25. When is a t-test preferable to a z-test?
Ans:
In statistics with a normal distribution, the z-test is employed for hypothesis testing. In situations where a sample is big, it is used to calculate population variance.
When working with a small sample size, the t-test is employed in conjunction with a t-distribution to ascertain population variance.
A z-test is employed if the sample size is large or n>30. When the sample size is small or n<30, t-tests are useful.
26. What is the confidence interval equation for means vs proportions?
Ans:
The following formula is used to get the confidence intervals for the mean:
- When n exceeds thirty
- For the typical normal distribution, utilise the Z table.
- For n<30
- Utilise the t table with the population proportion’s df=n-1 confidence interval.
27. Which empirical rule applies?
Ans:
According to the empirical rule in statistics, all data points in a normal distribution fall between three standard deviations from the mean. Another name for it is the 68–95–99.7 rule. The empirical rule states that the 68%, 95%, and 99.7% rules apply to the percentage of values that fall into a normal distribution. Put differently, 68% of values will be within one standard deviation of the mean, 95% within two, and 99.75 within three standard deviations of the mean.
28. How do tests of hypothesis and confidence compare?
Ans:
- The cornerstones of statistics are both hypothesis testing and confidence testing.
- In order to provide a solid foundation for research estimations, particularly in medical research, the confidence interval is important.
- A range of values provided by the confidence interval aids in capturing the unknown parameter.
- Using the method below, where “p” represents a parameter, hypothesis testing is used to evaluate an experiment or observation and ascertain whether the results were not the product of sheer chance or luck.
29. Which broad requirements need to be met in order for the central limit theorem to be true?
Ans:
The following prerequisites must be met in order for the central limit theorem to be true:
- The data needs to be randomly sampled in order to comply with the randomization criteria.
- The sample values must be independent of one another according to the Independence Assumptions.
- Large sample sizes are required. To be able to hold CLT, they had to be at least thirty. To maintain the validity of the CLT accuracy, a large sample size is necessary.
30. What is Sampling at Random? Provide a few instances of approaches for random sampling.
Ans:
With random sampling, every sample has an equal chance of being selected for further analysis. Another name for it is probability sampling.
Let’s examine the four primary categories of random sampling methods:
- Simple Random Sampling technique: This method uses numerical values that are created at random to select a sample at random. It is necessary to have a sampling frame containing the list of population members, indicated by the letter “n.” One can use Excel to create a random number for each required element.
- Systematic Random Sampling approach: This is a widely used and user-friendly statistical technique. This method samples each element every k.

Learn Stata Certification Training Course to Build Your Skills
Weekday / Weekend BatchesSee Batch Details31. What is the Difference between population and sample in inferential statistics?
Ans:
Population:The population refers to the entire group that is the subject of the statistical study.
It includes an individual or element that possesses the characteristics being investigated.
For example, if studying the average height of all adults in a country, the population would comprise every adult in that country.
Sample:A sample is a subset of the population selected for the actual analysis.
It is chosen to represent the larger population, allowing researchers to make inferences about the entire group based on the observed characteristics of the sample.
Continuing with the height example, researchers might select a few hundred adults to measure and draw conclusions about the average height of the entire adult population.
32. Descriptive statistics: what are they?
Ans:
In a study or experiment, descriptive statistics are used to provide an overview of a data set’s fundamental properties. There are three primary kinds:
- Distribution: This describes the range of response frequencies.
- Central Tendency: provides an average or measure for every response.
- Variability: displays a data set’s dispersion.
33. What are quantitative data and qualitative data?
Ans:
- Quantitative data in statistics are numerical and measurable, representing quantities and amounts. This type of data is typically expressed through numerical values and lends itself to mathematical analysis and statistical computations. Examples include height, weight, income, and temperature. Quantitative data can be further categorised into discrete (countable) and continuous (measurable) variables.
- Qualitative data, on the other hand, are non-numerical and categorical, capturing qualities, characteristics, or attributes. This type of data is often descriptive and subjective, providing insights into the nature of the information rather than numerical values. Examples include colour, gender, and marital status. Qualitative data are commonly analysed through methods like content analysis or thematic coding, allowing researchers to identify patterns and themes.
34. How are the interquartile range and range calculated?
Ans:
While the interquartile range is the Difference between the upper and lower medians, the range is the Difference between the highest and lowest values.
- IQR is equal to Q3 – Q1.
- The third quartile (75 percentile) is denoted by Q3 here.
- The first quartile (Q1; 25 percentile) in this case.
35. What is the meaning of standard deviation?
Ans:
Standard deviation is the statistical measure that quantifies the amount of variation or dispersion in a set of data. It provides insight into the degree of spread of values around the mean (average) of a distribution. A higher standard deviation indicates more variability, while a lower standard deviation suggests that data points are closer to the mean. Mathematically, it is calculated as the square root of the variance, which is the average of the squared differences between each data point and the mean.
36. In a normal distribution, what is the relationship between the mean and the median?
Ans:
- In a normal distribution, the mean and median are equal, and both are located at the centre of the distribution. This characteristic is a key property of symmetric distributions, like the normal distribution. The symmetry of the normal distribution ensures that half of the data lies on each side of the mean, making the mean and median coincide.
- Additionally, normal distributions are bell-shaped, and the mean represents the balancing point where the distribution is perfectly symmetrical.
- While the mean and median are the same in a truly normal distribution, they may differ in skewed distributions where one tail is longer than the other.
37. What are the distributions that are tilted left and right?
Ans:
- The left tail of the left-skewed distribution is longer than the right.
- Mode < Mean < Median <
- The right tail is longer in the right-skewed distribution. Another name for it is the positive-skew distribution.
- Median < mean < mode
38. In what way may one transform a normal distribution into a standard distribution?
Ans:
- This formula can be used to convert any point (x) from the normal distribution into a conventional normal distribution (Z):
- Z(standardised) is equal to x-µ / σ.
- In this case, Z for any given x value shows the number of standard deviations that x deviates from the mean of all values of x.
39. How may an outlier be used?
Ans:
A/B testing is impacted by outliers, which can be retained or eliminated based on the circumstances and the specifications of the data set.
The following are some strategies for handling data outliers:
- Remove anomalies from the data, particularly if there is a lot of it. It is advisable to eliminate the outliers if a data point is incorrect; alternatively, two options can be offered, one with and one without outliers.
- It is possible to change or eliminate outliers during post-test analysis. Trimming the data set is the best technique to adjust them. Changing the value of the outliers to other variables is the best option if the results are crucial and there are a lot of outliers.
40. How to detect outliers?
Ans:
In statistics, outliers are data points that significantly deviate from the overall pattern of the dataset. Several methods can help detect outliers
Visual Inspection: Plotting the data using box plots, scatter plots, or histograms can reveal points that lie far from the bulk of the data, indicating potential outliers.
Z-Score: Calculating the Z-score for each data point measures how many standard deviations it is from the mean. Points with a Z-score beyond a certain threshold (commonly ±2 or ±3) are considered outliers.
IQR (Interquartile Range): Using the IQR, which is the range between the first and third quartiles, can identify outliers as values lying outside a defined range (typically 1.5 times the IQR).
41. Why do we require sample statistics?
Ans:
Sample statistics are essential in statistics and research for several reasons:
- They provide a concise summary of key characteristics within a subset of a population, allowing researchers to make inferences about the entire population based on the observed sample.
- Sample statistics help quantify the variability and spread of data, providing insights into the distribution and patterns present.
- They serve as a basis for hypothesis testing, enabling researchers to conclude population parameters.
42. How do standard error and margin of error relate to each other?
Ans:
- Error margin = critical value X The population’s standard deviation and
- Error margin = critical value X Sample standard error.
- The standard error will rise along with the margin of error.
43. How much of the confidence intervals won’t include the population parameter?
Ans:
The proportion of confidence intervals that do not contain the population parameter is directly linked to the chosen confidence level. In statistics, a confidence interval is a range of values within which we expect the true population parameter to lie with a certain level of confidence. Generally used confidence levels are 90%, 95%, and 99%. Therefore, if using a 95% confidence level, expect that 5% of the intervals constructed from random samples will not contain the true population parameter.
44. What is skewness?
Ans:
Skewness is a statistical measure that defines the asymmetry of a probability distribution. It indicates the degree and direction of skew (departure from horizontal symmetry) in a dataset. A positively skewed distribution has a longer right tail, meaning the majority of data points are concentrated on the left side. In contrast, a negatively skewed distribution has a longer left tail.
45. What does the term covariance mean?
Ans:
Covariance is the statistical measure that quantifies the degree to which two variables change together.
It indicates the direction of the linear relationship between two variables – whether they tend to increase or decrease simultaneously.
A positive covariance suggests that when one variable increases, the other variable also tends to increase, while a negative covariance indicates an inverse relationship.
46. What is a confounding variable?
Ans:
An “extra” or “third” variable in statistics that is related to both the independent and dependent variables is called a confounding variable because it can lead to inaccurate estimations and meaningless outcomes.
For instance, in a study on the impact of weight growth, the dependent variable would be weight gain, and the independent variable would be not working out. As it will obscure or skew the impact of other study factors, food consumption in this situation may be the confounding variable. Another confusing factor that could alter the experiment’s design is the impact of the weather.
47. What does a model’s heteroscedasticity mean?
Ans:
In statistics, a model is considered heteroscedastic if the variability of the errors (residuals) is not constant across all levels of the independent variable(s). In simpler terms, the spread or dispersion of the residuals changes as the values of the predictor variables change. Heteroscedasticity violates one of the assumptions of classical linear regression, which assumes homoscedasticity or constant variance of errors. Identifying heteroscedasticity is crucial because it can lead to inefficient parameter estimates and biassed statistical inferences.
48. What is bias in selection, and what makes it significant?
Ans:
- In statistics, the term “selection bias” refers to the circumstance in which a group or set of people chosen for a study differs from the population of interest in such a way that the results show systematic mistakes.
- In most cases, selection bias can be found using bivariate tests in addition to conventional multiple regression techniques like logistic regression.
- To prevent skewed study outcomes, selection bias must be recognized and understood. In a study, selection bias may provide misleading information regarding a certain population group.
49. What is meant by autocorrelation?
Ans:
Autocorrelation in statistics refers to the degree of similarity between a time series and a lagged version of itself. In simpler terms, it measures how a variable correlates with its past values over a range of time intervals. A positive autocorrelation indicates a pattern where high values tend to follow high values, and low values follow low values, while a negative autocorrelation suggests an inverse relationship.
50. What does the Design of Experiments mean?
Ans:
- Design of Experiments (DOE) is a statistical methodology that involves systematically planning and conducting experiments to optimise processes and gain valuable insights.
- It aims to efficiently explore the factors that may affect a response variable and their interactions.
- DOE helps identify the most influential variables while minimising the number of experimental runs, making it a powerful tool for resource-efficient experimentation.
51. Explain Bessel’s correction.
Ans:
Bessel’s correction is a mathematical adjustment applied to sample statistics in order to provide unbiased estimates of population parameters. In statistics, when calculating the variance and standard deviation of a sample, the formula involves dividing by the sample size minus one rather than just the sample size. The rationale behind Bessel’s correction lies in addressing the inherent bias in sample variance and standard deviation calculations.
52. Which variables are utilised to get Pearson’s correlation coefficient?
Ans:
- Interval or Ratio Scale Variables: Pearson’s correlation coefficient is suitable for variables that exhibit interval or ratio scale properties. These scales allow for meaningful mathematical operations and comparisons between values. Examples include temperature measured in Celsius or Fahrenheit and income in dollars.
- Linearity Assumption: The correlation coefficient is most appropriate when a straight line can adequately represent the relationship between the variables. If the relationship is not linear, Pearson’s correlation may not accurately reflect the strength and nature of the association between the variables.
- Bivariate Normal Distribution: Pearson’s correlation assumes that the joint distribution of the two variables is bivariate normal, meaning that their values follow a normal distribution when considered together. Deviation from bivariate normality can affect the accuracy and reliability of the correlation coefficient.
53. Why are hash tables used in statistics?
Ans:
Hash tables are not directly used in statistics; however, they play a crucial role in efficient data storage and retrieval, which can be beneficial in statistical computations. In statistics, large datasets often require quick access to specific elements, and hash tables provide constant-time average complexity for search, insert, and delete operations. This can enhance the performance of statistical algorithms that involve frequent data manipulations, such as sorting, counting, and filtering.
54. Does symmetric distribution need to be unimodal?
Ans:
Symmetrical distribution does not need to be unimodal; it can be skewed or asymmetric. Symmetric distribution refers to a statistical distribution in which the values are equally distributed on both sides of the centre or mean, creating a mirror image when the distribution is graphically represented. While symmetry is a characteristic often associated with unimodal distributions, it is not a strict requirement.
55. What are the advantages of box plotting?
Ans:
Visualizing Data Distribution: Box plots provide a clear and concise way to visualise the distribution of a dataset.
Identifying Outliers: Box plots help identify potential outliers in a dataset.
Comparing Groups: Box plots are useful for comparing the distribution of different groups or categories within a dataset.
Summary Statistics: Box plots provide a visual representation of key summary statistics, including the median, quartiles, and potential outliers.
Handling Skewed Data: Box plots are robust against the influence of extreme values and are particularly useful for visualising skewed datasets.

Get JOB Oriented stata Training for Beginners By MNC Experts
- Instructor-led Sessions
- Real-life Case Studies
- Assignments
56. What does vectorization with TF/IDF mean?
Ans:
TF/IDF (Term Frequency-Inverse Document Frequency) vectorization is a statistical technique used in natural language processing and information retrieval to represent the importance of words in a document corpus. The method involves converting a collection of text documents into numerical vectors, capturing the significance of each term within a specific document in relation to the entire corpus.
57. What does “sensitivity” in statistics mean?
Ans:
Sensitivity in statistics refers to the ability of a statistical method or model to identify positive instances or true positives correctly. It is a measure of how well the method captures and correctly classifies the cases of interest. A higher sensitivity indicates a lower likelihood of false negatives, meaning that the method is effective at identifying the true positive cases within a dataset. Sensitivity is particularly crucial in situations where the consequences of missing positive instances are significant, such as in medical diagnoses or fraud detection.
58. What distinguishes the initial, second, and third quartiles from one another?
Ans:
- The median of the lower half of the data set is the first quartile or Q1.
- The median of the data set is the second quartile or Q2.
- The median of the top half of the data set is the third quartile or Q3. About 25% of the data set lies above Q3, 75% lies below Q3, and 50% lies below Q2.
59. What does kurtosis mean?
Ans:
Kurtosis is a metric that quantifies the extent of extreme values seen in one distribution tail or frequency distribution peak relative to the others. Kurtosis of 3 characterises the conventional normal distribution, while symmetry and kurtosis values between -2 and +2 are regarded as normal and appropriate. There may be outliers present in the data sets with high kurtosis levels. To solve this issue, more data must be added, or outliers must be eliminated. Low kurtosis data sets lack outliers and have light tails.
60. What is a distribution with a bell curve?
Ans:
- A bell-curve distribution symbolises a normal distribution and looks like a bell. In many circumstances, especially when examining financial data, it happens organically. The curve’s exactly symmetrical top displays the mode, mean, and median of the data. A bell-shaped curve’s essential features include
- In either direction, roughly 68% of the data fall within one standard deviation of the mean, according to the empirical rule.
- In either direction, about 99.7% of the data fall within three standard deviations, and about 95% of the data fall within two standard deviations.
61. What kinds of biases in selection are there?
Ans:
- Sampling bias: Non-random sampling is frequently the cause of this. To get around this, it’s best to take data from a non-self-selecting sample.
- Participant attrition: The percentage of study participants who discontinue their participation is known as participant attrition. By getting in touch with the individuals who left to find out if there is a common issue among them or if there is another reason, it can be prevented.
- Exposure: It happens when exposure and effect in a population are not internally validated or when exposure is incorrectly assessed.
- Data: This involves cherry-picking and dredging data, and it happens when a lot of variables are present in the data, leading to even fictitious outcomes.
62. What does the term “margin of error” mean?
Ans:
A confidence interval is the range that you expect the population parameter to be inside. To establish our confidence interval, we will add or subtract the margin of error from our estimation. For instance, a poll indicates that a specific candidate has a 51% chance of winning an election. There is a 4% error rate and a 95% confidence level. Assume for the moment that the same procedures were followed when conducting the survey. In 95% of cases, the pollsters predicted, the results would come in within 4% of the final result. Stated differently, they would expect the results to range from 47% (51-4) to 55% (51+4).
63. What does an event’s complement mean?
Ans:
Complementary events are denoted by the events “A occurs” and “A does not occur.” The event and all that goes along with it are incompatible. When rolling a die, for example, 1, 3, and 5 represent odd numbers, and 2, 4, and 6 represent even numbers.
These two phenomena are complementary to one another and do not occur together.
64. What distinguishes data from information?
Ans:
Any data is an unprocessed, raw, and disorganised truth that needs to be processed in order to be given significance. A word, number, picture, graph, etc can represent data. Context, meaning, and purpose-driven data are among the raw data that are processed to generate information. One way to think about data is as the information’s raw ingredient.
For example, a store’s volume of sales may be considered data, and the average sales could be inferred from this data.
65. Axioms of Probability: What Are They?
Ans:
- The basis of probability that is utilised to apply it to an event is known as the axioms of probability.
- Any event’s probability is a real number that is not negative.
- The entire sample space’s probability is one.
- When two probabilities, E_{1} and E_{2}, are mutually exclusive, we can state the following:
- E_{1} + P(E_{2}) = P(E_{1} \cup E_{2}) .
66. What presumptions are there in the Chi-square test?
Ans:
The suppositions used in the Chi-square test are as follows:
- Categorical: The value is thought to be categorical. (such as age, gender, degree of education, etc.)
- Independent: The value is regarded as independent.
- Exclusive of one another: The values/samples should only fall into one category and be mutually exclusive.
67. Explain the Poisson distribution.
Ans:
The likelihood of a discrete (countable) event is predicted by a discrete probability distribution called a Poisson distribution. The number of times an event occurs, indicated by k, is the discrete result of a Poisson distribution. One can forecast or explain the quantity of events that take place over a certain period or space using a Poisson distribution.
68. Explain the Difference between Correlation and Causation.
Ans:
Correlation explains the relationship between the two types of variables: when one changes, so does the other. Correlation is the statistical measure to calculate the extent of the relationship between two or more variables. But causation is the process through which changes in one variable induce changes in the other; there is a cause-and-effect relationship between the variables.
69. When are McNemar’s and Fisher’s exact tests appropriate to use?
Ans:
- The Fisher’s exact test is the better option if your sample size is small (less than 100). Use Fisher’s exact test if your data does not meet the requirement of at least five anticipated observations in each merged group.
- However, you should apply McNemar’s test when you have a pair of categorical variables with two groups that are strongly related. It allows you to determine whether the variable proportions are equal.
70. What distinguishes a permutation from a combination?
Ans:
Any arrangement of those n elements in a specific order is called a permutation of n elements. There are n factorial methods for handling n components. The number of r-tuples that can be taken from different elements equals the total number of permutations of n objects taken r at a time.
Combinations are the number of methods where order is not really important to choose r out of n things. The number of subsets with r items of a set with n elements is the total number of combinations of n things taken r at a time.
71. What is A/B testing’s main objective?
Ans:
In response: A statistical hypothesis containing two variables, A and B, is referred to as an A/B test. Finding any page modifications that maximise or increase the desired outcome is the main objective of A/B testing. A/B testing is an excellent way to determine which online marketing and promotion tactics are best for your company. In essence, it is used to evaluate search advertising, emails intended to close deals, and even the material on websites.
72. What is the meaning of Six Sigma in statistics?
Ans:
Six Sigma is a set of techniques and tools used for process improvement in various industries, with a primary focus on reducing variation and improving overall quality. The term “Six Sigma” refers to a statistical concept that quantifies how much a process deviates from perfection.
Define: Clearly define the problem and the goals of the improvement project.
Measure: Identify and measure the key aspects of the current process to establish a baseline performance.
Analyse: Use statistical methods to analyse the data and identify the root causes of defects or variations.
73. What presumption underlies the application of a Pearson correlation?
Ans:
The two variables being studied must both have a linear relationship and be normally distributed in order to use a Pearson correlation. Furthermore, homoscedasticity—the approximate equality of one variable’s variability across all values of the other—is assumed. Results that are not accurate can arise from breaking these presumptions.
74. What distinguishes frequentist statisticians from Bayesian statisticians?
Ans:
- Bayesian and frequentist statisticians take distinct stances when discussing probability. Based on subjective interpretation, Bayesian statistics uses probability to describe a belief level or the expected frequency over an extended period of identical trials. Using the Bayes theorem, it updates its previous knowledge with fresh data and incorporates it.
- Frequentist statistics, on the other hand, see probability as an objective indicator of the chance that a specific event will occur. It does not take previous ideas into account; instead, it only uses sample data. Although the conclusions are more strict, a small sample size may lead to misleading results.
75. Explain the time series analysis process.
Ans:
To predict future values, time series analysis looks for patterns in time-ordered data. Line plots, histograms, and box plots are first used in the procedure to visualise the data and comprehend its properties. The majority of models then want stationarity to be verified; if not, modifications like log or differencing are used.
76. How would you manage a dataset that contains corrupted or missing data?
Ans:
When dealing with incomplete or distorted data, I would start by figuring out what’s wrong by utilising Python tools like isnull() to find null values. Depending on the quantity and importance of these values, I would determine whether to blame or remove them after they were identified.
If they are too many or inconsequential, deleting them can be a preferable choice. Nonetheless, several imputation techniques, such as mean, median, mode, or predictive modelling approaches, can be applied if they are significant.
77. How would you manage a dataset that contains corrupted or missing data?
Ans:
When dealing with incomplete or distorted data, I would start by figuring out what’s wrong by utilising Python tools like isnull() to find null values. Depending on the quantity and importance of these values, I would determine whether to blame or remove them after they were identified. If they are too many or inconsequential, deleting them can be a preferable choice. Nonetheless, several imputation techniques, such as mean, median, mode, or predictive modelling approaches, can be applied if they are significant.
78. When would you apply a survival analysis, and what does it entail?
Ans:
A statistical technique called survival analysis, sometimes referred to as time-to-event or event history analysis, is employed to examine the anticipated amount of time until one or more events occur. It is frequently used in medical research to calculate patient survival rates following the start of an illness or treatment. It is also used in the social sciences to analyse unemployment durations, in engineering for failure time analysis, and in business analytics to anticipate customer churn.
79. Explain the Bias-Variance tradeoff.
Ans:
The Bias-Variance tradeoff is the fundamental concept in machine learning and statistics. It refers to the balance that can be achieved between bias, or error from erroneous assumptions, and variance, or error from sensitivity to the fluctuations in the training set.
High bias can cause an algorithm to miss relevant relations (underfitting), leading to low performance on both training and test data. High variance models are complex, with more parameters relative to the number of observations (overfitting). They perform well on training data but could improve on new, unseen data.
80. What is an outlier?
Ans:
An outlier in statistics refers to an observation or data point that significantly deviates from the overall pattern or trend of a dataset. It is an exceptional or unusual value that lies far from the majority of other data points. Outliers can have a substantial impact on statistical analyses, influencing measures such as the mean and standard deviation. Identifying and handling outliers is crucial for accurate and robust statistical inference.
81. Explain the significance of Stata’s “regress” command.
Ans:
The “regress” command in Stata is used for linear regression analysis. It estimates the coefficients of a linear equation, allowing researchers to model relationships between variables. The command provides essential statistical information, including coefficients, standard errors, t-statistics, and R-squared values, aiding in the interpretation of the linear regression results.
82. What is the purpose of Stata’s “tabulate” command?
Ans:
Stata’s “tabulate” command is used to generate frequency tables, cross-tabulations, and summary statistics for categorical variables. It provides a quick overview of the distribution of values within a variable or the relationship between two variables, aiding in the initial exploration of datasets.
83. Explain the use of Stata’s “graph” command?
Ans:
Stata’s “graph” command is employed for creating various types of graphs and visualisations. It supports a wide range of graph types, including scatter plots, bar charts, histograms, and more. Researchers use the “graph” command to visually explore data patterns, relationships, and distributions, enhancing the interpretability of their findings.
84. How can you export Stata results to an external file?
Stata allows users to export results using commands like outsheet for exporting datasets to Excel or CSV formats and log for saving Stata command outputs to a text file.
Additionally, the graph export command is useful for exporting graphs in various image formats like PNG or PDF.
85. What is the Difference between “summarise” and “codebook” commands in Stata?
Ans:
The “summarise” command provides basic summary statistics for numerical variables, such as mean, standard deviation, and quantiles. On the other hand, the “codebook” command offers a comprehensive summary of both numerical and categorical variables, including unique values, value labels, and variable descriptions, providing a more detailed overview of the dataset.
86. How can you check for multicollinearity in Stata?
Ans:
Stata provides the “collin” command to assess multicollinearity among independent variables in a regression model. High variance inflation factors (VIFs) indicate multicollinearity, suggesting that certain predictors are highly correlated. Addressing multicollinearity is crucial for obtaining reliable regression estimates and interpretations.
87. What is the purpose of Stata’s “bootstrap” command?
The “bootstrap” command in Stata is used for conducting bootstrap resampling, a statistical technique that estimates the sampling distribution of a statistic by repeatedly resampling with replacement from the dataset.
This method helps researchers assess the variability of their estimates and calculate confidence intervals, especially in cases where analytical solutions are challenging to obtain.
88. How can you perform nonparametric tests in Stata?
Ans:
Stata provides several commands for nonparametric tests, such as the Wilcoxon rank-sum test (rank-sum) for comparing two independent samples and the Kruskal-Wallis test (Kruskal) for comparing multiple groups. These tests are valuable when assumptions of normality are not met, offering robust alternatives for hypothesis testing.
89. What is the purpose of the “svy” prefix in Stata commands?
Ans:
The “svy” prefix is used in Stata to account for complex survey designs when conducting analyses. It adjusts standard errors to reflect the survey design’s stratification, clustering, and unequal probability of selection, ensuring that statistical inferences are more accurate and representative in survey-based research.
90. How do you assess the goodness of fit in logistic regression using Stata?
Ans:
- In logistic regression, the goodness of fit can be evaluated using the Hosmer-Lemeshow test, implemented in Stata with the fit command.
- The test assesses the agreement between observed and expected outcomes across different levels of predicted probabilities.
- A non-significant result suggests a good fit, while a significant result may indicate a lack of fit.