No.1 Power BI Certification Course With 100% Placement | Updated 2025

Power BI Course for All Graduates, NON-IT, Diploma & Career Gaps — ₹30,680/- only.

Download Brouchure
Join Our 100% Job Guaranteed

Power BI Certification Course

  • Join the Best Power BI Course to Master Data Visualization and Business Intelligence.
  • Complete Power BI Training Covers Data Modeling, DAX, Reports, Dashboards and Analytics.
  • Work on Real-Time Projects and Gain In-Demand Skills Through Practical, Hands-On Data Analysis.
  • Choose From Flexible Learning Modes: Weekday, Weekend or Fast-Track to Suit Your Schedule.
  • Advance Your Skills With a Power BI Certification Course and Job Placements.
  • Get Guidance for Resume Building, Interview Preparation and Career Strategies.

WANT IT JOB

Become a Power BI Developer in 3 Months

Freshers Salary

3 LPA

To

8 LPA

Quality Training With Affordable Fees!
INR ₹18000
INR ₹14000

9868+

(Placed)
Freshers To IT

4897+

(Placed)
NON-IT To IT

7586+

(Placed)
Career Gap

3215+

(Placed)
Less Then 60%

We Offer Both Online and Classroom Training in Chennai & Bangalore.

Our Hiring Partners

Overview of Power BI Course

Our Power BI Training equips you with both foundational and advanced business intelligence and data visualization skills through clear, practical lessons. This course covers essential tools and technologies like Power BI Desktop, Power Query, DAX, Data Modeling, Reports & Dashboards and Data Analysis. You'll also earn a Power BI Certification and gain hands-on experience through real-time data visualization projects. In addition, we offer a 30-Day Placement Preparation Program that includes resume building, job portal setup, daily job applications, mock interviews, HR guidance and soft skills training all designed to help you land a job faster in the field of data analytics and business intelligence.

What You’ll Learn From Power BI Training

  • This comprehensive Power BI course is suitable for beginners and professionals aiming to master business intelligence, data visualization and reporting using Power BI.
  • You’ll explore essential concepts such as data modeling, DAX formulas, interactive dashboards, report creation and connecting multiple data sources for meaningful insights.
  • Powerful tools like Power BI Desktop, Power BI Service and Power BI Mobile will help you design, visualize and share data-driven reports efficiently across organizations.
  • Hands-on projects simulate real-world business scenarios, allowing you to analyze sales, finance and operational data, create interactive dashboards and generate actionable insights for decision-making.
  • By the end of the program, you will be skilled in building robust reports, managing datasets, integrating with Excel and SQL databases and sharing insights via dashboards.
  • This training prepares you for roles such as Power BI Developer, Data Analyst or BI Consultant and includes a certification to strengthen your career profile.

Additional Info

Course Highlights

  • Master Power BI, Data Visualization, Business Intelligence, Dashboard Creation and Report Development.
  • Get 100% placement assistance with connections to top hiring companies.
  • Join 11,000+ learners placed successfully through our 350+ hiring partners.
  • Learn directly from Power BI experts with 10+ years of industry experience.
  • Enjoy flexible schedules, budget-friendly fees and lifetime access to learning resources.
  • Gain expert insights from 650+ tech mentors on a single platform.
  • Building successful BI careers through classroom training across 9+ centers in Bangalore and Chennai.

Exploring the Benefits of Power BI Course

  • Easy Data Visualization – Power BI helps you turn raw data into clear charts and dashboards. It makes trends and patterns easy to see Users can create interactive visuals simplify complex data. This helps in faster decision-making.
  • Real-Time Insights – You can monitor data in real-time with Power BI dashboards. Any updates in the source reflect immediately. This ensures timely actions and reduces delays in business decisions. It keeps teams informed with current information.
  • Data Integration – Power BI can connect to many sources like Excel, SQL and cloud platforms. It combines data from multiple places into one report. This gives a complete view of business data. Users don’t need to switch between tools.
  • Collaboration & Sharing – Reports and dashboards can be shared with teams easily. Everyone can access insights on desktop or mobile devices. This promotes teamwork and faster communication. Users can collaborate on decisions efficiently.
  • Cost-Effective BI Solution – Power BI offers powerful features at affordable pricing. Small and medium businesses can use advanced analytics without heavy investments. It reduces the need for multiple tools. Users get business intelligence at a low cost.

Essential Tools for Power BI Training

  • Power BI Desktop – This is the main instrument used to generate reports and dashboards. Learners can import data, build visualizations and design interactive reports. It supports data modeling and allows testing before publishing. Understanding this tool is key to mastering Power BI workflows.
  • Power Query – Power Query is used to clean, transform and prepare data from multiple sources. It simplifies combining datasets and removing errors. Learners gain skills in shaping data efficiently Proper use of Power Query ensures accurate analysis and reliable reports.
  • Power Pivot – Power Pivot helps manage large datasets and build complex data models It allows relationships between tables and advanced calculations using DAX. Students learn to handle high-volume data efficiently. This tool is essential for creating meaningful business insights.
  • Power BI Service (Cloud) – The Power BI Service enables publishing, sharing and collaboration on dashboards online. Users can access reports from any device and set up automated data refreshes. Learners gain experience in cloud-based BI management. It enhances teamwork and real-time decision-making.
  • DAX (Data Analysis Expressions) – DAX is a formula language for creating advanced calculations in Power BI. It helps in aggregations, measures and custom metrics. Learners can perform in-depth data analysis. Mastery of DAX improves the ability to generate actionable insights.

Top Frameworks Every Power BI Should Know

  • Power Query – Power Query helps in importing, cleaning and transforming data before analysis. It simplifies complex data preparation tasks Users can filter, merge and shape data efficiently. This ensures reports are accurate and ready for visualization.
  • DAX (Data Analysis Expressions) – Power BI uses DAX as its formula language for calculations and aggregations. It allows creating measures, calculated columns and complex metrics. Users can perform advanced analytics with simple formulas. It helps in deriving actionable business insights.
  • Power BI Service – Power BI Service is a cloud-based platform for publishing, sharing and collaborating on reports. It allows teams to access dashboards anytime, anywhere Users can manage permissions and schedule data refreshes. This makes reporting seamless and collaborative.
  • Power BI Desktop – The free program Power BI Desktop is used to create interactive reports and dashboards. Users get access to a variety of data sources and build visuals offline. It provides drag-and-drop functionality for ease of use. This is the core tool for all report development.
  • Power BI Mobile – Power BI Mobile allows accessing dashboards and reports on smartphones and tablets. Users can view, interact and share insights on the go. It ensures timely decision-making even outside the office. This framework makes data truly accessible anytime.

Must-Have Skills You’ll Gain in a Power BI Course

  • Data Visualization Expertise – You will learn to create engaging dashboards, charts and reports clearly display insights. This skill helps in presenting complex data in a simple and interactive way making analysis understandable for all stakeholders.
  • Data Modeling Skills – The course teaches to organize and structure data efficiently. You’ll learn to build relationships between datasets, clean data and prepare it for analysis, ensuring accurate reporting and insights.
  • Mastery of DAX – You’ll gain the ability to write advanced formulas for calculations, aggregations and dynamic measures. This empowers you to perform deep data analysis and extract meaningful business metrics from raw data.
  • Report Sharing and Collaboration – Power BI lets you publish and share dashboards with teams or across organizations. You’ll learn to manage access permissions, collaborate on reports and provide real-time insights for better decision-making.
  • Data Source Integration – The course covers connecting Power BI to multiple sources like Excel, SQL databases, cloud platforms and APIs. This skill ensures seamless data import, consolidation and up-to-date reporting from diverse sources.

Roles and Responsibilities of Power BI Training

  • Power BI Developer – A Power BI Developer designs and develops dashboards, reports and data models. It transform raw data into meaningful insights for decision-makers. They also implement DAX calculations and optimize performance. Developers ensure the BI environment is efficient and userfriendly.
  • Business Intelligence Analyst – BI Analysts use Power BI to analyze business data and identify trends. It create visual reports help management make informed decisions Their role includes data interpretation, forecasting and recommending strategies based on insights. They bridge the gap between data and business actions.
  • Data Modeler – Data Modelers structure and organize data for analysis in Power BI. They build relationships define hierarchies and ensure data accuracy. Their work supports reliable reporting and smooth dashboard operations They make sure data is ready for complex analytics.
  • Power BI Consultant – Consultants guide organizations in implementing Power BI solutions effectively They advise on best practices, data integration and dashboard design. They train teams and optimize reporting processes. Consultants ensure the organization leverages BI tools fully.
  • Reporting & Visualization Specialist – These specialists focus on creating interactive dashboards and visualizations. They turn complex datasets into easy-to-understand visuals. Their work enhances user experience and supports faster decision-making. They ensure reports are clear, actionable and visually appealing.

Why Power BI is a Great Career Option for Freshers

  • High Demand in Industry – Power BI is widely used across industries for data analysis and visualization. Freshers skilled in Power BI are in demand by IT firms, consulting companies and startups. This creates multiple job opportunities with competitive salaries.
  • Beginner-Friendly Learning Curve – Power BI is intuitive and easy to learn for beginners. Freshers can quickly grasp dashboard creation, data modeling and report sharing. This enables them to acquire useful talents and start working on real projects early.
  • Versatile Career Paths – Power BI opens doors to roles like Data Analyst, BI Developer, Reporting Analyst and Business Consultant. Freshers can explore different domains like finance, healthcare, marketing and operations using these skills.
  • Integration with Multiple Tools – Power BI connects seamlessly with Excel, SQL, cloud services and other databases. Freshers gain experience working with diverse data sources, making them more adaptable and valuable in any organization.
  • Strong Growth & Learning Opportunities – Power BI is always changing with new upgrades and features. Freshers can grow their careers by learning advanced analytics, DAX formulas and AI integration. This ensures long-term career growth and skill enhancement.

How Power BI Skills Help You Get Remote Jobs

  • In-Demand Analytics Skills – Power BI is widely used by companies for data analysis and reporting. Having expertise in dashboards, visualizations and data modeling makes you highly attractive for remote analytics roles. Skilled professionals can manage business insights from anywhere.
  • Ability to Handle Multiple Data Sources – Power BI allows connection to Excel, SQL, cloud services and APIs. Remote jobs often require analyzing data from various platforms and Power BI skills make it easy to extract, combine and present this information effectively.
  • Efficient Reporting and Automation – Power BI automates report generation and updates in real-time. Remote employees can quickly deliver accurate insights without manual effort, saving time and adding value to teams working in different locations.
  • Collaboration and Sharing – Power BI dashboards can be shared across teams securely. This feature enables remote workers to collaborate, present findings and make decisions with stakeholders without needing to be physically present in the office.
  • Competitive Advantage in the Job Market – Proficiency in Power BI sets you apart from other candidates. Employers prefer remote candidates who can independently analyze data, create dashboards and provide actionable insights, boosting your chances of landing high-paying remote roles.

What to Expect in Your First Power BI Job

  • Data Collection and Preparation – In your first role you will gather data from different sources like Excel, SQL or cloud platforms. Cleaning and organizing this data is essential before analysis. You’ll learn to handle missing values, duplicates and inconsistencies Proper data preparation ensures accurate reports.
  • Creating Dashboards and Reports – You’ll design interactive dashboards to visualize business metrics. Using charts, tables and graphs, you’ll make data easy to understand. Reports help stakeholders make informed decisions. Learning to present data clearly is key in your first job.
  • Applying DAX for Analysis – DAX formulas allow you to perform advanced calculations and aggregations. You’ll create custom measures, calculated columns and KPIs. This facilitates the extraction of valuable insights from unprocessed data. Strong DAX skills improve your value as a Power BI professional.
  • Collaboration and Sharing – You’ll share dashboards with team members or management using Power BI Service Setting up permissions and refreshing datasets is part of the process. Collaboration ensures everyone can access updated insights. This fosters teamwork and data driven decisions.
  • Monitoring and Performance Optimization – You’ll track dashboard performance and optimize queries for faster load times. Identifying bottlenecks in reports ensures smooth user experience Monitoring helps maintain accuracy and responsiveness Efficient dashboards enhance business decision making.

Top Companies Hiring Power BI Professionals

  • TCS (Tata Consultancy Services) – TCS actively hires Power BI professionals to build interactive dashboards and reports for global clients. Employees work on real time business intelligence projects, analyzing data to improve decision making. Strong Power BI skills are valued for client presentations and insights.
  • Infosys – Infosys recruits Power BI experts to create visual analytics and automated reports for enterprise solutions. Professionals help clients interpret complex data and identify trends. Power BI skills are used to enhance reporting accuracy and business efficiency.
  • Wipro – Wipro hires Power BI developers to transform large datasets into meaningful visuals. Employees design dashboards, monitor KPIs and provide insights to support strategic business decisions. Knowledge of Power BI is critical for data-driven solutions.
  • Cognizant – Cognizant looks for Power BI professionals to deliver business intelligence solutions for multiple industries. Candidates create interactive reports, track metrics and help organizations optimize processes. Power BI expertise aids in faster data backed decisions.
  • Capgemini – Capgemini employs Power BI specialists to design dashboards and data models for clients worldwide. Professionals convert raw data into actionable insights supporting business strategies. Power BI skills ensure accurate reporting and visualization of complex datasets.
Show More

Tools Covered For Power BI Training

Power BI Desktop Power BI Service Power BI Data Gateway Power BI Mobile Apps Power BI Report Builder Power BI Report Server Power Query Power Pivot

Job-Guaranteed Course with Add-on Benefits

INR ₹14000
INR ₹18000

OFF Expires in

What’s included ?

Convenient learning format

📊 Free Aptitude and Technical Skills Training

  • Learn basic maths and logical thinking to solve problems easily.
  • Understand simple coding and technical concepts step by step.
  • Get ready for exams and interviews with regular practice.
Dedicated career services

🛠️ Hands-On Projects

  • Work on real-time projects to apply what you learn.
  • Build mini apps and tools daily to enhance your coding skills.
  • Gain practical experience just like in real jobs.
Learn from the best

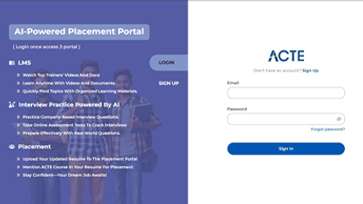
🧠 AI Powered Self Interview Practice Portal

  • Practice interview questions with instant AI feedback.
  • Improve your answers by speaking and reviewing them.
  • Build confidence with real-time mock interview sessions.
Learn from the best

🎯 Interview Preparation For Freshers

  • Practice company-based interview questions.
  • Take online assessment tests to crack interviews
  • Practice confidently with real-world interview and project-based questions.
Learn from the best

🧪 LMS Online Learning Platform

  • Explore expert trainer videos and documents to boost your learning.
  • Study anytime with on-demand videos and detailed documents.
  • Quickly find topics with organized learning materials.

Power BI course Syllabus

  • 🏫 Classroom Training
  • 💻 Online Training
  • 🚫 No Pre Request (Any Vertical)
  • 🏭 Industrial Expert

Our Power BI Training is designed with a complete syllabus perfect for beginners and aspiring data professionals. Through this Power BI Course, you will learn data visualization, data modeling, Power Query, DAX formulas and report creation. The Power BI course also covers Power BI Service, dashboard sharing and data refresh techniques. Students gain hands-on experience through Power BI Internships and real-time projects.

  • Introduction to Power BI – Learn the basics of Power BI, including data import, report creation and visualization.
  • Advanced Techniques – Explore DAX, data modeling and Power Query for powerful data analysis.
  • Hands-On Practice – Work with real data to build interactive dashboards and reports.
  • Deployment and Collaboration – Publish reports, schedule refreshes and collaborate using Power BI Service.
Power BI Foundamentals
Data Loading and Transformation
Data Modeling
DAX (Data Analysis Expressions)
Data Visualization Techniques
Power BI Service and Publishing
Security and Advanced Features

Understand the basics of Power BI and how it helps in data analysis:

  • Power BI Overview – Learn what Power BI is and why its used
  • Power BI Interface – Explore the layout and components of Power BI Desktop
  • Types of Power BI Tools – Desktop, Service and Mobile overview
  • Installation – Install Power BI Desktop and set up the environment
  • Connecting Data – Connect to Excel, CSV and other file formats

Learn to bring in data and make it ready for reporting using Power Query:

  • Power Query Editor – Explore the user interface for data transformation
  • Data Cleaning – Remove errors, blank rows and fix data formats
  • M Language Basics – Understand the scripting behind Power Query
  • Column and Row Operations – Add, remove, split and merge columns
  • Append and Merge Queries – Combine data from multiple sources

Organize your data for efficient reporting and performance:

  • Relationships – Create and manage relationships between tables
  • Star and Snowflake Schema – Understand data modeling structures
  • Calculated Columns – Add new data fields using expressions
  • Hierarchies – Create drill-down levels in your data
  • Data Categories – Tag columns as location, web URL or images

Use DAX to perform advanced calculations and metrics:

  • DAX Syntax – Learn DAX formulas are written
  • Calculated Measures – Create KPIs like total sales, profit margin, etc.
  • Aggregation Functions – Use SUM, AVERAGE, COUNT, etc.
  • Time Intelligence – Work with YTD, MTD, QTD calculations
  • Filter Functions – Use CALCULATE, FILTER, ALL for dynamic analysis

Create insightful visuals and dashboards:

  • Basic Charts – Bar, Column, Line, Pie and Donut charts
  • Advanced Visuals – Maps, Matrix, Waterfall, Funnel and Gauge charts
  • Slicers and Filters – Add interactivity to your reports
  • Tooltips and Bookmarks – Improve the user experience
  • Custom Visuals – Import visuals from Power BI marketplace

Learn to share, schedule and manage reports online:

  • Power BI Service – Navigate the cloud based platform
  • Workspaces – Organize and manage report access
  • Report Publishing – Upload dashboards to the Power BI Service
  • Dashboard vs Report – Understand the difference and use cases
  • Data Refresh – Schedule automatic updates for your data

Protect your data and explore advanced options:

  • Row-Level Security – Control who sees what data
  • Q and A Visual – Enable natural language queries in reports
  • Drill-through and Drill-down – Enable deeper data exploration
  • Performance Analyzer – Optimize your report speed
  • Export and Embed – Share reports via PDF, PowerPoint or websites

🎁 Free Addon Programs

Aptitude, Spoken English.

🎯 Our Placement Activities

Daily Task, Soft Skills, Projects, Group Discussions, Resume Preparation, Mock Interview.

Get Hands-on Real Time Power BI Projects

Who Should Take a Power BI Course

IT Professionals

Non-IT Career Switchers

Fresh Graduates

Working Professionals

Diploma Holders

Professionals from Other Fields

Salary Hike

Graduates with Less Than 60%

Show More

Job Roles For Power BI Training

Power BI Developer

Business Intelligence (BI) Analyst

Data Analyst

Data Engineer

Power BI Consultant

BI Architect

Data Scientist

Reporting Analyst

Show More

Getting Started With Power BI Course

No Coding
8 Lakhs+ CTC
No Work Pressure
WFH Jobs (Remote)

Career Support

Placement Assistance

Exclusive access to ACTE Job portal

Mock Interview Preparation

1 on 1 Career Mentoring Sessions

Career Oriented Sessions

Resume & LinkedIn Profile Building

Get Advanced Power BI Certification

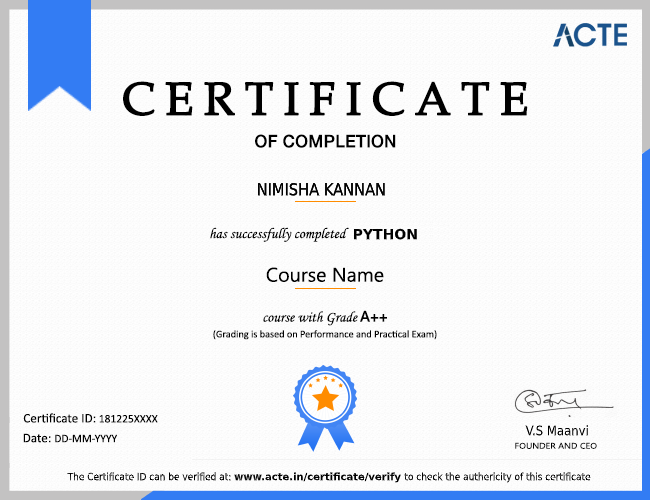
You'll receive a certificate proving your industry readiness.Just complete your projects and pass the pre-placement assessment.This certification validates your skills and prepares you for real-world roles.

Get Certified

Lowest Power BI Course Fees

Affordable, Quality Training for Freshers to Launch IT Careers & Land Top Placements.

Call Course Advisor

Power BI Course FAQs

1. What is the duration of a Power BI course?

The Power BI course typically spans 2 to 3 months, covering data visualization, DAX calculations, dashboards, report sharing and real-time projects.
ACTE sessions are hands-on and interactive, led by industry experts. Learners get real-time project experience, making concepts easier to understand and apply.
The program offers weekday, weekend and self-paced options to accommodate students, working professionals and career switchers.
Mentor support, live doubt-clearing sessions and discussion forums are available to ensure all questions are resolved promptly.
Building a strong foundation in Power BI basics ensures learners can confidently handle advanced analytics, DAX formulas and complex dashboards.
Anyone with basic computer knowledge can enroll. There are no strict educational requirements, making it suitable for students, graduates and working professionals.
The course starts from fundamentals and gradually covers advanced Power BI concepts. Learners from non-IT backgrounds can gain practical skills in data visualization and reporting.
By completing real-time Power BI projects, learning DAX, dashboards and analytics and leveraging ACTE’s placement assistance, graduates from various backgrounds can secure IT roles.
Many learners with career gaps successfully transition into IT roles after completing Power BI training and showcasing hands on project experience.
Absolutely, The course is beginner friendly with step by step guidance, practical exercises and mentor support, making Power BI accessible to everyone.

1. What are the requirements to qualify for the placement benefit?

Learners must complete the full Power BI course, participate in hands-on projects and meet ACTE’s attendance and performance criteria to be eligible for placement assistance.

2. What guidelines must be followed to get a placement successfully?

Students should actively engage in project work, complete assignments, polish resumes, attend mock interviews and follow mentor advice to improve placement chances.

3. How would my career planning session benefit my career and who will serve as my mentor?

Career planning sessions help learners set clear goals, prepare for interviews and choose suitable roles. Experienced Power BI mentors provide guidance throughout the placement process.

4. Where and what kind of internship might I anticipate after completing the program?

Internships are typically offered at IT firms, consulting companies and analytics teams, focusing on dashboard creation, report development and data analysis using Power BI.

5. What is the stipend I will get an offer for?

Stipends vary based on the company and project, ranging from beginner-level amounts to higher compensation for advanced analytics and reporting tasks.
  • Power BI Certification
  • Microsoft Power BI Data Analyst Associate
  • Power BI Dashboard and Report Developer Certificate
  • Business Intelligence Specialist Certificate
  • Real-Time Project Completion Certificate
While certification validates your Power BI skills and enhances your resume, employment depends on hands-on experience, project work and interview performance. It strengthens opportunities but does automatically guarantee a job.
Certification can be achieved within 2 to 3 months, depending on learning pace. This includes completing course modules, practicing dashboards, performing data modeling and working on real-time projects.
  • Enhances career opportunities in IT and analytics roles
  • Strengthens resume for top companies and clients
  • Builds confidence in handling complex data projects
  • Recognized globally by organizations using BI solutions
  • Practice building dashboards and interactive reports
  • Learn DAX formulas and data modeling techniques
  • Work on real-time datasets and projects
  • Take mock tests and sample exam questions
  • Seek guidance from mentors for difficult concepts

1. What are the different options available to pay the course fee?

Payment methods include credit/debit cards, online banking, UPI or EMI options. ACTE provides flexible payment plans to suit individual financial needs.
Refund policies depend on ACTE’s terms and conditions. Generally, if the course is canceled or you withdraw within a specified period, partial or full refunds may be provided.
Fees may vary due to location-based operational costs, instructor availability, infrastructure and additional services offered at specific centers.
Yes, ACTE maintains a standardized course fee across all cities, ensuring consistency in training quality and learning experience.

Our Branches

Acte Technologies WhatsApp

Power BI Course for All Graduates, NON-IT, Diploma & Career Gaps — ₹30,680/- only.

Download Brouchure