
Last updated on 10th Jul 2020| 2644
What is Nagios?
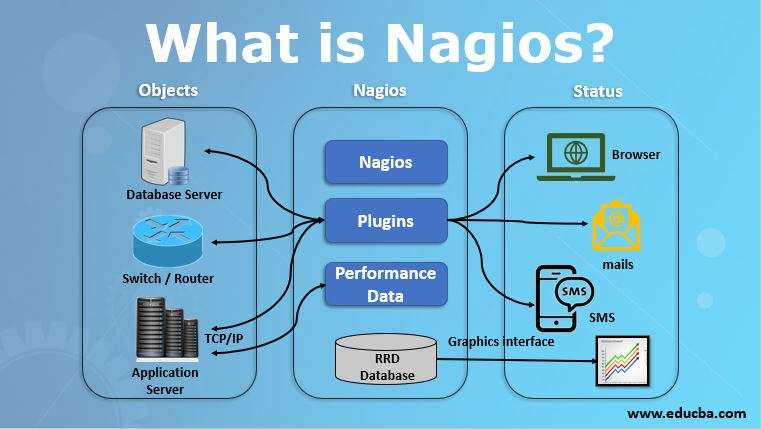
Nagios is a robust open-source tool designed for IT management and monitoring, empowering organizations to detect and resolve infrastructure issues efficiently. It supports monitoring across Linux, Windows, and Unix systems, consistently tracking critical metrics related to applications, networks, and servers. When thresholds are breached, Nagios promptly notifies via email or text messages.
Nagios boasts a flexible architecture that allows users to create customized monitoring and alerting tools. Additionally, it offers several commercial products:
- Nagios XI: Streamlines IT infrastructure monitoring.
- Nagios Log Server consolidates log viewing, analysis, archival, and alerting capabilities across all sources.
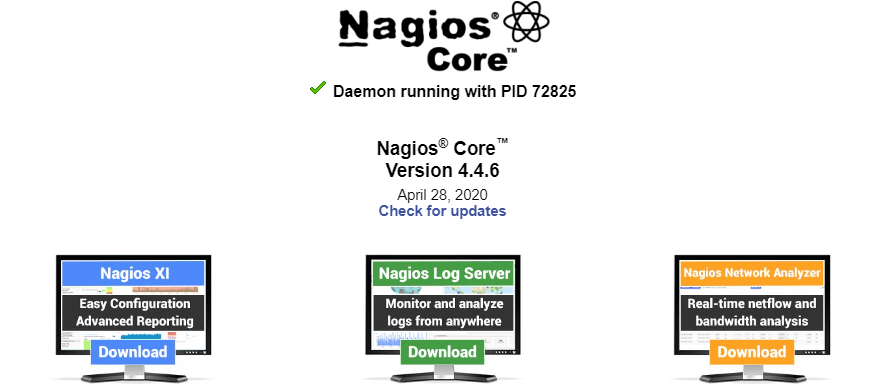
- Nagios Core: Provides a robust engine for scalable and efficient monitoring.
Reasons to choose Nagios include its effective monitoring of server performance, quick problem identification, comprehensive network issue detection, and management of security issues and service availability. It automatically resolves issues, operates seamlessly across diverse operating systems, and proactively updates infrastructure to prevent failures. Nagios also excels in swiftly detecting various infrastructure issues and monitoring database servers like SQL Server and MySQL.
Why Nagios?
Here are some reasons to consider using the Nagios software application:
- It monitors server performance issues effectively.
- It helps swiftly pinpointing the underlying causes of issues.
- It detects all potential network issues.
- It facilitates security issue management and service availability detection.
- It automatically resolves problems as they arise.
- It runs seamlessly on various operating systems.
- It proactively updates infrastructure to prevent system failures.
- It swiftly detects a wide range of infrastructure issues.
- It monitors database servers like SQL Server and MySQL.
Tutorial Scope:
Introduction to Nagios: Overview and significance in IT infrastructure monitoring.
Installation: Step-by-step guidance on installation across different operating systems.
Configuration: Detailed instructions for configuring Nagios to monitor diverse devices, services, and applications.
Plugins: Understanding and utilizing plugins to extend Nagios functionality for specific monitoring needs.
Alerting: Setting up alerts via email, SMS, or other methods upon issue detection.
Reporting: Generating and interpreting reports to analyze monitoring data and performance trends.
Advanced Features: Exploring advanced functionalities such as event handlers, distributed monitoring, and integration with other tools.
Best Practices: Guidance on optimizing Nagios performance and ensuring reliable monitoring.
Troubleshooting: Common issues and troubleshooting tips for maintaining Nagios installations.
Examples of practical applications showcasing Nagios in diverse operational settings.
Together, these topics provide comprehensive guidance on deploying, configuring, and leveraging Nagios effectively for IT infrastructure monitoring.
Prerequisites for a Nagios tutorial typically include:
Fundamental comprehension of IT infrastructure and networking principles.
Expertise in operating systems such as Linux, Windows, and Unix.
Knowledge of system administration tasks.
Basic understanding of monitoring and alerting concepts.
Proficiency in using the command line interface (CLI) for configuration and troubleshooting.
Access to a computer or virtual machine to install and practice Nagios.
Sections:
Installation:
Installing Nagios is crucial for effective IT infrastructure monitoring. Follow these steps to set up Nagios on your system:
Prerequisites: Ensure your system meets the hardware and software requirements for Nagios installation, including supported operating systems like Linux, Unix, or Windows.
Download Nagios: Obtain the latest version of Nagios from the official website or repository. Choose the appropriate package based on your operating system and architecture (32-bit or 64-bit).
Install Dependencies: Install any necessary dependencies for Nagios, such as web servers (Apache or Nginx), PHP, and required libraries.
Compile and Install Nagios: Follow the compilation and installation instructions provided in the Nagios documentation. Typically, this involves extracting the downloaded package, configuring it with specific options, compiling the source code, and installing it on your system.
Configure Nagios: Once installed, configure Nagios to monitor your infrastructure. This includes setting up configuration files for hosts, services, contacts, and commands based on your monitoring requirements.
Start Nagios: Start the Nagios service and verify its functionality. Access the Nagios web interface to ensure that monitoring is operational and displaying relevant data.
Set Up Monitoring: Begin setting up monitoring checks for your devices, applications, and services within Nagios. Configure notifications for alerting via email, SMS, or other methods when issues arise.
Explore Advanced Features: Explore advanced features of Nagios, such as plugins for extending monitoring capabilities, scheduling downtime, and integrating with other monitoring tools or systems.
Documentation and Support: Refer to Nagios documentation and community resources for troubleshooting, best practices, and further customization options.
Security Considerations: Ensure Nagios is configured securely, with appropriate access controls and monitoring of its own performance and security metrics.
By following these steps, you can successfully install and configure Nagios for effective IT infrastructure monitoring tailored to your organization’s needs.

Get Practical Oriented Full Stack Web Development Certification Course By Experts Trainers
Weekday / Weekend BatchesSee Batch DetailsConfiguration:
Here are some steps for configuring Nagios:
Check for System Updates: Run sudo apt update to ensure you have the latest packages.
Install Prerequisite Packages: Install all necessary packages required for running Nagios.
Download and Compile Nagios: Obtain the Nagios source files and compile them.
Install Nagios Binaries and Service: Set up Nagios Core as a service and enable it.
Install Nagios Web Interface: Configure Apache and the Nagios web user interface.
Create the First Nagios User: Establish a user and group for managing Nagios.
Install Nagios Plugins: Integrate over 4,000 available plugins for extensive monitoring capabilities.
Start the Nagios Daemon: Launch the Nagios Core daemon along with Apache to activate monitoring.
Basic Monitoring Setup:
1. Install Nagios:
To install Nagios Core on Ubuntu 20.04, follow these steps:
Update Your System: Make sure your system is current with the latest packages.
Install Prerequisites: Install the necessary packages required for Nagios.
Download Nagios Core: Obtain the Nagios Core source code.
Compile and Install Nagios: Compile the source code and install Nagios.
Set Up Apache and Nagios UI: Configure Apache web server to work with the Nagios web interface.
Create a Nagios User: Create the first user for accessing the Nagios web interface.
Install Nagios Plugins: Install essential plugins to extend Nagios functionality.
Start the Nagios Daemon: Initiate the Nagios service to start monitoring.
2. Configure Monitoring:
To set up a new monitoring process:
Open the Configure menu and click on “Run the Monitoring Wizard” to access the setup tool for creating a new monitoring process.
3. Monitor Remote Hosts:
To monitor remote hosts, follow these steps:
Install Nagios Plugins and NRPE on Remote Hosts: NRPE (Nagios Remote Plugin Executor) allows Nagios to execute plugins on remote systems.
Configure Remote Hosts on the Nagios Server: Create configuration files for each remote host in the /usr/local/nagios/etc/servers/ directory on the Nagios server.
Nagios Tutorial Conclusion
As we wrap up this Nagios tutorial, let’s review the key points we’ve covered and the importance of this powerful monitoring tool.
1. Introduction to Nagios:
We started with an overview of Nagios, highlighting its role in monitoring and maintaining IT systems. Understanding the basics of Nagios set the foundation for our deeper dive into its functionalities.
2. Installation and Setup:
We walked through the steps to install Nagios on different operating systems. This included downloading necessary files, configuring settings, and starting the Nagios service to ensure it runs smoothly.
3. Monitoring Hosts and Services:
We learned how to add hosts and services to Nagios, allowing us to monitor specific parts of our IT environment. This customization helps us keep track of critical components and receive alerts when something goes wrong.
4. Notifications and Alerts:
Setting up notifications was a crucial part of the tutorial. We explored how to ensure the right people are alerted promptly when issues arise, helping us respond quickly and effectively.
5. Plugins and Extensions:
Nagios can be extended with various plugins to monitor different types of services and hardware. We looked at how to use these plugins to enhance Nagios’ monitoring capabilities.
6. Advanced Features:
For more advanced users, we covered custom plugins, integration with other tools, and distributed monitoring. These features help create a more tailored and scalable monitoring solution.
7. Troubleshooting and Maintenance:
To keep Nagios running efficiently, we discussed troubleshooting techniques and maintenance practices. Regular checks and updates are key to a reliable monitoring system.
8. Real-World Applications:
We examined real-world examples of how Nagios is used in different IT environments, from small networks to large data centers, showing its versatility and effectiveness.