Enroll Now in Data Analytics Course in T. Nagar | Updated 2025

Data Analytics Course for All Graduates, NON-IT, Diploma & Career Gaps — ₹18,500/- only.

Download Brouchure
Join Our 100% Job Guaranteed

Data Analytics Course in T. Nagar

  • Gain Real-World Skills Through Live Projects and Expert-Led Sessions.
  • Data Analytics Program in T. Nagar with career guidance and Placement Assistance.
  • Data Analytics Course in T. Nagar Includes training in Excel, SQL, Python, Power BI.
  • Flexible Timings – Choose Weekday, Weekend, or Fast-Track Batches to Suit Your Schedule.
  • Get Professional Support for Resume Creation, Interview Skills, and Overall Career Growth.
  • Join the Top Data Analytics Training Institute in T. Nagar Develop In-Demand Skills in Data Analysis & Visualization.

WANT IT JOB

Become a Data Analyst in 3 Months

Freshers Salary

3 LPA

To

8 LPA

Quality Training With Affordable Fees in T. Nagar!
INR ₹32000
INR ₹18500

10254+

(Placed)
Freshers To IT

5987+

(Placed)
NON-IT to IT

7412+

(Placed)
Career Gap

3654+

(Placed)
Less Then 60%

Our Hiring Partners

Overview of Data Analytics Course

You will learn the principles of data analysis from the bottom up with our Data Analytics Course in T. Nagar. Through real-world projects, you'll obtain practical experience with tools like Power BI, Python, SQL, and Excel. The course will walk you through every step of the data workflow, from gathering and cleaning data to analyzing it and drawing conclusions that can be put into practice. You will graduate with a certification to further your career and be prepared for positions in data analytics.

What You'll Learn From Data Analytics Training

The Data Analytics Training in T. Nagar is tailored for both beginners and professionals to build strong foundational and advanced data skills from the ground up.

Learn key concepts such as Excel, SQL, and Python, along with powerful data visualization tools like Tableau and Power BI to effectively interpret and present data.

Our program trains you to analyze data, identify trends, and make data-driven decisions using real-world business scenarios.

Gain practical experience through live projects and expert-led training sessions to enhance your confidence and hands-on skills.

By the end of the course, you'll be well-versed in data analytics best practices and earn an industry-recognized certification.

This course equips you for high-demand roles in data analytics and business intelligence across leading organizations.

Additional Info

Course Highlights

  • Choose Your Learning Path – Master Excel, SQL, Python, Power BI, and Tableau in one comprehensive Data Analytics Course.
  • Benefit from job placement support with leading companies actively hiring data analytics professionals.
  • Join a growing community of 11,256+ students successfully trained and placed through our 350+ hiring partners.
  • Learn from industry experts with over a decade of hands-on experience in data analytics and business intelligence.
  • Our course features beginner-friendly lessons, real-time projects, and personalized career support throughout your journey.
  • With affordable fees, 100% placement assistance, and flexible class schedules, it's ideal for fresh graduates and career changers.
  • Launch your career in Data Analytics with confidence, equipped with in-demand skills and real-world project experience.

Exploring the Benefits of Data Analytics Course

  • Informed Decision-Making: By giving you the ability to analyze complicated statistics, a data analytics course helps firms make more informed decisions. You'll discover how to use real-time data to identify trends, patterns, and opportunities, reducing uncertainty and boosting operational effectiveness. Deeper insights lead to more accurate and significant decisions.
  • High-Demand Career Opportunities: Data analytics skills are in high demand across various industries such as healthcare, finance, marketing, and technology. This course prepares you for roles like data analyst, business analyst, and data scientist. These positions offer competitive salaries and strong growth potential, making it a valuable investment in your career.
  • Enhanced Business Performance: Learning data analytics empowers individuals to drive process improvements and elevate customer satisfaction. By evaluating performance metrics, you can identify issues and recommend effective solutions. This leads to better resource utilization and increased profitability. Companies highly value employees who can transform data into actionable strategies.
  • Stronger Problem-Solving Skills: The course enhances your logical thinking and ability to tackle complex challenges. You'll adopt a data-driven approach to problem-solving, which benefits both professional and everyday decision-making. Over time, it builds your confidence and sharpens your critical thinking abilities.

Essential Tools for Data Analytics Training

  • Power BI for Interactive Dashboards: Power BI is a powerful business analytics tool developed by Microsoft that allows users to create interactive dashboards and reports. It connects to various data sources and transforms raw data into meaningful insights. With built-in AI capabilities and real-time analytics, Power BI is widely used in businesses for effective data storytelling and decision-making.
  • R for Statistical Computing: R is a programming language specifically built for statistical analysis and visualization. It offers a rich ecosystem of packages like ggplot2, dplyr, and caret for data wrangling, statistical modeling, and machine learning. R is especially preferred in academia and research-driven industries for its analytical depth and accuracy.
  • Google Sheets for Collaborative Analysis: Google Sheets is a cloud-based spreadsheet tool that enables real-time collaboration and data handling. It supports built-in formulas, charts, and integration with Google Data Studio for extended visualization. Its accessibility and ease of use make it ideal for small teams and quick data projects.
  • Apache Hadoop for Big Data Processing: Hadoop is an open-source framework designed to store and process large datasets across distributed computing systems. It is commonly used in enterprise-level data environments to handle massive volumes of unstructured or semi-structured data efficiently. Learning Hadoop is beneficial for professionals working with big data platforms and infrastructure.

Top Frameworks Every Data Analytics Should Know

  • Apache Flink: Apache Flink is a stream-processing framework known for its high-performance and low-latency capabilities. It supports real-time data analytics and event-driven applications across distributed environments. Flink is ideal for tasks that require continuous data processing and real-time insights, such as fraud detection and recommendation systems.
  • Dask: Dask is a flexible parallel computing framework for Python that scales analytics from a single machine to a cluster. It integrates seamlessly with popular Python libraries like Pandas and NumPy, making it ideal for handling larger-than-memory datasets. Dask is commonly used for parallel computing in data science and machine learning workflows.
  • Kibana: Kibana is a visualization framework that works with Elasticsearch to explore and analyze log and time-series data. It provides real-time visualization through dashboards, graphs, and heatmaps. Kibana is widely used in monitoring, security analytics, and observability solutions for IT operations.
  • Looker: Looker is a modern data platform that enables businesses to explore, visualize, and share analytics in a scalable way. It operates on top of existing databases and uses a modeling language called LookML. Looker is ideal for embedding analytics into workflows and creating data-driven decision environments across organizations.

Must-Have Skills You’ll Gain in a Data Analytics Training

  • Machine Learning Fundamentals: You'll gain a solid foundation in machine learning concepts, including supervised and unsupervised learning techniques. These skills allow you to build models that can predict outcomes and uncover patterns in data. Understanding ML is crucial for roles in AI-driven analytics.
  • Data Cleaning and Preprocessing: The course teaches you how to clean, format, and prepare raw data for analysis. You’ll work with missing values, inconsistent data types, and outliers to ensure accuracy. This step is essential for reliable analytics and is widely used across industries to improve data quality and integrity.
  • Big Data Handling with Spark and Hadoop: Learn to manage and analyze large datasets using big data frameworks like Apache Spark and Hadoop. These tools help you process massive volumes of data quickly and efficiently. Gaining this skill makes you valuable in data engineering and enterprise-level analytics roles.
  • Dashboard Creation and Reporting: Develop the ability to design professional dashboards and automated reports for stakeholders. You’ll learn how to set KPIs, monitor performance, and present metrics clearly. This is essential for business reporting, executive summaries, and performance tracking across departments.

Roles and Responsibilities of Data Analytics Training

  • Business Intelligence Analyst: In order to produce useful insights for strategic decision-making, a business intelligence analyst gathers and examines data. They produce dashboards and reports that showcase market trends and important performance metrics.
  • Data Scientist: A Data Scientist develops advanced analytical models using statistics, machine learning, and programming. They explore complex datasets to identify hidden patterns and generate predictive insights. Their work supports product development, customer segmentation, and risk assessment.
  • Data Architect: A Data Architect designs and oversees the data infrastructure for an organization. They create blueprints for data management systems and ensure data security, quality, and accessibility. This role is critical for integrating diverse data sources and supporting scalable analytics solutions.
  • Analytics Consultant: An Analytics Consultant works closely with clients to understand their business challenges and recommend data-driven strategies. They analyze existing processes, implement analytics solutions, and help organizations optimize operations. Their expertise helps translate data insights into practical business value.

Why Data Analytics is a Great Career Option for Freshers

  • Wide Range of Job Roles: Data analytics skills open doors to various roles such as data engineer, business analyst, data scientist, and machine learning engineer. Freshers can explore positions in data governance, quality assurance, and reporting. This diversity allows you to find a career path that matches your strengths and interests.
  • Entry Points for Various Backgrounds: Careers in data analytics welcome candidates from different educational backgrounds including IT, mathematics, economics, and engineering. Many roles focus on problem-solving and analytical thinking rather than just coding. This makes it easier for freshers from diverse fields to enter and succeed.
  • Opportunities in Emerging Technologies: The field offers roles related to artificial intelligence, cloud computing, and big data analytics. Freshers can work on cutting-edge projects involving natural language processing, predictive modeling, or data automation. These high-tech areas offer exciting career prospects and innovation-driven work.
  • Roles in Industry-Specific Analytics: Many industries require specialized data roles, such as healthcare data analyst, financial risk analyst, or marketing analytics consultant. Freshers can target careers tailored to industry needs, gaining expertise that increases their value and job security.

How Data Analytics Skills Help You Get Remote Jobs

  • Boosts Collaboration Across Locations: Data analytics tools enable seamless sharing of insights and reports, making it easier to collaborate with remote teams. You can contribute to projects and decision-making regardless of where you are located. This ability to work effectively with distributed teams is highly valued by employers.
  • Improves Time Management Skills: Working with data often involves managing multiple tasks such as data cleaning, analysis, and reporting. Remote roles require strong time management to prioritize and meet deadlines without direct supervision. Developing these skills helps you stay productive and reliable in flexible work environments.
  • Offers Access to Global Networking: Remote data analytics jobs connect you with professionals and clients worldwide. This expands your professional network and exposes you to diverse perspectives and best practices. Building these connections enhances career growth and opens opportunities across borders.
  • Supports Work-Life Integration: The nature of data analytics work allows you to balance professional responsibilities with personal life more easily. Remote roles often let you customize your work environment and schedule to suit your needs. This flexibility contributes to better mental well-being and job satisfaction.

What to Expect in Your First Data Analytics Job

  • Adapting to Changing Data Sources: In your early career, you’ll encounter data coming from multiple and constantly evolving sources like APIs, databases, and external vendors. Learning to integrate and standardize this diverse data is essential. Flexibility in handling various formats ensures your analyses remain accurate and relevant.
  • Developing Analytical Thinking: Beyond tools, you’ll cultivate critical thinking skills to question data quality, identify trends, and test hypotheses. This mindset helps you uncover deeper insights and avoid misleading conclusions. Analytical thinking is a core strength that distinguishes top data professionals.
  • Collaborating Across Departments: Your role will often require coordinating with different departments to gather requirements and validate findings. Building relationships with stakeholders like product managers, sales teams, or HR ensures your analysis aligns with organizational goals. Strong teamwork enhances the impact of your work.
  • Continuous Learning and Improvement: The data landscape evolves rapidly with new methods and software emerging frequently. Staying updated by attending workshops, reading research, and experimenting with new tools will be part of your routine. Embracing lifelong learning keeps your skills sharp and career advancing.

Top Companies Hiring Data Analytics Professionals

  • Tata Consultancy Services (TCS): TCS is a global IT services leader that actively recruits data analytics professionals to support digital transformation initiatives. They emphasize data-driven solutions using tools like Hadoop, Python, and Tableau. TCS offers a collaborative work culture with opportunities to work on projects across industries such as banking, retail, and manufacturing.
  • Wipro: Wipro hires data analysts to help clients harness data for improved business outcomes. The company focuses on advanced analytics, AI, and cloud integration. Wipro supports continuous learning through certifications and training programs. It’s an excellent choice for data professionals seeking exposure to innovative technologies and diverse sectors.
  • Deloitte: By employing professionals to offer insights that influence business plans, Deloitte incorporates data analytics into its consulting and advisory services. The company uses machine learning, SQL, and Power BI to work with big datasets. With chances for career progression in industries like government, healthcare, and finance, Deloitte provides a vibrant work environment.
  • Cognizant: Cognizant employs data analytics professionals to drive digital innovation and optimize business processes for its global clients. The company focuses on data engineering, visualization, and predictive analytics using platforms such as Spark and QlikView. Cognizant promotes skill development and provides international project exposure for career growth.
Show More

Upcoming Batches For Classroom and Online

Weekdays
28 - July - 2025
08:00 AM & 10:00 AM
Weekdays
30 - July - 2025
08:00 AM & 10:00 AM
Weekends
02 - Aug - 2025
(10:00 AM - 01:30 PM)
Weekends
03 - Aug - 2025
(09:00 AM - 02:00 PM)
Can't find a batch you were looking for?
INR ₹18500
INR ₹32000

OFF Expires in

Who Should Take a Data Analytics Training

IT Professionals

Non-IT Career Switchers

Fresh Graduates

Working Professionals

Diploma Holders

Professionals from Other Fields

Salary Hike

Graduates with Less Than 60%

Show More

Job Roles For Data Analytics Course

Data Analyst

Business Analyst

Data Scientist

Analytics Consultant

BI Developer

Data Engineer

Statistician Analyst

Data Quality Analyst

Show More

Tools Covered For Data Analytics Training

Apache-Spark power-bi Tableau Data-Studio excel SQL R-Programming python1

What’s included ?

Convenient learning format

📊 Free Aptitude and Technical Skills Training

  • Learn basic maths and logical thinking to solve problems easily.
  • Understand simple coding and technical concepts step by step.
  • Get ready for exams and interviews with regular practice.
Dedicated career services

🛠️ Hands-On Projects

  • Work on real-time projects to apply what you learn.
  • Build mini apps and tools daily to enhance your coding skills.
  • Gain practical experience just like in real jobs.
Learn from the best

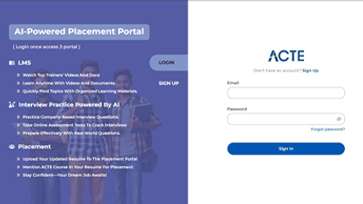
🧠 AI Powered Self Interview Practice Portal

  • Practice interview questions with instant AI feedback.
  • Improve your answers by speaking and reviewing them.
  • Build confidence with real-time mock interview sessions.
Learn from the best

🎯 Interview Preparation For Freshers

  • Practice company-based interview questions.
  • Take online assessment tests to crack interviews
  • Practice confidently with real-world interview and project-based questions.
Learn from the best

🧪 LMS Online Learning Platform

  • Explore expert trainer videos and documents to boost your learning.
  • Study anytime with on-demand videos and detailed documents.
  • Quickly find topics with organized learning materials.

Data Analytics Course Syllabus

  • 🏫 Classroom Training
  • 💻 Online Training
  • 🚫 No Pre Request (Any Vertical)
  • 🏭 Industrial Expert

Students enrolling in the Data Analytics Course have the option to select a specialized track that matches their interests and career goals, enhancing their chances of placement with top companies. This flexible learning approach enables them to focus on specific areas like data visualization, statistical analysis, or machine learning, while building a strong foundation in core analytics skills.

  • Data Analytics with Python – Focuses on Python programming with libraries like Pandas, NumPy and Matplotlib for effective data manipulation and visualization.
  • Data Analytics with R – Covers R programming for statistical computing, data analysis and graphical representation in various domains.
  • Business Analytics Track – Emphasizes tools like Excel, Power BI and SQL to extract business insights and support decision-making.
  • Machine Learning Track – Includes hands-on training in algorithms, data modeling and predictive analytics using Python and scikit-learn.
Fundamentals of Data Analytics
Excel for Data Analysis
SQL for Data Querying
Python for Data Analytics
Data Visualization Tools
Basics of Machine Learning
Statistics for Data Analytics

These form the foundation of understanding data and analytics:

  • Types of Data – Structured, semi-structured and unstructured data
  • Analytics Types – Descriptive, diagnostic, predictive, prescriptive
  • Data Lifecycle – Collection, cleaning, analysis, visualization, interpretation
  • Roles in Analytics – Data analyst, business analyst, data scientist

These are used for basic data manipulation and visualization:

  • Formulas & Functions – SUM, IF, VLOOKUP, INDEX, MATCH
  • Data Cleaning Tools – Remove duplicates, text-to-columns, data validation
  • Pivot Tables – Summarize and explore large datasets
  • Charts – Column, bar, line, pie, combo charts for visualization

These are used to interact with relational databases:

  • SELECT Queries – Retrieve specific data from tables
  • JOINs – Combine data from multiple tables (INNER, LEFT, RIGHT)
  • GROUP BY & Aggregations – SUM, AVG, COUNT for grouped data
  • Subqueries & Aliasing – Use queries within queries and rename columns

These libraries are used for programming and data operations:

  • NumPy – Numerical computations and array handling
  • Pandas – Dataframes for reading, transforming and analyzing data
  • Matplotlib – Basic charting and visualizations
  • Seaborn – Statistical data visualizations with styling options

These are used to create dashboards and interactive reports:

  • Power BI – Microsoft’s business intelligence tool
  • Tableau – Visual analytics platform for building dashboards
  • Filters & Slicers – Interactive controls for data exploration
  • Calculated Fields – Custom formulas within visuals

These are used to apply predictive analytics and modeling:

  • Scikit-learn – Python library for machine learning
  • Supervised Learning – Regression, classification
  • Unsupervised Learning – Clustering techniques like K-Means
  • Model Evaluation – Accuracy, confusion matrix, cross-validation

These concepts help understand patterns and support decision-making:

  • Descriptive Statistics – Mean, median, mode, range, standard deviation
  • Probability – Basic probability, distributions, conditional probability
  • Inferential Statistics – Hypothesis testing, confidence intervals, t-tests
  • Correlation & Regression – Relationships and prediction between variables

🎁 Free Addon Programs

Aptitude, Spoken English

🎯 Our Placement Activities

Daily Task, Soft Skills, Projects, Group Discussions, Resume Preparation, Mock Interview

Get Real-Time Experience in Data Analytics Projects

Placement Support Overview

Today's Top Job Openings for Data Analytics

Service Desk Analyst

Company Code : WPO416

Chennai, Tamilnadu

₹30,000 - ₹40,000 a month

Any Degree

Exp 0-2 yrs

  • We are looking for fresh graduates with excellent communication skills in English and strong technical knowledge to join our team as Support Analysts. Candidates must hold a minimum graduation degree with all marksheets available. In this role, you will assist users by diagnosing and resolving IT issues.
  • Easy Apply

    Business Analyst

    Company Code : CPS805

    Chennai, Tamilnadu

    ₹30,000 - ₹40,000 a month

    Any Degree

    Exp 0-1yr

  • We are currently recruiting for dynamic Business Analysts will drive our continued growth and success. With a strong focus on innovation, they will identify, develop and support the implementation of strategic initiatives to enhance efficiency and productivity.
  • Easy Apply

    Data Scientist

    Company Code : CFD612

    Chennai, Tamilnadu

    ₹20,000 - ₹40,000 a month

    Any Degree

    Exp 0-5 yrs

  • In this role you will analyze complex data sets, develop predictive models and generate actionable insights to support business strategies. The role requires strong expertise in statistics, machine learning and data visualization.
  • Easy Apply

    Data Engineer

    Company Code : YST413

    Chennai, Tamilnadu

    ₹15,000 - ₹25,000 a month

    Any Degree

    Exp 0-3 yrs

  • Opportunities are now open for a data analytics professional with hands-on experience in big data tools such as Hadoop, Spark and Kafka, along with strong proficiency in scripting languages like Python and Scala. The ideal candidate should have expertise in both SQL and NoSQL databases, including Postgres and MongoDB and be capable of building scalable data pipelines and architectures.
  • Easy Apply

    Marketing Analyst

    Company Code : MPN316

    Chennai, Tamilnadu

    ₹25,000 - ₹50,000 a month

    Any Degree

    Exp 0-3 yrs

  • We are expanding and hiring for a Marketing Analyst can develop and implement effective marketing analysis solutions to support organizational goals. The role involves monitoring key performance metrics, conducting detailed analysis and preparing reports to guide decision-making. Collaboration with cross-functional teams and the creation of technical documentation are also key responsibilities.
  • Easy Apply

    Operations Analyst

    Company Code : CRL431

    Chennai, Tamilnadu

    ₹30,000 - ₹50,000 a month

    Any Degree

    Exp 0-1 yrs

  • We are actively seeking qualified candidates for a detail-oriented professional to manage accruals, invoice processing and contract documentation in close coordination with business and internal teams. The role involves regular interaction with Finance, Compliance, Tax and IT/Infosec departments, ensuring smooth operations and timely resolution of queries. Responsibilities also include preparing MIS reports.
  • Easy Apply

    Business Analyst

    Company Code : ZKA721

    Chennai, Tamilnadu

    ₹25,000 - ₹50,000 a month

    Any Degree

    Exp 0-2 yrs

  • Join our team – we are hiring talented people to become part of our team, where salary will not be a constraint for deserving candidates. The role involves reviewing and analyzing current systems to evaluate their efficiency and effectiveness, while recommending strategic improvements. Candidates will also define the scope and parameters of analysis to ensure measurable outcomes and actionable results.
  • Easy Apply

    Data Analyst

    Company Code : WSA812

    Chennai, Tamilnadu

    ₹15,000 - ₹25,000 a month

    Any Degree

    Exp 0-1 yrs

  • Exciting roles available – apply now For Data Engineer/Analyst to join our team at We Shine Academic and support the development of scalable data infrastructure. The role involves collaborating with teams to gather requirements, building and optimizing data systems and preparing raw data for analysis. Candidates should have a strong focus on accuracy.
  • Easy Apply

    Internship Highlights for Data Analytics

    Real-Time Projects

    • 1. Gain hands-on experience by working on live industry-based applications.
    • 2. Understand real-world problem-solving through Data Analytics scenarios.
    Book Session

    Skill Development Workshops

    • 1. Participate in focused sessions on trending technologies and tools.
    • 2. Learn directly from industry experts through guided practical exercises.
    Book Session

    Employee Welfare

    • 1. Enjoy benefits like health coverage, flexible hours, and wellness programs.
    • 2. Companies prioritize mental well-being and work-life balance for all employees.
    Book Session

    Mentorship & Peer Learning

    • 1. Learn under experienced mentor guide your technical and career growth.
    • 2. Collaborate with peers to enhance learning through code reviews and group projects.
    Book Session

    Soft Skills & Career Readiness

    • 1. Improve communication, teamwork, and time management skills.
    • 2. Prepare for interviews and workplace dynamics with mock sessions and guidance.
    Book Session

    Certification

    • 1. Earn recognized credentials to validate your Data Analytics skills.
    • 2. Boost your resume with course or project completion certificates from reputed platforms.
    Book Session

    Sample Resume for Data Analytics (Fresher)

    • 1. Simple and Neat Resume Format

      – Use a clean layout with clear sections like summary, skills, education, and projects.

    • 2. List of Technologies You Know

      – Mention skills like Excel, SQL, Python, Power BI, Tableau, Data Visualization, and Data Cleaning tools.

    • 3. Real-Time Projects and Achievements

      – Add 1–2 real-time projects with a short description and the tools used.

    Top Data Analytics Tricky Interview Questions and Answers (2025 Guide)

    Ans:

    The methodical process of extracting valuable insights from data is known as data analysis. It entails gathering information from multiple sources, then cleaning, converting, and analyzing it. Before analysis, raw data must be processed to fill in the blanks and eliminate unnecessary entries because it frequently contains errors or missing information.

    Ans:

    Data profiling is the detailed examination of each data element within a dataset. Its purpose is to provide accurate information about the data’s structure and attributes, such as data types, frequency distribution, and other key characteristics.

    Ans:

    Data validation refers to the process of verifying the accuracy and quality of data and its source. Two key components of data validation are:

    • Data Screening: Using various techniques to ensure the data is accurate and free from duplicates.
    • Data Verification: Assessing any detected duplicates through multiple steps to confirm the existence or validity of the data items.

    Ans:

    Data analysis involves organizing, cleaning, and interpreting data to generate clear insights. Data mining, on the other hand, focuses on discovering hidden patterns and relationships within large datasets. While data mining uncovers complex patterns, data analysis presents results that are easier to understand by a broad audience.

    Ans:

    • Google Search Operators
    • RapidMiner
    • OpenRefine
    • Tableau
    • KNIME

    Ans:

    A data point that substantially deviates from the average or typical values in a dataset is called an outlier. Outliers fall into two categories: multivariate, which involves multiple variables, and univariate, which is based on a single variable.

    Ans:

    A good data model is one that reliably predicts future outcomes. It should be adaptable to changes in the data, capable of handling large volumes of data when needed, and straightforward enough for clients to understand and use to achieve their goals.

    Ans:

    Since data continuously evolves, changes such as business growth or shifts in data trends may require updating the model. Regular evaluation helps analysts decide when retraining is necessary to maintain accuracy and relevance.

    Ans:

    Also called Data Wrangling, data cleaning is the process of identifying and correcting errors or inconsistencies in datasets to ensure high data quality. Common techniques include:

    • Removing the data block entirely.
    • Finding ways to fill a black data in without causing redundancies.
    • Replacing data with mean or median values.
    • Making use of the placeholders for empty spaces.

    Ans:

    Pivot tables in Excel allow users to easily summarize and analyze large datasets. With drag-and-drop functionality, users can quickly create reports and explore data trends without complex formulas.

    Company-Specific Interview Questions from Top MNCs

    1.How does data science differ from data analytics, and what does it entail?

    Ans:

    Data science encompasses extracting insights and creating predictive models using methods from statistics, machine learning, and computer science. In contrast, data analytics primarily focuses on analyzing datasets to identify trends and solve problems, often through descriptive statistics. Data science is broader and emphasizes prediction.

    2. What responsibilities does a data scientist hold within a company?

    Ans:

    A data scientist develops models to address business challenges, processes and cleans large datasets, analyzes data, and presents insights to stakeholders through visualizations and reports.

    3. What distinguishes structured data from unstructured data?

    Ans:

    Structured data is organized in rows and columns, like in SQL databases. Unstructured data lacks a fixed format and includes types such as images, videos, emails, and social media content.

    4. What are the main stages of a data science project?

    Ans:

    • Data cleaning and preprocessing
    • Exploratory data analysis (EDA)
    • Data collection
    • Model building
    • Model evaluation

    5. How is missing data handled in datasets?

    Ans:

    Common approaches include removing rows or columns with missing values, imputing missing entries using mean, median, or mode, and employing advanced techniques such as K-Nearest Neighbors (KNN) imputation or regression-based methods.

    6. How is cross-validation applied during model evaluation?

    Ans:

    Cross-validation divides the data into multiple training and validation subsets (e.g., k-fold cross-validation), providing a more reliable assessment of model performance and helping prevent overfitting.

    7. What is the difference between supervised and unsupervised learning?

    Ans:

    • Supervised learning uses labeled data to train models for tasks like classification and regression.
    • Unsupervised learning works with unlabeled data, enabling the model to find hidden patterns through methods like clustering and dimensionality reduction.

    8. What is a confusion matrix, and what are its key elements?

    Ans:

    A confusion matrix assesses the performance of classification models by displaying:

    • True Positives (TP)
    • True Negatives (TN)
    • False Positives (FP)
    • False Negatives (FN)

    9. How do you choose important features in a dataset?

    Ans:

    Feature selection methods include:

    • Filter methods
    • Wrapper methods
    • Embedded methods

    10. How does the k-nearest neighbors (KNN) algorithm function?

    Ans:

    KNN classifies a data point based on the majority class among its 'k' closest neighbors in the training data, using distance measures like Euclidean distance. For regression, it predicts the average value of the neighbors.

    11. What is the working principle of the decision tree algorithm?

    Ans:

    Decision trees recursively split data into branches based on features that maximize information gain or minimize Gini impurity, continuing until terminal leaf nodes are reached.

    12. What are Support Vector Machines (SVM), and where are they applied?

    Ans:

    SVM identifies the optimal hyperplane that separates classes in feature space. It is effective in high-dimensional problems such as text classification, face recognition, and bioinformatics.

    13. How does the Naive Bayes algorithm work?

    Ans:

    Naive Bayes is a probabilistic classifier that applies Bayes' theorem, assuming features are independent. It calculates the posterior probability for each class and assigns the class with the highest probability.

    14. What is k-means clustering, and what are its typical applications?

    Ans:

    K-means partitions data into ‘k’ clusters by minimizing within-cluster variance based on feature similarity. It is commonly used for market segmentation, image compression, and customer grouping.

    15. What is a neural network, and how does it operate?

    Ans:

    A neural network consists of layers of interconnected nodes (neurons). Each neuron computes a weighted sum of inputs followed by an activation function. The network learns by adjusting weights through backpropagation during training.

    1. What responsibilities does a Data Analyst have?

    Ans:

    A data analyst gathers, processes, and interprets data to support decision-making within organizations. They prepare reports, clean datasets, and use various tools to detect trends and extract insights.

    2. How skilled are you in SQL? Can you provide a simple SQL query to retrieve data from a database?

    Ans:

    I’m proficient in SQL and can efficiently retrieve and manipulate data for analysis. I use SQL to filter, join, and aggregate data. For example, to get employee names and ages from the Sales department: SELECT name, age FROM employees WHERE department = 'Sales';

    3. What steps do you take to ensure data quality during analysis?

    Ans:

    I check for missing values, duplicates, incorrect data types, and outliers, and apply validation rules. Additionally, I verify the data against source systems to maintain accuracy.

    4. What is data cleaning, and why is it necessary?

    Ans:

    Data cleaning refers to correcting or removing inaccurate, inconsistent, or incomplete data. It’s essential to ensure the analysis is trustworthy and the conclusions drawn are valid.

    5. Which tools do you commonly use for data analysis?

    Ans:

    Frequently used tools include Excel, SQL, Python (Pandas, NumPy), R, Power BI, Tableau, and Google Sheets.

    6. What differentiates a primary key from a foreign key in SQL?

    Ans:

    • Use rate limiting
    • Primary key with unique identifies each record in a table.
    • Foreign key with links one table to another by referencing a primary key.

    7. How do you handle missing or incomplete data in a dataset?

    Ans:

    • Remove incomplete records.
    • Impute missing values using mean, median, or mode.
    • Apply predictive modeling for imputation.
    • Analyze missing data patterns.

    8. Can you explain what data normalization is?

    Ans:

    Normalization involves organizing a database to minimize redundancy by dividing data into related tables and establishing relationships through foreign keys.

    9. What is a pivot table, and how do you use it in Excel?

    Ans:

    A pivot table summarizes and organizes data, allowing dynamic grouping, filtering, and aggregation useful for analyzing large datasets like sales by region.

    10. How do causation and correlation differ?

    Ans:

    • Correlation: While the two variables move together, they may not have an impact on one another.
    • Causation: One variable directly influences another.

    11. Why is data visualization important in data analysis?

    Ans:

    Visualization simplifies complex data, reveals patterns, and helps stakeholders quickly understand insights through charts, graphs, and dashboards.

    12. How would you explain a complicated data analysis project to someone without a technical background?

    Ans:

    I’d use clear, simple language, focus on business implications, support points with visuals, and avoid technical jargon to emphasize what the findings mean for their objectives.

    13. What is regression analysis? Could you describe different types of regression?

    Ans:

    Regression explores relationships between variables:

    • Linear regression: Predicts a continuous outcome
    • Logistic regression: Predicts binary outcomes
    • Multiple regression: Uses multiple predictors
    • Polynomial regression: Models nonlinear relationships

    14. What does the ETL process entail?

    Ans:

    ETL stands for Extract, Transform, Load. It refers to:

    • Extract data from various sources
    • Transform it to fit analysis needs
    • Load it into a data warehouse or database

    15. How do you maintain data quality during analysis?

    Ans:

    Maintaining data quality during analysis involves thorough data cleaning to handle missing values, outliers, and inconsistencies. It’s essential to validate data sources and ensure accuracy by cross-referencing with reliable datasets or documentation.

    16. What is A/B testing?

    Ans:

    A/B testing compares two versions (A and B) of a variable to determine which performs better. It’s widely used in user experience design and marketing, like testing email subject lines.

    1. Which tools are most commonly used by data analysts?

    Ans:

    Data analysts typically use Excel, SQL, Power BI, Tableau, Python (with libraries like Pandas and NumPy), R, Google Sheets, and sometimes software like SAS or SPSS depending on the organization.

    2. What methods do you use to handle missing data in a dataset?

    Ans:

    • Remove rows or columns with excessive missing values.
    • Impute missing data using mean, median, or mode.
    • Apply forward fill or backward fill to propagate nearby values.
    • Use predictive models to estimate and fill missing data.
    • Flag missing entries with indicators for analysis or modeling.

    3. How do a database and a data warehouse differ?

    Ans:

    • Database: Stores real-time transactional data; optimized for read/write operations.
    • Data warehouse: Stores historical, aggregated data from multiple sources; optimized for analysis and reporting.

    4. Why is data cleaning crucial in data analysis?

    Ans:

    Data cleaning ensures consistency, accuracy, and reliability of data, which is essential for producing dependable insights and making informed decisions.

    5. What does data normalization mean, and why is it important?

    Ans:

    Normalization is the process of organizing data to minimize redundancy and dependency. It’s important for preserving data integrity and enabling efficient querying in relational databases.

    6. How do you create a pivot table in Excel?

    Ans:

    • Select your data range
    • Go to Insert → PivotTable
    • Choose where to place the table
    • Drag fields to Rows, Columns, Values, and Filters

    7. Can you describe what a join is in SQL and its various types?

    Ans:

    • INNER JOIN: Matching records from both tables
    • LEFT JOIN: All from left table + matches from right
    • RIGHT JOIN: All from right table + matches from left
    • FULL JOIN: All records when there's a match in either
    • SELF JOIN: Table joins with itself

    8. What is data visualization and why is it important in analysis?

    Ans:

    Data visualization is the graphical display of data using charts, graphs, etc. It helps stakeholders quickly grasp trends, identify outliers, and recognize patterns for better decision-making.

    9. How do you perform data validation?

    Ans:

    • Set data quality rules such as data type, acceptable range, and format.
    • Use scripts or software tools to detect violations of these rules.
    • Cross-verify data with source systems for accuracy.
    • Utilize validation features in Excel, SQL constraints, or ETL platforms.

    10. What is the concept of data modeling?

    Ans:

    Data modeling involves designing the structure of a database, defining tables, columns, relationships, and keys to ensure logical organization and efficient data retrieval.

    11. How would you tackle a project involving a large unstructured dataset?

    Ans:

    • Start by understanding the data and defining clear objectives.
    • Use tools like Python or Apache Spark for preprocessing.
    • Convert unstructured data into structured formats using parsing or natural language processing.
    • Clean the data to remove noise and inconsistencies.
    • Analyze and visualize the results to derive insights.

    12. What does ETL mean in data processing?

    Ans:

    ETL stands for Extract, Transform, Load: extracting data from source systems, transforming it into a suitable format, and loading it into a data warehouse or another destination system.

    13. How would you explain data mining to a layperson?

    Ans:

    Data mining is like searching through a large collection of information to find hidden patterns or valuable insights, similar to sifting through files to discover useful details.

    14. What are some common statistical metrics used in data analysis?

    Ans:

    • Mean, median, mode
    • Standard deviation and variance
    • Percentiles and quartiles
    • Correlation and covariance

    15. How do you evaluate the quality of your data analysis?

    Ans:

    • Perform cross-validation of results.
    • Conduct peer reviews for accuracy and reliability.
    • Run consistency checks across datasets and outputs.
    • Ensure alignment with business goals and objectives.
    • Verify underlying assumptions and data integrity.

    1. Which tools do you typically use for data analysis?

    Ans:

    Excel, SQL, Python (including libraries like Pandas and NumPy), R, Power BI, Tableau, Jupyter Notebooks, and Google Sheets are examples of popular tools. Technical complexity, project goals, and dataset size are some of the variables that affect the choice.

    2. How do you handle datasets that have missing values?

    Ans:

    • Remove rows or columns with too many missing values.
    • Impute missing data using mean, median, mode, or predictive techniques.
    • Use placeholders or flags when data is genuinely unavailable.
    • Analyze missing data patterns to identify and avoid bias.

    3. What are the various types of regression methods?

    Ans:

    Common regression techniques are linear regression, multiple regression, logistic regression, ridge and lasso regression, and polynomial regression.

    4. How do you maintain data quality throughout your analysis?

    Ans:

    • Validate data against source systems for accuracy.
    • Check for duplicates, outliers, and missing data.
    • Use automated scripts to verify data consistency.
    • Document data provenance and cleaning processes thoroughly.

    5. What is data normalization and why does it matter?

    Ans:

    Normalization standardizes data scales or structures:

    • In databases: Reduces redundancy
    • In analysis: Ensures fair comparisons and improves model performance

    6. Can you describe what a pivot table does?

    Ans:

    A pivot table in Excel helps summarize and analyze data by automatically grouping and aggregating values (such as sums, averages, or counts) based on row and column categories.

    7. What does the p-value indicate in statistical tests?

    Ans:

    The p-value measures the probability that an observed effect is due to chance. A low p-value (usually less than 0.05) indicates that the result is statistically significant.

    8. Can you share an example of a difficult data analysis project you completed?

    Ans:

    For instance, I examined customer attrition for a telecom provider whose data was disorganized and lacking. In order to lower churn, I handled missing values, combined several data sources, created a logistic regression model, and provided practical suggestions.

    9. What is SQL and why is it essential for data analysts?

    Ans:

    SQL (Structured Query Language) is used to extract, filter, join, and manipulate data stored in relational databases. It’s crucial for accessing and preparing data before analysis.

    10. What is the purpose of a data warehouse?

    Ans:

    A data warehouse is a centralized repository that stores integrated data from various sources, optimized for querying and reporting, making it ideal for historical analysis and business intelligence tasks.

    1. Who is a data analyst, and what are their key responsibilities?

    Ans:

    To assist organizations in making well-informed decisions, a data analyst gathers, arranges, and analyzes data. Data cleaning, database querying, report generation, trend visualization, and data-driven strategy support are some of their responsibilities.

    2. How do data analysis and data science differ?

    Ans:

    • Data analysis involves interpreting existing datasets to extract insights.
    • Data science includes data analysis as one of its components.
    • Data science involves building predictive models and applying machine learning.
    • It uses advanced algorithms to uncover deeper and more complex insights.

    3. Which tools and technologies are commonly used for data analysis?

    Ans:

    • SQL for querying databases
    • Excel for quick analysis and reporting
    • Python (Pandas, NumPy) or R for deeper analysis
    • Tableau or Power BI for visualization
    • ETL tools like Talend, Alteryx, or Excel Power Query for data preparation

    4. What is SQL, and how does it support data analysis?

    Ans:

    SQL (Structured Query Language) enables interaction with relational databases, allowing analysts to extract, filter, join, and modify data essential for analysis.

    5. What is a primary key, and why is it vital in a database?

    Ans:

    A primary key uniquely identifies each row in a table, ensuring data integrity and enabling reliable relationships between tables through joins.

    6. What are some typical data formats encountered in data analysis?

    Ans:

    • CSV
    • Excel
    • JSON
    • XML
    • SQL databases
    • Parquet and ORC

    7. How do you define and assess data quality?

    Ans:

    Data quality refers to the accuracy, completeness, consistency, timeliness, and validity of data. It is assessed through checks like validation rules, null value counts, duplicate rates, and detection of outliers.

    8. What role does a data analyst play within a project team?

    Ans:

    A data analyst collaborates with engineers, data scientists, and business stakeholders to gather requirements, prepare and analyze data, visualize findings, and support evidence-based decision-making.

    9. Why is data-driven decision-making important?

    Ans:

    It allows organizations to make decisions based on objective insights rather than intuition, leading to better performance, lowered risks, and more effective strategic planning.

    10. How do you ensure data accuracy and completeness?

    Ans:

    By validating data sources, performing data cleaning, checking for inconsistencies, conducting spot checks, and thoroughly documenting all data transformations and assumptions.

    11. What does data normalization mean?

    Ans:

    In databases, normalization reduces redundancy and improves data integrity by organizing tables efficiently. In data analysis, normalization also refers to rescaling features (e.g., scaling between 0 and 1) to improve model performance.

    12. What is the difference between data cleaning and data wrangling?

    Ans:

    • Data cleaning fixes errors (e.g., missing, incorrect, duplicate values).
    • Data wrangling, that involves cleaning, restructuring, combining, and formatting, turns unprocessed data into a format that can be utilized.

    13. How do you handle duplicate records in a dataset?

    Ans:

    • Identify duplicates using keys or logic
    • Remove or consolidate based on rules
    • Trace the source of duplication and correct upstream if possible

    14. Which tools do you use for data preparation?

    Ans:

    Common tools include Python (Pandas), R (dplyr), Excel Power Query, SQL, Alteryx, Talend, and cloud services like Google DataPrep or AWS Glue.

    15. What are outliers, and how do you manage them?

    Ans:

    Outliers are data points that deviate significantly from the rest. Handling methods include investigating their cause (error or valid), removing or capping extreme values (winsorizing), transforming variables (e.g., log transformation), or using robust statistics like median and interquartile range.

    Disclaimer Note:

    The details mentioned here are for supportive purposes only. There are no tie-ups or links with the corresponding PGs.

    Ladies PG Accommodation

      Velachery
    • Sanz Live Women's PG : 72007 19990
    • Krishnaveni Castle : 90801 95007
    • Anna Nagar
    • Pentos Women's PG : 93427 57797
    • Women's Nest - Ladies PG : 94451 25894
    • OMR
    • MSR Luxury PG : 89399 91922
    • Porur
    • Sree Shakthi Ladies Hostel : 90031 98767
    • Friends Ladies Hostel : 73389 19836
    • Tambaram
    • CK HIVE Girls Ladies PG90948 58303
    • Layaa Women’s Hostel63797 00573

    Mens PG Accommodation

      Velachery
    • Stayflix PG for Men's : 96000 45088
    • DJ Men's PG Velachery : 90803 19242
    • Anna Nagar
    • Stay Inn Men's Hostel(PG) : 94454 87884
    • Brights Boys Hostel : 88387 88921
    • OMR
    • Sree Siddhi Vinayaka Mens PG : 95577 95579
    • Rudhra Men’s PG : 93636 45199
    • Porur
    • SIDDHANS Men's PG : 88259 71908
    • Jaswanth Raaj Mens PG : 89255 15888
    • Tambaram
    • Sri Sai Grn Men's PG : 81228 24076
    • Rolexx Men's PG : 80988 84848

    Top Data Analytics Job Opportunities for Freshers

    • 1. Junior Data Analyst Jobs at Startups and IT Companies
    • 2. Campus Placements and IT Service Jobs
    • 3. Internship-to-Job Programs
    • 4. Apply Through Job Portals
    • 5. Skills That Help You Get Hired

    Begin Your Data Analytics Course in T. Nagar

    Easy Coding
    8 Lakhs+ CTC
    No Work Pressure
    WFH Jobs (Remote)

    Why Data Analytics is the Ultimate Career Choice

    High Demand

    Companies prefer multi-skilled professionals can handle entire project cycles.

    Global Opportunities

    Open doors to remote and international job markets.

    High Salary

    Enjoy competitive salaries and rapid career advancement.

    Flexible Career Path

    Explore roles such as developer, architect, freelancer, or entrepreneur.

    Future-Proof Career

    Stay relevant with skills that are consistently in demand in the evolving tech landscape.

    Versatility Across Industries

    Work in various domains like e-commerce, healthcare, finance, and more.

    Career Support

    Placement Assistance

    Exclusive access to ACTE Job portal

    Mock Interview Preparation

    1 on 1 Career Mentoring Sessions

    Career Oriented Sessions

    Resume & LinkedIn Profile Building

    Get Advanced Data Analytics Certification

    You'll receive a certificate proving your industry readiness.Just complete your projects and pass the pre-placement assessment.This certification validates your skills and prepares you for real-world roles.

    Some of the most recognized certifications in the field of data analytics include:

    • Google Data Analytics Professional Certificate
    • Microsoft Certified: Data Analyst Associate (Power BI)
    • IBM Data Analyst Professional Certificate
    • SAS Certified Advanced Analytics Professional
    • Tableau Desktop Specialist Certification

    Although certification by itself does not guarantee employment, it greatly improves your chances of finding work. It adds a competitive edge to your résumé, demonstrates your commitment to professional growth, and certifies your technical skills. However, obtaining a position also requires analytical thinking, communication skills, and real-world experience.

    The timeline for certification depends on the program and your schedule. Most certifications take between 3 to 6 months to complete with consistent effort. Accelerated bootcamps may shorten this duration, while part-time learners may take longer. Prior experience with tools like SQL, Excel, or Python can reduce learning time.

    • Boosts professional credibility and marketability
    • Proves proficiency in key tools and techniques
    • Opens doors to better job roles and higher pay
    • Builds confidence in solving practical data challenges
    • Offers guided learning with real-world project experience
    • Enroll in a structured learning program or course
    • Work with real datasets to strengthen hands-on skills
    • Gain proficiency in essential tools like Python, SQL, Excel, and Tableau
    • Take practice exams and review question formats
    • Participate in online communities or study groups
    • Focus on conceptual understanding over rote learning

    Complete Your Course

    A Downloadable Certificate in PDF Format, Immediately Available to You When You Complete Your Course

    Get Certified

    A Physical Version of Your Officially Branded and Security-Marked Certificate.

    Get Certified

    Most Affordable Data Analytics Course Fees in T. Nagar

    Affordable, Quality Training for Freshers to Launch IT Careers & Land Top Placements.

    Call Course Advisor

    What Sets ACTE’s Data Analytics Course in T. Nagar Apart?

    Feature

    ACTE Technologies

    Other Institutes

    Affordable Fees

    Competitive Pricing With Flexible Payment Options.

    Higher Data Analytics Fees With Limited Payment Options.

    Industry Experts

    Well Experienced Trainer From a Relevant Field With Practical Data Analytics Training

    Theoretical Class With Limited Practical

    Updated Syllabus

    Updated and Industry-relevant Data Analytics Course Curriculum With Hands-on Learning.

    Outdated Curriculum With Limited Practical Training.

    Hands-on projects

    Real-world Data Analytics Projects With Live Case Studies and Collaboration With Companies.

    Basic Projects With Limited Real-world Application.

    Certification

    Industry-recognized Data Analytics Certifications With Global Validity.

    Basic Data Analytics Certifications With Limited Recognition.

    Placement Support

    Strong Placement Support With Tie-ups With Top Companies and Mock Interviews.

    Basic Placement Support

    Industry Partnerships

    Strong Ties With Top Tech Companies for Internships and Placements

    No Partnerships, Limited Opportunities

    Batch Size

    Small Batch Sizes for Personalized Attention.

    Large Batch Sizes With Limited Individual Focus.

    LMS Features

    Lifetime Access Course video Materials in LMS, Online Interview Practice, upload resumes in Placement Portal.

    No LMS Features or Perks.

    Training Support

    Dedicated Mentors, 24/7 Doubt Resolution, and Personalized Guidance.

    Limited Mentor Support and No After-hours Assistance.

    Data Analytics Course FAQs

    1. What qualifications are needed to become a Data Analyst?

    A foundational understanding of mathematics, statistics, and logical reasoning is necessary to work as a data analyst. It helps to have a basic understanding of database administration, Excel, and programming languages like R or Python. Although it is not usually required, a bachelor's degree in a related field is frequently desired. Above all, being open to learning and possessing a strong analytical attitude are essential.
    The need for data analytics specialists has increased across a number of industries due to the growing significance of data-driven decision-making. Analytics is being heavily invested in by businesses in a variety of industries, including healthcare, finance, retail, IT, and more, in order to obtain insights, streamline operations, and maintain competitiveness. As a result, there is a great need for qualified data analysts for positions such as data scientists, data engineers, and business analysts.

    Typical Data Analytics courses include training on:

    • Microsoft Excel
    • SQL (Structured Query Language)
    • Python or R programming
    • Data visualization tools like Tableau and Power BI
    • Data cleaning and preprocessing
    • Statistical analysis techniques
    Yes, reputable courses incorporate hands-on, industry-relevant projects to help learners apply theoretical knowledge practically. These projects enable understanding of real-life challenges and help build a strong portfolio. Examples may include sales data analysis, customer behavior prediction, and dashboard creation.
    Yes, many training providers offer career support that includes assistance with crafting a professional resume, optimizing LinkedIn profiles, conducting mock interviews, and guidance on presenting your analytics projects effectively to potential employers.
    Anyone interested in data, logical problem-solving, and analytical thinking can enroll in Data Analytics training. This includes fresh graduates, professionals seeking upskilling, career switchers, and business managers aiming to make data-driven decisions. No prior technical experience is necessary, as most programs begin with foundational concepts.
    Having a degree is not a strict requirement to become a data analyst, although it can be advantageous. Many successful analysts come from diverse, non-technical, or non-degree backgrounds. Practical skills in tools like Excel, SQL, and Python, along with the ability to derive meaningful insights from data, are what truly matter.
    Basic computer literacy, comfort working with numbers, and logical thinking are good foundations. Familiarity with spreadsheet software like Excel and an eagerness to work with data are helpful. While prior coding knowledge isn’t mandatory, being open to learning programming will benefit you during the training.
    No, you do not need any frontend or backend development knowledge for Data Analytics training. The focus is on gathering, cleaning, analyzing, and visualizing data, not on web development. The course will introduce all necessary tools and concepts gradually.

    1. What types of placement assistance are offered after completing Data Analytics training?

    The majority of training facilities offer placement support, which includes job referrals, interview coaching, resume writing assistance, and mock interviews. To help you approach the job market with confidence, some also provide access to exclusive job boards or direct connections to hiring partners.

    2. Will I receive real-time project experience to enhance my resume?

    Indeed, credible training programs in data analytics include real-world, hands-on tasks. By simulating actual industry challenges, these projects let you use your abilities to address real-world business issues, which will greatly improve your portfolio and resume.

    3. Can I pursue job opportunities in top IT companies after finishing the course?

    Definitely. With the right skills and a strong project portfolio, you can apply for positions at leading IT firms. Certifications and hands-on experience improve your chances of selection, even if you are a fresher or transitioning careers.

    4. Is placement support available for freshers without prior work experience?

    Indeed, a lot of training providers provide freshmen with specialized placement assistance. They offer interview training, help with résumé writing, and frequently connect people with entry-level positions at reputable companies.

    Yes, you will receive a certificate verifying your understanding of key data analytics concepts and technologies after successfully completing the course. This credential shows prospective employers what you can do, which can improve your resume.

    • Earning a Data Analytics certification significantly improves employability.
    • It is not an absolute guarantee of a job but adds strong value to your profile.
    • Companies across industries like tech, marketing, healthcare, and finance seek analytics professionals.
    • It is a smart and future-ready career choice in today’s data-driven world.
    A background in computer science or mathematics is beneficial but not required. Although most courses begin with basic topics and progress gradually, you can benefit from having a basic understanding of Excel, statistics, or programming languages like Python or R.
    • Completing a Data Analytics certification can lead to roles like Data Analyst, Business Analyst, or Data Scientist.
    • It enhances your confidence and technical skillset.
    • Provides a competitive edge in the job market.
    • Especially valuable in organizations focused on data-driven decision-making.
    • Covers practical and analytical skills such as data cleaning, visualization, and statistical analysis.
    • Teaches proficiency with tools like Excel, SQL, Tableau, and Python.
    • Includes hands-on experience with real-world datasets.
    • Focuses on solving business challenges using data-driven methods.

    1. Will I receive job placement assistance after completing the course?

    Yes, after completing a course, a lot of reputable training facilities offer placement assistance. This usually entails career counseling, resume writing assistance, practice interviews, and company recommendations. In order to help with placements, certain institutes also establish direct recruitment ties.
    Training fees differ due to factors like the instructor’s expertise, depth of course material, inclusion of certifications, availability of real-time projects, and extra support services. Institutes with superior facilities, strong brand reputation, or guaranteed placements may charge higher fees.
    Yes, the majority of data analytics courses are made to be affordable for novices. Many provide EMI plans, early bird discounts, or flexible payment options. Cost is a factor, but when evaluating affordability, it's also critical to consider the caliber of the training, the credentials of the instructors, and the placement assistance.
    Yes, we offer the same affordable pricing for our courses in every city. Whether you are located in a major metro or a smaller town, the quality of training and fee structure remain uniform. This ensures fair and equal access to learning without location-based price differences.

    Related Category Courses

    Informatica training acte
    Business Objects Training in Chennai

    Rated #1 Recognized as the No.1 Institute for Business Objects Read more

    Tableau Software training acte
    Tableau Training in Chennai

    Rated #1 Recoginized as the No.1 Institute for Tableau Training Read more

    pentaho training acte
    Pentaho Training in Chennai

    Rated #1 Recognized as the No.1 Institute for Pentaho Training Read more

    hadoop training acte
    Hadoop Training in Chennai

    Rated #1 Recoginized as the No.1 Institute for Hadoop Training Read more

    cognos training acte
    Cognos Training in Chennai

    Rated #1 Recoginized as the No.1 Institute for Cognos Training Read more

    java-acte
    SAS Training in Chennai

    Rated #1 Recoginized as the No.1 Institute for SAS Training Read more

    Python Course
    Python Course in Chennai

    Enroll in Our Python Training Institute in Chennai to Master Read more

    Learn (Core Python + Power Query + M Language + Data Modeling + Dax Functions + visualization) at 18,500/- Only.
    Acte Technologies WhatsApp

    Data Analytics Course for All Graduates, NON-IT, Diploma & Career Gaps — ₹18,500/- only.

    Download Brouchure