
Last updated on 14th Nov 2021| 3651
SAS offers a comprehensive suite of tools and procedures for predictive modeling, empowering data analysts and scientists to develop robust models for various applications. Through procedures like PROC REG, PROC LOGISTIC, and PROC GLM, SAS provides a versatile environment for linear and logistic regression modeling. Additionally, PROC HPFOREST and PROC HPSVM support advanced techniques such as decision trees and support vector machines, enhancing the modeling capabilities.
1. What is predictive modeling?
Ans:
Predictive modeling is the technique of forecasting or predicting future events or behaviors based on past data by applying statistical or machine learning methods. It entails utilizing a model trained on a dataset to identify patterns and correlations between variables to forecast results on fresh, untested data.
2. Define overfitting in machine learning.
Ans:
A common issue in machine learning is overfitting, which occurs when a model grows overly intricate and starts to fit the training set too closely, producing subpar results on fresh, untested data. One strategy to stop overfitting is using regularization techniques, such as L1 or L2 regularization, which add a penalty term to the loss function to discourage overly complex models.
3. Explain regularization.
Ans:
Regularization is a technique used in machine learning to prevent overfitting by adding a penalty term to the loss function that encourages simpler models. This can be implemented using techniques such as L1 or L2 regularization.
4. What is cross-validation?
Ans:
Regularization is the machine learning approach that adds a penalty term to the loss function to encourage simpler models and discourage overfitting. This can be completed by employing strategies like dropout, which randomly removes neurons during training to keep them from becoming overly specialized, or L1 or L2 regularization, which adds a penalty term to the model’s weights or biases.
5. Which machine learning algorithms are employed in predictive modeling?
Ans:
- Linear regression
- Logistic regression
- Decision trees
- Random forests
- Support vector machines
- Naive Bayes
- Neural networks
6. What is the difference between supervised and unsupervised learning?
Ans:
When an algorithm is trained on a labeled dataset—one in which the correct output is produced for every input—it is supervised learning.
- The objective is to learn a mapping between the input and output variables so that the algorithm can accurately predict the output when fresh, unseen data is supplied.
- Unsupervised learning teaches an algorithm to find patterns or structures in an unlabeled dataset. Techniques like clustering, dimensionality reduction, and anomaly detection may be used.
7. Explain the feature engineering.
Ans:
The act of choosing, modifying, and producing new features from the raw data to enhance a machine learning model’s performance is known as feature engineering. The significance of feature engineering lies in its ability to significantly influence the performance of predictive models by selecting and using relevant and high-quality features.
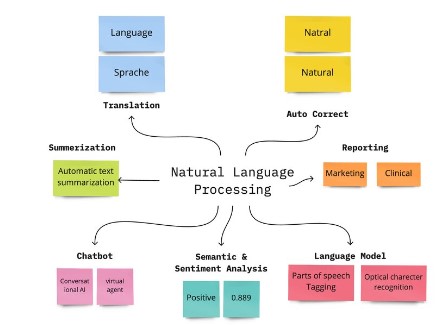
8. What is natural language processing?
Ans:
Natural language processing, or NLP, is a branch of artificial intelligence and machine learning that studies natural language communication between computers and people. Predictive modeling uses natural language processing (NLP) to interpret and analyze human language and to derive valuable information from textual data.
9. What are some typical metrics for assessing a machine learning model’s performance?
Ans:
- Accuracy: the proportion of cases that are accurately classified
- Precision is the proportion of accurate optimistic forecasts among all optimistic estimates.
- Remember: the proportion of all actual positives among accurate optimistic predictions. A weighted average of recall and precision is the F1 score.
- Plotting the actual positive rate versus the false positive rate is known as the ROC curve.
- The particular challenge and the trade-offs between accuracy, recall, and false positives or negatives determine which metric is best.
10. How does predictive modeling handle missing data?
Ans:
Predictive modeling frequently faces the issue of missing data, and various approaches deal with it. Eliminating the instances where data is absent is one strategy that may work well if little data is missing. A different strategy is imputing the missing data using regression, mean, or median imputation methods.
11. What is the difference between bias and variance?
Ans:
| Feature | Bias | Variance | |
| Definition | Error introduced by approximating a real-world problem, making assumptions, or using a simplified model. It leads to consistently inaccurate predictions. | Error introduced by the model’s sensitivity to the fluctuations or noise in the training data. It leads to high variability in predictions. | |
| Underlying Issue | High bias often results from an overly simple model that doesn’t capture the complexity of the underlying data. | High variance is associated with a model that is too complex and fits the training data too closely, capturing noise along with the underlying patterns. | |
| Impact on Performance | High bias can lead to systematic errors, causing the model to consistently underperform on both training and test data. | High variance can result in the model performing well on training data but poorly on new, unseen data, indicating overfitting. | |
| Trade-off | There is a trade-off between bias and variance. Increasing model complexity tends to reduce bias but increase variance, and vice versa. Finding the right balance is crucial. | Adjusting the model complexity involves finding the optimal point that minimizes both bias and variance, striking a balance for better generalization. | |
| Remedies | To reduce bias, one can use a more complex model, increase the number of features, or train the model for a longer time. | To reduce variance, one can use a simpler model, limit the number of features, increase the amount of training data, or use regularization techniques. |
12. What is the difference between a decision tree and a random forest?
Ans:
- A machine learning technique known as a decision tree builds a model of decisions and their potential outcomes in the form of a tree.
- An ensemble technique called a random forest combines several decision trees to increase each one’s robustness and accuracy.
- Compared to decision trees, random forests are less likely to overfit and can handle various input data, such as binary, continuous, and categorical information.
13. What is gradient descent?
Ans:
An optimization technique called gradient descent is frequently applied in machine learning to reduce a model’s error or loss function. The approach operates by iteratively changing the model’s parameters in the direction of the gradient of the loss function’s steepest descent.
14. What is deep learning, and how is it different from conventional methods for machine learning?
Ans:
- Neural networks having numerous layers are used in deep learning, a subset of machine learning, to learn complicated data representations. While deep learning algorithms can automatically learn features from raw data, traditional machine learning algorithms usually rely on characteristics that have been explicitly created.
- Deep learning is beneficial for tasks involving complicated data, like natural language processing, audio recognition, and image recognition. By employing numerous layers of non-linear transformations, deep neural networks can identify complex patterns and relationships.
15. How does machine learning handle data that needs to be balanced?
Ans:
In machine learning, handling imbalanced data is a typical issue, mainly when the minority class is of interest. The following are standard methods for dealing with unbalanced data: creating synthetic samples, oversampling, and undersampling. Reducing the majority class by choosing a subset at random is known as undersampling, and repeating the minority class is known as oversampling, which is done to balance the dataset.
16. How does regularization function in neural networks?
Ans:
Regularization is a crucial approach to avoid overfitting in neural networks. A penalty term is added to the loss function to encourage the network to learn simpler models. This is how it operates. L1 and L2 regularization are two of the various kinds of regularization procedures. When using L1 regularization, a penalty term is added proportionately to the weights’ absolute value, whereas when using L2 regularization, a punishment term is added proportionately to the weights’ square.
17. In predictive modeling, how are categorical variables handled?
Ans:
- Variables like color or type with a finite set of possible values or categories are known as categorical variables.
- One-hot encoding is a technique for managing categorical variables in predictive modeling; it generates a binary variable for every category in the categorical variable.
- Target encoding is another method that substitutes each category’s mean target value.
18. Ensemble learning: What is it?
Ans:
In machine learning, ensemble learning is a technique where several models are trained on the same dataset, and their combined outputs are used to get a final prediction. Model performance can be enhanced via ensemble learning by decreasing overfitting, raising accuracy, and producing more reliable predictions.
19. What are the uses for the k-means clustering algorithm?
Ans:
An unsupervised machine learning technique called k-means clustering group-related data points into k clusters. For it to function, k centroids are randomly assigned to each data point. The centroids are then repeatedly reassigned to the means of the points in each cluster. When the centroids no longer move appreciably, the algorithm ends. Image segmentation, customer segmentation, and anomaly detection are used for k-means clustering.
20. What is the difference between a support vector machine and a neural network?
Ans:
- A supervised machine learning approach that can be applied to regression and classification problems is the support vector machine (SVM). The process involves identifying the hyperplane that divides the data into the most distinct classes.
- In contrast, a neural network is a collection of algorithms that mimics the architecture of the human brain. Many layers of interconnected nodes or neurons make up this system, frequently utilized for deep learning applications, including speech recognition, picture recognition, and natural language processing.
21. What is the difference between a clustering algorithm and a classification algorithm?
Ans:
- While both clustering and classification are methods in machine learning, their applications are distinct.
- Without knowing the labels beforehand, clustering is an unsupervised learning technique that groups comparable data points into clusters.
- In contrast, classification is a supervised learning method that uses previously labeled data to forecast a data point’s label.
22. Time-series analysis: what is it?
Ans:
Predictive modeling uses time-series analysis as a tool to examine data that is gathered over time and is called a time series. In addition to forecasting future values, time-series analysis can spot trends, seasonality, and other patterns in the data. Numerous disciplines use time-series analysis, including finance, economics, and engineering.
23. Explain the confusion matrix.
Ans:
A table used to assess a classification model’s performance is called a confusion matrix. Together with additional measures like precision, recall, and F1 score, it displays the number of accurate and inaccurate predictions the model made for each class. The confusion matrix is convenient when working with imbalanced datasets because it shows how well the model predicts the minority class.
24. What is the difference between a parametric model from a non-parametric model?
Ans:
- Like linear regression, a parametric model makes assumptions about the data’s underlying distribution.
- Non-parametric models, such as k-nearest neighbors or decision trees, on the other hand, do not assume anything about the underlying distribution of the data.
- Although parametric models can be trained more quickly and efficiently than non-parametric models, they might need to be more adaptable.
- Conversely, non-parametric models are more adaptable but need more data and processing power.
25. What distinguishes a factor analysis from a principal component analysis?
Ans:
- While both factor and principal component analysis (PCA) are methods used in dimensionality reduction, their objectives are distinct.
- Using PCA decreases the dataset’s dimensionality while maintaining a high degree of variance.
- On the other hand, latent variables that account for the observed variance in the data are found using factor analysis.
26. What is the dimensionality curse?
Ans:
The difficulties and restrictions of machine learning models when working with high-dimensional data are called the “curse of dimensionality.” Finding significant patterns and associations becomes more challenging when the volume of the feature space grows exponentially with the number of characteristics or dimensions in the data. this can affect machine learning models in several ways, including making it harder to identify significant features.
27. How is transfer learning applied in deep learning, and what does it entail?
Ans:
Transfer learning is a machine learning technique in which an existing model is utilized as the basis for a new assignment rather than training a new model from scratch. Refining the model on the new task can tailor the pre-trained model to the particular problem at hand. The pre-trained model has already learned to extract valuable features from the data.
28. Describe the batch normalization concept.
Ans:
In deep learning, batch normalization is a method used to enhance model stability and performance during training. The technique entails normalizing the inputs to a neural network so that their mean and variance are zero. This can stop the network from overfitting and aid in gradient stabilization during backpropagation.
29. What separates bagging from boosting?
Ans:
- Two ensemble learning strategies utilized to raise model performance are bagging and boosting.
- By training several models on various subsets of the training data, bagging entails aggregating the predictions of those models via average or majority vote.
- On the contrary, boosting entails training models one after the other on the same data set and modifying the weights of samples that are incorrectly classified to enhance the model’s functionality.
30. What sets a feedforward neural network apart from a recurrent neural network?
Ans:
- A neural network with only one direction of information flow—from input to output—is called a feedforward neural network (FFNN). Every neuron in one layer of this kind of network is connected to every other layer’s neuron.
- On the other hand, recurrent neural networks (RNNs) are a particular kind of neural network in which the output of one step is fed into the current stage. Because of this, the network can retain information over time, which makes it appropriate for tasks like text recognition, machine translation, and audio recognition.
31. Describe what adversarial training is.
Ans:
A model is trained using adversarial examples and regular training data in negative training. Minor perturbations are added to the input data to create hostile instances to maximize the model’s prediction inaccuracy. The model becomes more resilient against malicious attacks through training in both standard and aggressive instances.
32. What are typical metrics for assessing a predictive model’s effectiveness?
Ans:
A few standard metrics are used to assess a predictive model’s performance. The first is accuracy, which gauges how frequently the model forecasts the result accurately. Another is precision, which measures how often the model gets an outcome right when it makes a prediction. Lastly, recall quantifies the frequency with which the model correctly predicts an event in the presence of the actual outcome.
33. What’s the F1 point total?
Ans:
The accuracy of a predictive model is gauged by its F1 score. It is computed as the precision and recall of the model’s harmonic mean. The F1 score determines the most appropriate for a specific task when comparing various models.
34. What separates a generative model from a discriminative model?
Ans:
- A generative machine learning model acquires knowledge of the joint probability distribution between the labels and the input data.
- A discriminative model, on the other hand, uses the input data to learn the conditional probability distribution of the labels.
- While discriminative models are frequently employed for classification and regression tasks, generative models can be utilized for functions like image, text, and speech synthesis.
35. What distinguishes a recurrent neural network from a convolutional neural network?
Ans:
- One kind of neural network that works exceptionally well for tasks involving the processing of images and videos is the convolutional neural network (CNN). CNNs employ a sequence of pooling layers to lower the dimensionality of the data and convolutional layers to identify spatial patterns in the input data.
- The way CNNs and RNNs process input data is the primary distinction between them. RNNs employ a recurrent loop to process sequential data, while CNNs use convolutions and pooling processes to extract features from the input data.
36. What are receiver operating characteristics (ROC) and area under curve (AUC)?
Ans:
The accuracy with which a predictive model can distinguish between two classes is measured by its AUC. The better the model differentiates between the two classes, the higher the AUC. The AUC is represented graphically by ROC. Plotting the false positive rate against the actual positive rate yields the ROC curve.
37. How should outliers be handled the best?
Ans:
The optimal approach to handle outliers will differ based on the particular dataset and the objectives of the predictive modeling. Hence, there is yet to be a universally applicable solution to this problem. To deal with outliers, however, some typical approaches include marking them as such, deleting them entirely from the dataset, or altering them to make them more consistent with the rest of the data.
38. Describe PFCG_Time_Dependency in further detail.
Ans:
Time Dependency of PFCG is a report used for the client ace assessment. It also eliminates the deleted profiles from the customer’s Ace record. To complete this report, Exchange codes for PFUD can also be used.
39. What is the distinction between factor analysis and PCA?
Ans:
- The segments are calculated as linear blends of the initial components in Principal Components Analysis. The initial factors in a factor analysis are described as simple blends of the elements.
- Factor analysis is used to understand the building blocks of the information, whereas Primary Components Analysis is used as a variable decrease method.
- The goal of principal components analysis is to explain as much of the overall variation in the factors as is reasonable. Determining the covariances or correlations between the components is the goal of factor analysis.
40. What is predictive modeling in SAS?
Ans:
Predictive modeling in SAS (Statistical Analysis System) involves using statistical and machine learning techniques to build models that make predictions or classifications based on historical data. SAS is a software suite for advanced analytics, business intelligence, and data management.
41. Explain the critical steps in building a predictive model using SAS.
Ans:
Key steps include data preparation, variable selection, model building, validation, and deployment. SAS provides tools like SAS Enterprise Miner to streamline these processes.

Get On-Demand Software Testing Training for Beginners to Advance Your Career
- Instructor-led Sessions
- Real-life Case Studies
- Assignments
42. What is logistic regression, and how is it used in predictive modeling?
Ans:
Logistic regression is the statistical method used to model the probability of a binary outcome. In SAS, PROC LOGISTIC is often used to perform logistic regression for predicting categorical outcomes.
43. What divides a decision tree from a random forest?
Ans:
A group of decision trees, each trained on a different subset of the data, is called a random forest. A model that combines several decision trees—each of which only considers a small portion of the data—becomes less prone to overfit and is more resilient than one decision tree alone.
44. How can you handle imbalanced data in SAS when building a predictive model?
Ans:
- Utilize oversampling techniques in PROC LOGISTIC for the minority class.
- Employ the CLASS and WEIGHT statements to balance class representation.
- Ensure fair treatment of both majority and minority classes in the model.
- Strategically use options and statements to mitigate imbalanced data impact.
- Improve the model’s ability to capture patterns in the minority class.
45. What is the role of the ROC curve in assessing model performance, and how can it be generated in SAS?
Ans:
- Evaluate a model’s ability to discriminate between classes.
- Generate ROC curves using SAS procedures like PROC LOGISTIC.
- Illustrate the trade-off between sensitivity and specificity.
- Provide insights into performance across various classification thresholds.
- Derive the C statistic (AUC) from the ROC curve to summarize model performance.
46. What defines traditional statistical modeling from predictive modeling?
Ans:
Conventional statistical modeling generally uses regression analysis or other statistical approaches to detect associations between variables. Conversely, predictive modeling aims to foresee or predict such relationships.
47. Describe the purpose of the SAS Enterprise Miner.
Ans:
SAS Enterprise Miner is a data mining tool that facilitates the development of predictive models. It offers a graphical interface for data exploration, variable selection, and model building, making predictive modeling more accessible.
48. What is the importance of variable selection in predictive modeling?
Ans:
Variable selection helps identify the most relevant features for building an accurate predictive model. SAS provides procedures like PROC VARSELECT to automate the inconsistent selection process.
49. Explain the concept of model validation in SAS predictive modeling.
Ans:
Model validation ensures the predictive model performs well on new, unseen data. Techniques like cross-validation and splitting the dataset into training and validation sets are standard in SAS to assess model generalization and accuracy.
50. Explain the purpose of the SAS Macro Language in the context of predictive modeling.
Ans:
- In workflows involving predictive modeling, automate repetitive tasks.
- Turn on parameterization to give you more freedom when creating models.
- Reduce the complexity of intricate processes like hyperparameter tuning and cross-validation.
- Improve the predictability and scalability of the models.
- increased ability to adjust to modifications in the modeling procedure.
51. What is the purpose of the LIFETEST procedure in SAS?
Ans:
- carries out SAS survival analysis.
- studies data on the time to event.
- applied frequently in reliability engineering and healthcare.
- evaluates and models the survival function across time.
52. What is SAS Enterprise Miner, and how is it used in predictive modeling?
Ans:
SAS Enterprise Miner is a data mining tool that assists in building predictive models. It provides a GUI for tasks like data exploration, variable selection, and model building, making predictive modeling more efficient.
53. How does SAS handle multicollinearity in predictive modeling?
Ans:
SAS provides procedures like PROC REG and PROC GLMSELECT with options to detect and address multicollinearity. Techniques include variance inflation factor (VIF) analysis and automated variable selection methods.
54. Explain the steps involved in data preprocessing for predictive modeling in SAS.
Ans:
Handling Missing Values:
- Identify and handle missing data using techniques like imputation.
- Utilize PROC SQL or DATA steps for data manipulation.
Encoding Categorical Variables:
- Convert categorical variables into a format suitable for modeling.
- Use techniques like one-hot encoding or label encoding.
Scaling Features:
- Standardize variables to bring them to a common scale.
- Apply PROC STANDARD for feature scaling in SAS.
55. How can you assess the performance of a predictive model in SAS?
Ans:
Model performance can be assessed using various statistics like ROC curves, AUC, and confusion matrices. SAS provides procedures like PROC LOGISTIC for classification models and PROC REG for regression models, offering model performance metrics.
56. Explain the concept of cross-validation and its importance in SAS predictive modeling.
Ans:
Cross-validation involves dividing the dataset into more subsets for training and testing. SAS procedures like PROC GLMSELECT support options for K-fold cross-validation, ensuring robust model assessment and reducing the risk of overfitting.
57. What is the significance of the SCORE statement in SAS predictive modeling?
Ans:
- Application of Predictive Model: The SCORE statement in SAS is crucial for applying a predictive model to new, unseen data.
- Model Deployment: It facilitates the deployment of the trained model for making predictions on observations that were not part of the model’s training dataset.
- Real-world Predictions: Enables the use of the predictive model in real-world scenarios, allowing organizations to leverage the model’s insights on new data.
- Scoring Unseen Observations: The SCORE statement is used to score or evaluate the performance of the model on data that was not used during the model’s training phase.
58. How can the output of a variable importance analysis be interpreted in SAS?
Ans:
Variable importance analysis, available in procedures like PROC HPFOREST, ranks variables based on their contribution to model accuracy. Higher-ranking variables are more influential in making predictions.
59. Explain the SAS Enterprise Guide in the context of predictive modeling.
Ans:
SAS Enterprise Guide is an integrated interface for SAS analytics. It supports data exploration, statistical analysis, and predictive modeling through a user-friendly environment.
60. What is the SAS HPFOREST procedure?
Ans:
PROC HPFOREST is used for Random Forest modeling in SAS. It utilizes parallel processing for faster computation and builds multiple decision trees to enhance predictive accuracy.
61. What are the advantages of using SAS Viya in predictive modeling tasks?
Ans:
- Distributed Computing: By utilizing parallel processing and optimizing computational resources, distributed computing—which SAS Viya makes possible—speeds up the training of predictive models on big datasets.
- Scalability: The platform’s scalable design allows it to handle a wide range of workloads and big datasets, enabling the effective completion of predictive modeling tasks with any amount of data.
- Collaborative Environment: Data scientists, analysts, and other stakeholders can work together more easily thanks to the platform’s collaborative environment.
62. How can LASSO and RIDGE regression be implemented using SAS procedures?
Ans:
- Regularization is vital for preventing overfitting by penalizing complex models. SAS procedures like PROC GLMSELECT support LASSO (Least Absolute Shrinkage and Selection Operator) and RIDGE regression.
- LASSO introduces a penalty term based on the absolute values of coefficients, promoting sparse solutions. In SAS, this is achieved by specifying the LASSO option.
- RIDGE regression introduces a penalty term based on the square of coefficients, preventing overfitting. In SAS, the RIDGE option is used to implement this technique.
63. Explain bagging in SAS and how it improves predictive model performance.
Ans:
Bagging (Bootstrap Aggregating) in SAS, implemented through procedures like PROC HPSPLIT, builds multiple models on bootstrap samples.
It reduces variance, enhances model stability, and improves overall predictive performance.
64. What is the SAS SURVEYLOGISTIC procedure, and in what scenarios would you use it?
Ans:
The SAS SURVEYLOGISTIC procedure is designed to analyze complex survey data with stratified sampling and clustering. It accounts for the survey design features and provides unbiased parameter estimates, making it suitable for epidemiological studies and population-based research.

Enroll in Software Testing Certification Course From Real-Time Experts
Weekday / Weekend BatchesSee Batch Details65. What are some techniques available in SAS for handling collinearity?
Ans:
PROC REG in SAS provides options like VIF, which calculates variance inflation factors, aiding in identifying and addressing multicollinearity. Techniques such as ridge regression, available through the RIDGE statement, help mitigate multicollinearity by introducing a penalty term to the regression coefficients.
66. How can the performance of different predictive models in SAS be assessed and compared?
Ans:
- PROC COMPARE: To compare datasets or model outputs, use PROC COMPARE. Ensuring accuracy and consistency, it assists in identifying differences between two datasets or model results.
- PROC MODEL: is a flexible process that enables in-depth model evaluation. It offers choices for parameter estimation, hypothesis testing, and diagnostic procedures in addition to supporting a number of statistical models.
- Procedure GLMSELECT: is especially helpful when comparing various models. It assists you in selecting the most appropriate model from a group of candidates by performing model selection based on standards such as AIC, BIC, or cross-validation.
67. How can we optimize hyperparameters in a predictive model using SAS?
Ans:
SAS provides techniques like grid search and random search for hyperparameter optimization. PROC HPGRID and PROC HPSEARCH are commonly used to explore combinations of hyperparameter values and find the optimal settings for predictive models.
68. What is the SAS TIMESERIES procedure?
Ans:
SAS TIMESERIES procedure is designed for analyzing and forecasting time series data. It supports decomposition, smoothing, and autoregressive integrated moving average (ARIMA) modeling to capture patterns and trends in time-dependent data.
69. What is the SAS ETS procedure?
Ans:
The SAS ETS (Time Series Analysis) procedure is used for advanced time series modeling. It provides functionalities like forecasting, spectral analysis, and decomposition, allowing analysts to explore and model intricate patterns within time series data for more accurate predictions.
70. How does SAS support handling time-dependent covariates in survival analysis?
Ans:
LIFEREG SAS Method:
- Facilitates the analysis of time-dependent covariates in survival models.
- permits the addition of variables whose values vary over time.
- increases the covariate representation’s realism in survival modeling.
71. What are some advantages and limitations of using SAS for predictive modeling ?
Ans:
Advantages of Using SAS for Predictive Modeling:
- Comprehensive Statistical Procedures
- Robust Data Manipulation Capabilities
- Extensive Documentation
Limitations of Using SAS for Predictive Modeling:
- Steeper Learning Curve
- Potential Higher Costs
- Consideration in Enterprise Settings
72. What is the SAS DISCRIM procedure?
Ans:
PROC DISCRIM in SAS is used for discriminant analysis, a technique for classifying observations into predefined groups. It is suitable when the goal is to maximize the separation between groups based on predictor variables, making it valuable in classification problems with multiple groups.
73. What is the SAS PHREG procedure?
Ans:
PROC PHREG is used for proportional hazard regression in SAS, mainly for survival analysis. It models the hazard function, providing insights into how different variables impact the time of an event, making it valuable in medical and reliability studies.
74. Explain the SAS FCMP procedure in predictive modeling.
Ans:
PROC FCMP allows users to define and register custom functions in the SAS environment. It is beneficial for creating custom algorithms or mathematical functions that can be incorporated into predictive models, providing flexibility and customization in the modeling process.
75. Explain stratified sampling.
Ans:
Stratified sampling involves dividing the population into subgroups and sampling from each subgroup independently. In SAS, the STRATA statement in various procedures, such as PROC SURVEYSELECT, allows analysts to perform stratified sampling better to represent each subgroup in the predictive modeling process.
76. What is the SAS EMWSURV procedure?
Ans:
The EMWSURV procedure in SAS is used for weighted survival analysis. It’s beneficial when dealing with complex survey data where observations have different weights, ensuring that the survival analysis accounts for the survey design features.
77. How does SAS support the integration of external data sources?
Ans:
PROC HADOOP:
- SAS offers PROC HADOOP for connecting and interacting with Hadoop clusters.
- Enables seamless integration between SAS and Hadoop environments.
- Analysts can leverage data stored in Hadoop for predictive modeling tasks.
78. How can we handle rare events in logistic regression models using SAS?
Ans:
EVENT=:
- SAS provides the EVENT= option to specify the rare event in logistic regression.
- Helps address imbalanced datasets by identifying the outcome of interest.
EVENTPROB=:
- The EVENTPROB= option allows users to set a probability threshold for defining rare events.
- Adjusting these options is crucial for logistic regression models with imbalanced datasets.
79. Explain the SAS REPORT procedure in the context of predictive modeling.
Ans:
The REPORT procedure in SAS is primarily used for creating customized reports summarizing model output. It aids in model interpretation by presenting key statistics, parameter estimates, and performance metrics in a comprehensive and visually appealing format, facilitating communication of results to stakeholders.
80. What is the SAS MCMC procedure?
Ans:
PROC MCMC is used for Markov Chain Monte Carlo (MCMC) simulation in SAS, supporting Bayesian analysis. It allows analysts to estimate posterior distributions of model parameters, making it useful for Bayesian predictive modeling when prior information about parameters is available.
81. Explain model calibration and how we can assess and improve the calibration of a predictive model in SAS.
Ans:
Model calibration ensures that predicted probabilities align with the observed outcomes. In SAS, PROC LOGISTIC provides the HOSLEM option, allowing analysts to assess calibration using the Hosmer-Lemeshow goodness-of-fit test. Calibration plots and recalibration methods can be employed to enhance model calibration.
82. What is the SAS STAR procedure, and when would you use it in predictive modeling?
Ans:
The STAR procedure in SAS is used for structural time series modeling. It is beneficial when dealing with complex time series data that exhibits structural changes, allowing analysts to capture and model these changes effectively.
83. What is the SAS SGPLOT procedure?
Ans:
- Purpose: Used for creating a variety of statistical graphics and plots.
- Applications: Visualizing model diagnostics, variable distributions, and calibration plots. Aids in interpretation and communication of predictive model results.
84. How does SAS handle the issue of data leakage in predictive modeling?
Ans:
Data Partitioning:
- SAS emphasizes proper data partitioning.
- Separates datasets for training and validation purposes.
Validation and Test Sets:
- SAS ensures that information from validation or test sets does not inadvertently influence model training.
- Keeps the validation/test data separate during model development.
Preventing Data Leakage:
- Prevention of data leakage helps ensure realistic assessments of model performance on unseen data.
- Contributes to the reliability of predictive modeling outcomes.
85. How can highly skewed target variables be handled in SAS predictive modeling?
Ans:
SAS provides transformation techniques, such as log or Box-Cox transformations, using PROC TRANSREG to address skewness. Alternatively, PROC HPGENSELECT allows for modeling with distributional assumptions, accommodating non-normally distributed targets.
86. Explain the SAS CLUSTER procedure and when you would use it in predictive modeling.
Ans:
PROC CLUSTER in SAS is used for hierarchical or k-means clustering analysis. It is beneficial when exploring patterns or grouping similar observations based on specific characteristics, which can be helpful in feature engineering or segmentation for predictive modeling.
87. Explain the use of the SAS FACTOR procedure in predictive modeling.
Ans:
The FACTOR procedure in SAS is used for factor analysis, which helps identify latent variables or factors underlying observed variables. Factor analysis is applied when relationships among variables cannot be directly observed, making it useful for dimensionality reduction and uncovering underlying patterns in the data.
88. What is the SAS GENMOD procedure?
Ans:
PROC GENMOD in SAS is used for fitting generalized linear models (GLMs). It is versatile, accommodating various distributional assumptions and link functions, making it suitable for modeling outcomes beyond the normal distribution, such as binary, Poisson, or multinomial outcomes.
89. How does SAS handle imputing missing values in predictive modeling?
Ans:
- Purpose: SAS provides PROC MI specifically for multiple imputation.
- Techniques: Utilizes methods like Markov Chain Monte Carlo (MCMC) for imputing missing values.
- Mean Imputation: SAS allows imputing missing values by replacing them with the mean of observed values.
90. Explain the SAS FREQ procedure in predictive modeling.
Ans:
The FREQ procedure in SAS is used for frequency analysis and cross-tabulations. It helps understand categorical variables’ distribution, assess balance, generate tables and provide in providential for feature selection and model interpretation in predictive modeling tasks.