Best Power BI Course in OMR ⭐ with 100% Job Assurance | Updated 2025

Power BI Course for All Graduates, NON-IT, Diploma & Career Gaps — ₹30,680/- only.

Download Brouchure
Join Our 100% Job Guaranteed

Power BI Course in OMR

  • Join the Best Power BI Training Institute in OMR to Gain Data Visualization and BI Skills.
  • Our Power BI Training in OMR Covers Data Modeling and DAX Functions.
  • Work on Real-Time Projects Under the Direction of Experts to Get Practical Experience.
  • Choose Flexible Learning Options: Weekday, Weekend or Fast-Track Batches.
  • Earn a Recognized Power BI Certification in OMR with 100% Placement Support.
  • Get Personalized Help with Portfolio Building, Interview Pre and Advancing Career in BI.

WANT IT JOB

Become a Power BI Developer in 3 Months

Freshers Salary

3 LPA

To

8 LPA

Quality Training With Affordable Fees in OMR!
INR ₹33000
INR ₹30680

9653+

(Placed)
Freshers To IT

4387+

(Placed)
NON-IT To IT

7324+

(Placed)
Career Gap

3768+

(Placed)
Less Then 60%

Our Hiring Partners

Overview of Power BI Course

Our Power BI Course in OMR is designed for freshers want to learn data analysis and visualization easily. The Power BI Training in OMR covers basics like data modeling, creating reports and using DAX formulas. You will get hands-on practice with real projects to build your skills. After completing the course, you will receive a Power BI Certification to show your expertise. We also offer Power BI Placement support to help you start your career. Join us to learn Power BI step-by-step and boost your job opportunities.

What You'll Learn From Power BI Training

Get started with the essentials of data analysis and visualization in our Power BI Course in OMR, mastering the core tools and interface.

Understand how to connect, clean and transform data using Power Query to prepare it for insightful reporting.

Learn to build data models and write DAX formulas to create powerful calculations and dynamic reports.

Create interactive dashboards and visualizations that help communicate business insights effectively.

Work on real-time projects that mirror actual settings and problems to obtain practical experience.

Earn a recognized Power BI Certification to enhance your profile and receive dedicated support for job placement.

Additional Info

Course Highlights

  • Begin your Power BI journey with comprehensive training on data modeling, DAX, report creation, Power Query and dashboard development.
  • Receive personalized job support and placement assistance with top companies seeking skilled Power BI professionals.
  • Join thousands of students have gained valuable skills and secured jobs through our wide network of 350+ hiring partners.
  • Learn from industry experts with over 10 years of experience in data analytics and business intelligence.
  • Experience beginner-friendly lessons, hands-on real-world projects and full career guidance throughout your learning path.
  • Enjoy flexible batch timings, affordable fees and 100% placement support ideal for freshers and those switching careers.

Benefits You Gain from a Power BI Training in OMR

  • Easy Data Visualization – Power BI helps you turn complex data into clear and colorful charts and graphs. This makes it simple to understand trends and patterns quickly. You don’t need to be an expert to create professional-looking reports. It helps everyone make better decisions using visuals.
  • Connects Multiple Data Sources – Multiple information sources, including Excel, databases and internet services, can be connected by Power BI. This means you can see all your data in one place without switching apps. It saves time and reduces errors. You get complete view of your business easily.
  • Real-Time Data Updates – With Power BI reports and dashboards update automatically with the latest data. This enables to remain informed and respond swiftly to developments. You don’t have to manually refresh your reports. Real time data means better faster decisions.
  • User-Friendly Interface – Power BI is made to be straightforward and simple to use, even for beginners. Without knowing any code, you can create reports with the drag-and-drop feature. Training is brief, allowing you to get started on projects immediately. It speeds up your learning and skill development.
  • Strong Sharing and Collaboration – Power BI makes it simple to share dashboards and results with your team or clients. You can control sees what information. This improves teamwork and helps everyone stay on the same page. Collaboration becomes smooth and secure.

Popular Tools Taught in Power BI Course

  • Power Query – Power Query is used to connect, clean and prepare your data before analysis. It helps you import data from different sources and fix any errors easily. You don’t need to write complicated code it has simple options to transform your data. This makes sure your data is ready and accurate for reports.
  • Power Pivot – Power Pivot helps to create data models by connecting different tables and building relationships. It lets you work with large amounts of data quickly and easily. You can use formulas to create new calculations and summaries. This tool helps to organize your data for better analysis.
  • DAX (Data Analysis Expressions) – Power BI uses DAX, a formula language, to conduct data analysis and computations. It helps to create powerful metrics like totals, averages and percentages. Even if you’re new, you can learn basic DAX to make your reports smarter. Its essential for adding advanced insights to data.
  • Power BI Desktop – Power BI Desktop is the main application where you build reports and dashboards. It lets you design visuals, connect data and create interactive reports all in one place. Its easy to use and allows to see your data come alive. This tool is the heart of Power BI work.
  • Power BI Service – You can publish and distribute your reports online with Power BI Service. It helps you collaborate with others by giving access to your dashboards anywhere. You can schedule automatic data refreshes and keep your reports up-to-date. This makes sharing insights simple and secure.

Top Frameworks Every Power BI Developer Should Know

  • Star Schema – The Star Schema is a way to organize your data into fact and dimension tables. Fact tables hold measurable data, while dimension tables store details such dates or categories. This setup makes it easier to create fast and efficient reports. Power BI works best with this clear, simple structure.
  • Snowflake Schema – The Snowflake Schema is similar to Star Schema but with more detailed dimension tables that are broken down further. It helps to reduce data duplication and saves storage space. Although a bit more complex it allows for better organization when dealing with the large datasets. Power BI can handle snowflake models for advanced data analysis.
  • Data Modeling Framework – Data modeling is about creating relationships between different tables to show how data connects. This framework helps to build a strong foundation so reports reflect accurate insights. Understanding to model data well is key to using Power BI effectively. It make sure reports are fast and reliable.
  • ETL Framework (Extract, Transform, Load) – ETL is process of gathering data from various sources, cleaning and transforming it and then loading it into the Power BI. This framework ensures your data is accurate and ready for analysis. Using ETL techniques helps to handle messy data and create meaningful reports. Power Query in Power BI is great tool for ETL.
  • KPI Framework – The KPI (Key Performance Indicator) framework helps define and track important business goals using Power BI. It focuses on measuring success with clear metrics and visual indicators. This framework helps decision makers quickly understand if targets are being met. Power BI’s visuals make it easy to display KPIs effectively.

Essential Skills You’ll Learn in a Power BI Course in OMR

  • Data Visualization – In Power BI, you’ll learn to create clear and engaging charts, graphs and dashboards. This skill helps to turn raw data into easy-to-understand visuals. Good visualization makes it simpler to spot trends and share insights with others. Its important skill for effective communication in any business.
  • Data Modeling – You will gain the abilities to organize and structure data by building relationships between tables. This skill helps to combine different data sources into one model that’s easy to analyze. Strong data modeling ensures your reports are accurate and fast. It forms the backbone of any Power BI project.
  • Using DAX Formulas – DAX is a special formula language in Power BI that lets to perform calculations and analyze data deeply. Learning DAX helps to create custom metrics like totals, averages and growth rates. This skill gives your reports more power and flexibility. Even beginners can start with simple DAX to improve their reports.
  • Data Transformation – Power BI teaches you how to clean, shape and prepare data before analysis using Power Query. This skill is important because data often comes messy or incomplete. Knowing to fix and transform data makes your reports reliable. It saves time and ensures the insights you get are trustworthy.
  • Report Sharing and Collaboration – You’ll learn to publish and share reports securely with your team or clients using Power BI Service. This skill allows to easy access to insights anywhere, anytime. It also helps improve teamwork by keeping everyone updated. Sharing and collaboration are key to making data driven decisions together.

Key Roles and Responsibilities of Power BI

  • Power BI Developer – A Power BI Developer designs and creates reports and dashboards to help businesses understand their data. They connect different data sources, build data models and write DAX formulas for calculations. Their job is to make data easy to explore and interpret. Developers ensure reports are accurate, interactive and meet user needs.
  • Data Analyst – A Data Analyst uses Power BI to collect, clean and analyze data to find trends and insights. They prepare data for reporting and create visualizations that support business decisions. Their role includes identifying patterns and helping teams understand what the data means. They play a key part in improving company strategies.
  • BI Consultant – A BI Consultant advises organizations on how to use Power BI to solve business problems. They help design data solutions, improve reporting processes and train staff on using Power BI effectively. Consultants work closely with different teams to understand requirements and deliver the best insights. Their goal is to enhance data driven decision making.
  • Data Engineer – Data Engineers manage the flow and storage of data that Power BI uses for reporting. To extract, convert and load (ETL) data from various sources, they construct pipelines. Their work ensures that data is clean, reliable and ready for analysis. They focus on creating efficient systems so Power BI reports run smoothly.
  • Reporting Analyst – Reporting Analysts focus on creating and maintaining regular business reports using Power BI. They monitor data accuracy, update dashboards and provide insights to management. Their job is to ensure reports reflect the latest data and support business goals. They help teams track performance and make informed decisions.

Why Power BI Is the Smart Choice for Freshers

  • High Demand for Skills – Many companies need professionals can analyze and visualize data, so Power BI experts are in great demand. This means freshers with Power BI training have many job opportunities. Learning these skills opens doors to different industries. Its a smart way to start your career.
  • Easy to Learn for Beginners – Power BI is user-friendly and designed so that beginners can learn quickly. You don’t need to be coding expert to create reports and dashboards. The training helps freshers build skills step-by-step with hands-on practice. This makes it easier to gain confidence and work on real projects.
  • Boosts Career Growth – Power BI skills are valuable and can lead to higher-paying jobs and promotions. Companies want employees can turn data into useful insights. By learning Power BI, freshers increase their chances of career growth. Its a skill that keeps you competitive in the job market.
  • Work in Various Industries – Power BI is used in many fields like finance, healthcare, retail and more. This means freshers trained in Power BI can work in different sectors. It allows the flexibility to select a professional path based on your interests. Gaining knowledge with Power BI opens up a variety of career alternatives.
  • Supports Data-Driven Decision Making – With Power BI training, freshers learn to help businesses make better decisions using data. This skill is highly valued because companies want to stay competitive. Being able to provide clear insights makes you an important part of any team. Its a role that brings real impact to businesses.

Landing Remote Jobs with Power BI Skills

  • Work From Anywhere – Power BI is cloud based tool, so you can create and share reports from any location. This flexibility allows to work remotely without being tied to an office. Many companies look for professionals can handle data tasks online. Having Power BI skills makes a good fit for remote work.
  • Easy Collaboration – With Power BI Service, you can share dashboards and reports easily with team members and clients. This makes remote teamwork smooth and efficient. Being able to communicate insights clearly online is important for remote jobs. Power BI skills help stay connected and productive from anywhere.
  • High Demand in Remote Markets – Many businesses across the world want data experts can work remotely. Power BI skills are highly sought after because they help companies to understand data better. By learning Power BI, you open doors to global job opportunities. This increases your chances of landing a remote position.
  • Manage Large Data Sets Remotely – Power BI allows to work with big data without needing heavy software on your computer. You can access and analyze large datasets through the cloud, which is perfect for remote work. This skill shows employers can handle complex tasks from home. It makes you a valuable remote team member.
  • Continuous Learning and Updates – Power BI is continuously updated online with new features and enhancements. By mastering it, show that you can adapt and learn new tools remotely. This is a key quality for remote workers must stay updated without in-person training. Your Power BI skills prove you’re ready for remote challenges.

What to Expect in Your First Power BI Job

  • Learning Company Data – In your first Power BI job, you will spend time understanding the company’s data sources and how they are organized. This helps you know where the data comes from and what it means. Getting familiar with data is important before creating reports. Its a key step to delivering useful insights.
  • Building Basic Reports and Dashboards – You will start by creating simple reports and dashboards based on clear instructions. These help teams see important information quickly. As you gain confidence, you’ll work on more complex visuals. Its a great way to practice your skills and learn on the job.
  • Collaborating with Teams – You’ll work closely with business teams, managers and other analysts to understand their needs. Communication is important to make sure your reports answer the right questions. Expect to attend meetings and discuss data findings regularly. Teamwork helps to improve reports and skills.
  • Troubleshooting and Data Cleaning – Your job will also include fixing data errors and making sure reports are accurate. This means checking for mistakes and cleaning data using Power Query or other tools. Its a detailed task but very important to ensure trust in your reports. Learning this will make you a better analyst.
  • Continuous Learning and Improvement – Power BI tools and business needs often change, so you’ll keep learning new features and techniques. You might attend training or explore online tutorials to stay updated. Being open to learning helps you grow in your role. First job is just the start of an exciting career.

Top Companies are Hiring for Power BI Developer

  • Tata Consultancy Services (TCS) – TCS is one of India's leading IT services firms, offering a wide range of technology solutions to clients worldwide. They frequently hire Power BI professionals for roles such as BI Consultants, Power BI Developers and Data Analysts. Working at TCS provides opportunities to engage in large-scale projects and gain exposure to diverse industries.
  • Infosys – Infosys is world leader in technology, outsourcing and consulting. The company regularly recruits Power BI developers to enhance their data analytics capabilities. Joining Infosys offers freshers the chance to work on cutting-edge projects and develop expertise in business intelligence tools.
  • Accenture – Accenture is multinational professional services company specializing in IT services and consulting. They often seek Power BI professionals for roles like BI Engineers and Consultants. Working at Accenture allows individuals to be part of innovative projects and collaborate with clients across various industries.
  • Capgemini – Capgemini is global leader in consulting, technology services and digital transformation. The company frequently hires Power BI developers to support their clients' data needs. A career at Capgemini offers exposure to international projects and the opportunity to work with a diverse team of professionals.
  • Wipro – Wipro is multinational company based in India that offers business process, consulting and IT services. They actively recruit Power BI professionals for roles in data visualization and analytics. Joining Wipro provides freshers with the chance to work on innovative solutions and develop skills in business intelligence.
Show More

Upcoming Batches For Classroom and Online

Weekdays
15 - Sep- 2025
08:00 AM & 10:00 AM
Weekdays
17 - Sep - 2025
08:00 AM & 10:00 AM
Weekends
20 - Sep - 2025
(10:00 AM - 01:30 PM)
Weekends
21 - Sep - 2025
(09:00 AM - 02:00 PM)
Can't find a batch you were looking for?
INR ₹30680
INR ₹33000

OFF Expires in

Who Should Take a Power BI Course

IT Professionals

Non-IT Career Switchers

Fresh Graduates

Working Professionals

Diploma Holders

Professionals from Other Fields

Salary Hike

Graduates with Less Than 60%

Show More

Job Roles For Power BI Training in OMR

Power BI Developer

Business Intelligence (BI) Analyst

Data Analyst

Data Engineer

Power BI Consultant

BI Architect

Data Scientist

Reporting Analyst

Show More

Tools Covered For Power BI Training

Power BI Desktop Power BI Service Power BI Data Gateway Power BI Mobile Apps Power BI Report Builder Power BI Report Server Power Query Power Pivot

What’s included ?

Convenient learning format

📊 Free Aptitude and Technical Skills Training

  • Learn basic maths and logical thinking to solve problems easily.
  • Understand simple coding and technical concepts step by step.
  • Get ready for exams and interviews with regular practice.
Dedicated career services

🛠️ Hands-On Projects

  • Work on real-time projects to apply what you learn.
  • Build mini apps and tools daily to enhance your coding skills.
  • Gain practical experience just like in real jobs.
Learn from the best

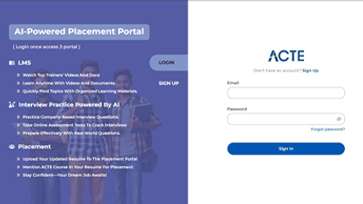
🧠 AI Powered Self Interview Practice Portal

  • Practice interview questions with instant AI feedback.
  • Improve your answers by speaking and reviewing them.
  • Build confidence with real-time mock interview sessions.
Learn from the best

🎯 Interview Preparation For Freshers

  • Practice company-based interview questions.
  • Take online assessment tests to crack interviews
  • Practice confidently with real-world interview and project-based questions.
Learn from the best

🧪 LMS Online Learning Platform

  • Explore expert trainer videos and documents to boost your learning.
  • Study anytime with on-demand videos and detailed documents.
  • Quickly find topics with organized learning materials.

Power BI course Syllabus

  • 🏫 Classroom Training
  • 💻 Online Training
  • 🚫 No Pre Request (Any Vertical)
  • 🏭 Industrial Expert

Our Power BI Training in OMR is designed with a complete syllabus ideal for beginners and aspiring data professionals. Through this Power BI Course in OMR, learn data modeling, DAX formulas, report creation, Power Query and dashboard development. The course also covers data visualization best practices and real-time data analysis techniques. Students gain hands-on experience through Power BI Internships in OMR and real-world projects.

  • Introduction to Power BI Fundamentals – Start with the basics of Power BI, including data import, data types and understanding the interface to build a strong foundation in data visualization.
  • Advanced Techniques and Features – Enhance your skills by learning advanced concepts like DAX formulas, data modeling, Power Query transformations and creating interactive dashboards for insightful reporting.
  • Hands-On Project Experience – Put your knowledge into practice with real-world projects such as sales dashboards, business reports and data analysis tasks to gain practical industry experience.
  • Power BI Tools and Sharing – Learn how to publish and share your reports using Power BI Service, manage workspaces and collaborate effectively while working with tools like Power BI Desktop and Power Query.
Power BI Foundamentals
Data Loading and Transformation
Data Modeling
DAX (Data Analysis Expressions)
Data Visualization Techniques
Power BI Service and Publishing
Security and Advanced Features

Understand the basics of Power BI and how it helps in data analysis:

  • Power BI Overview – Learn what Power BI is and why its used
  • Power BI Interface – Explore the layout and components of Power BI Desktop
  • Types of Power BI Tools – Desktop, Service and Mobile overview
  • Installation – Install Power BI Desktop and set up the environment
  • Connecting Data – Connect to Excel, CSV and other file formats

Learn to bring in data and make it ready for reporting using Power Query:

  • Power Query Editor – Explore the user interface for data transformation
  • Data Cleaning – Remove errors, blank rows and fix data formats
  • M Language Basics – Understand the scripting behind Power Query
  • Column and Row Operations – Add, remove, split and merge columns
  • Append and Merge Queries – Combine data from multiple sources

Organize your data for efficient reporting and performance:

  • Relationships – Create and manage relationships between tables
  • Star and Snowflake Schema – Understand data modeling structures
  • Calculated Columns – Add new data fields using expressions
  • Hierarchies – Create drill-down levels in your data
  • Data Categories – Tag columns as location, web URL or images

Use DAX to perform advanced calculations and metrics:

  • DAX Syntax – Learn DAX formulas are written
  • Calculated Measures – Create KPIs like total sales, profit margin, etc.
  • Aggregation Functions – Use SUM, AVERAGE, COUNT, etc.
  • Time Intelligence – Work with YTD, MTD, QTD calculations
  • Filter Functions – Use CALCULATE, FILTER, ALL for dynamic analysis

Create insightful visuals and dashboards:

  • Basic Charts – Bar, Column, Line, Pie and Donut charts
  • Advanced Visuals – Maps, Matrix, Waterfall, Funnel and Gauge charts
  • Slicers and Filters – Add interactivity to your reports
  • Tooltips and Bookmarks – Improve the user experience
  • Custom Visuals – Import visuals from Power BI marketplace

Learn to share, schedule and manage reports online:

  • Power BI Service – Navigate the cloud based platform
  • Workspaces – Organize and manage report access
  • Report Publishing – Upload dashboards to the Power BI Service
  • Dashboard vs Report – Understand the difference and use cases
  • Data Refresh – Schedule automatic updates for your data

Protect your data and explore advanced options:

  • Row-Level Security – Control who sees what data
  • Q and A Visual – Enable natural language queries in reports
  • Drill-through and Drill-down – Enable deeper data exploration
  • Performance Analyzer – Optimize your report speed
  • Export and Embed – Share reports via PDF, PowerPoint or websites

🎁 Free Addon Programs

Aptitude, Spoken English.

🎯 Our Placement Activities

Daily Task, Soft Skills, Projects, Group Discussions, Resume Preparation, Mock Interview.

Gain Hands-on Experience in Power BI Projects

Placement Support Overview

Today's Top Job Openings for Power BI Professionals

Power BI Developer

Company Code: TSV534

Chennai, Tamil Nadu

₹30,000 – ₹50,000 per month

B.Tech (CSE)/BCA//B.com

Exp 0–1 year

  • Looking for a Power BI Developer to design and build interactive dashboards and reports. Must know Power BI Desktop, DAX, Power Query and data modeling. Basic knowledge of SQL and data visualization principles preferred. Ability to work with teams and learn quickly is a plus.
  • Easy Apply

    Power BI Analyst

    Company Code: DII174

    Chennai, Tamil Nadu

    ₹28,000 – ₹45,000 per month

    Any Degree

    Exp 0-1 year

  • Hiring a Power BI Analyst to analyze business data and create insightful reports using Power BI tools. Should have skills in data visualization, report creation and basic SQL queries. Knowledge of data cleaning and transformation in Power Query is preferred. Strong communication skills required.
  • Easy Apply

    Business Intelligence (BI) Developer(Freshers)

    Company Code: IAT245

    Chennai, Tamil Nadu

    ₹35,000 – ₹55,000 per month

    B.Tech/M.Tech/B.Sc

    Exp 0–1 year

  • Seeking a BI Developer with basic experience in Power BI for creating dashboards and data models. Proficiency in DAX, Power Query and SQL is preferred but not mandatory. Willingness to learn and work with business teams to gather requirements is essential.
  • Easy Apply

    Data Visualization Specialist (Freshers)

    Company Code: BDT359

    Chennai, Tamil Nadu

    ₹30,000 – ₹48,000 per month

    B.Sc (Data Science)

    Exp 0–1 year

  • We’re looking for a Data Visualization Specialist skilled in Power BI to convert data into clear visuals. Must understand basic report designing, DAX formulas and data shaping using Power Query. Experience with multiple data sources is a bonus. Good teamwork and analytical skills are a must.
  • Easy Apply

    Power BI Reporting Analyst

    Company Code: NGS743

    Chennai, Tamil Nadu

    ₹27,000 – ₹43,000 per month

    Any Degree

    Exp 0–1 year

  • We're currently recruiting for Reporting Analyst proficient in Power BI to create and maintain business reports. Skills needed include building dashboards, data transformation and basic DAX knowledge. Familiarity with Excel and SQL is a plus. Being able to meet deadlines and paying attention to details are important.
  • Easy Apply

    Junior Power BI Consultant

    Company Code: VNT831

    Chennai, Tamil Nadu

    ₹32,000 – ₹48,000 per month

    Any Degree

    Exp 0–1 year

  • We're expanding and hiring for a Junior Power BI Consultant to assist in developing BI solutions and analyzing business requirements. Basic skills in Power BI Desktop, report generation and data visualization required. It is essential to have strong problem-solving abilities and be open to learning new skills.
  • Easy Apply

    Power BI Data Analyst

    Company Code: DWT911

    Chennai, Tamil Nadu

    ₹29,000 – ₹47,000 per month

    B.Sc/B.com

    Exp 0-2 yr

  • We have an opening for a Power BI Data Analyst to manage data extraction, cleaning and visualization tasks. Experience with Power Query and DAX preferred. Strong analytical mindset and ability to work with cross-functional teams are important.
  • Easy Apply

    Power BI Junior Developer

    Company Code: CMT698

    Chennai, Tamil Nadu

    ₹28,000 – ₹44,000 per month

    B.Sc IT

    Exp 0–1 year

  • Opportunities available for a Power BI Junior Developer to support the creation of reports and dashboards under senior guidance. Basic understanding of Power BI tools, data modeling and visualization techniques required. Eagerness to learn and improve skills is highly valued.
  • Easy Apply

    Highlights for Power BI Internships in OMR

    Real Time Projects

    • 1. Gain hands-on experience by working on live Power BI-based applications.
    • 2. Understand real-world problem-solving through scenarios.
    Book Session

    Skill Development Workshops

    • 1. Participate in focused sessions on trending technologies and tools.
    • 2. Learn directly from industry experts through guided practical exercises.
    Book Session

    Employee Welfare

    • 1. Enjoy benefits like health coverage, flexible hours, and wellness programs.
    • 2. Companies prioritize mental well-being and work-life balance for all employees.
    Book Session

    Mentorship & Peer Learning

    • 1. Learn under experienced mentors who guide your technical and career growth.
    • 2. Collaborate with peers to enhance learning through code reviews and group projects.
    Book Session

    Soft Skills & Career Readiness

    • 1. Improve communication, teamwork, and time management skills.
    • 2. Prepare for interviews and workplace dynamics with mock sessions and guidance.
    Book Session

    Certification

    • 1. Earn recognized credentials to validate your Power BI skills.
    • 2. Boost your resume with course or project completion certificates from reputed platforms.
    Book Session

    Sample Resume for Power BI (Fresher)

    • 1. Simple and Neat Resume Format

      – Use a clean layout with clear sections like summary, skills, education, and projects.

    • 2. List of Technologies You Know

      – Mention Skills like Power BI Desktop, DAX, Power Query, Data Modeling, Report Designing, Power BI Service, Row-Level Security.

    • 3. Real-Time Projects and Achievements

      – Add 1–2 real-time projects with a short description and the tools used.

    Top Power BI Interview Questions and Answers (2025 Guide)

    Ans:

    In Power BI, to add a calculated column, navigate to the Data view and create a DAX formula using the Modeling tab. Through row-by-row logic application to the current data, this formula generates a new column. As with other columns, calculated columns can be utilized in visualizations, filters and relationships after they are incorporated into the data model.

    Ans:

    A measure in Power BI is a formula that performs calculations such as sums, averages or counts dynamically based on user filters. Unlike calculated columns, measures compute results only when used in visuals, adjusting to the context and not increasing the data model size. Measures are written in DAX and are great for on-the-fly aggregation.

    Ans:

    A slicer is an interactive filtering tool in Power BI reports that lets users select criteria like dates or categories. When a slicer option is chosen, all report visuals update to reflect the selected data. Slicers make it easy for users to explore and analyze data without changing the report design.

    Ans:

    In Power BI Service, you set up scheduled data refreshes by going to the dataset’s settings after publishing. You can choose how often the data refreshes, such as daily or multiple times per day. This ensures reports show the latest data. For on-premises sources, a data gateway is needed to securely connect and refresh the data.

    Ans:

    DirectQuery mode keeps data in its original source instead of importing it into Power BI. Each time users interact with the report, queries are sent live to the database. This method suits very large datasets or cases needing real-time data, but it may slow down performance due to continuous querying.

    Ans:

    A report is a multi-page collection of visuals, charts and tables based on a single dataset, allowing deep data analysis. A dashboard is a one-page summary that pulls visuals from multiple reports or datasets, providing a quick overview of key information.

    Ans:

    To build a hierarchy, select multiple related columns like Year, Quarter and Month, then right-click and choose "Create Hierarchy." This organizes fields into drillable levels, enabling users to explore data from broad to detailed views within visuals.

    Ans:

    The Power Query Editor is where you clean and transform your data before it’s loaded into the data model. You can filter rows, remove duplicates, change data types and merge tables without coding. The steps are recorded and applied consistently whenever the data refreshes.

    Ans:

    Calculated tables are generated by writing DAX formulas within the Modeling tab. Unlike imported tables, these tables are created from existing data in the model, often used to summarize or filter data or to build relationships between tables.

    Ans:

    The Power BI Developer API lets developers embed reports and dashboards into custom apps or websites, automate publishing processes and manage datasets and workspaces programmatically. Its ideal for businesses aiming to customize analytics or manage Power BI at a large scale.

    Company-Specific Interview Questions from Top MNCs

    1. What is Power BI and what are its main components?

    Ans:

    Power BI is a Microsoft analytics tool designed for data visualization and sharing insights within organizations. Its primary components include Power BI Desktop for creating reports, Power BI Service for cloud-based sharing and collaboration and Power BI Mobile for accessing reports on smartphones. Together, they enable smooth data analysis and reporting.

    2. How do you connect and load data from different sources into Power BI?

    Ans:

    Power BI allows to connect to various data sources such as Excel spreadsheets, SQL databases, web APIs and cloud platforms. Using the Get Data option in Power BI Desktop, users select the source, establish a connection and then either import the data or query it live depending on the selected mode.

    3. What is DAX and how is it different from Power Query in Power BI?

    Ans:

    DAX (Data Analysis Expressions) is the formula language used in Power BI for creating custom calculations and aggregations after data is loaded. Power Query, on the other hand, is used prior to loading data to transform, clean and shape the data. Essentially, Power Query handles the data preparation stage while DAX is used for calculations within the data model.

    4. How do calculated columns and measures differ in Power BI?

    Ans:

    Calculated columns are created on a row-by-row basis and stored in the data model as new fields, which can be used in visuals and other calculations. Measures are dynamic calculations computed at query time, often used for aggregating data. Measures are more efficient for handling large datasets and interactive reports.

    5. What is row-level security (RLS) and how do you implement it in Power BI?

    Ans:

    Row-level security restricts user access so they only see data relevant to their role. In Power BI, RLS is set up by creating security roles with filters inside Power BI Desktop, then assigning users to these roles through the Power BI Service, ensuring personalized data access based on permissions.

    6. What are some ways to enhance Power BI report performance?

    Ans:

    To enhance report performance, reduce the size of your data model by eliminating unnecessary columns and tables. Optimize DAX formulas for simplicity, use aggregations and limit the number of visuals per report page. Enabling query folding in Power Query also helps queries run more efficiently.

    7. What types of filters can you apply in Power BI reports?

    Ans:

    Power BI provides various filter types: visual-level filters affect only one visual, page-level filters apply to all visuals on a page and report-level filters impact the entire report. Slicers offer an interactive way for users to filter data dynamically while exploring reports.

    8. What is the function of a Power BI Gateway?

    Ans:

    A Power BI Gateway acts as a secure bridge between the Power BI cloud service and on-premises data sources. It facilitates scheduled and live data refreshes without moving data to the cloud, ensuring reports and dashboards display the latest information from internal networks.

    9. How is data refresh handled in Power BI?

    Ans:

    Data refresh keeps datasets up to date by pulling the latest information from source systems. You can schedule automatic refreshes in Power BI Service. For on-premises sources a gateway must be set up to enable these refreshes. Full refresh reloads all data, while incremental refresh updates only new or modified records.

    10. What are the differences between Import, DirectQuery,and Live Connection modes in Power BI?

    Ans:

    Import mode loads data into Power BI for fast querying but requires periodic refreshes. DirectQuery sends live queries to the data source on every interaction, offering real time data with possible slower response times. Live Connection connects directly to Analysis Services models, allowing live data interaction without importing it into Power BI.

    1. What is Power BI and why is it essential for business intelligence?

    Ans:

    Power BI is a Microsoft-developed data visualization and analytics tool that enables organizations to convert raw data into interactive reports and dashboards. It is vital for business intelligence because it simplifies gathering data from multiple sources, speeds up analysis and shares insights that help make better decisions. Businesses can monitor trends, assess performance and find new opportunities due to its intuitive design and smooth connectivity with other Microsoft products.

    2. How can Power BI connect to various data sources?

    Ans:

    Data sources that Power BI can connect to include databases, Excel spreadsheets, cloud platforms and online APIs. You can use the “Get Data” feature in Power BI Desktop, select the data source type, enter the required credentials and establish the connection. After connecting you can either import the data for analysis or use live connections depending on the scenario, offering flexibility for different needs.

    3. What distinguishes Power Query from DAX in Power BI?

    Ans:

    Power Query and DAX serve distinct functions in Power BI. Power Query is designed for data extraction, cleaning and transformation before the data is loaded into the model essentially preparing the data. In contrast, DAX is a formula language used inside the data model to perform calculations and create dynamic summaries once data is loaded. Simply put, Power Query shapes your data upfront, while DAX performs on-the-fly calculations within reports.

    4. When should you utilize Power BI's computed columns and measures?

    Ans:

    Calculated columns add new fields to tables by performing calculations on each row and these values are stored within the data model. Measures, on the other hand, calculate results dynamically during report interactions, usually for aggregations like sums or averages. Use calculated columns when you need fixed data per row and use measures when you want calculations that update based on user selections or filters.

    5. How do you implement row-level security (RLS) in Power BI to restrict data access?

    Ans:

    Row-level security restricts data visibility based on user roles. To set it up define security roles and specify filter criteria for tables within Power BI Desktop. After publishing the report to Power BI Service assign users or groups to these roles. This configuration ensures users only see data they have permission to access, providing secure and tailored reporting.

    6. What are the different methods to refresh data in Power BI?

    Ans:

    Data in Power BI can be refreshed either manually or automatically. Scheduled refreshes update datasets at predefined intervals, ensuring reports display current information. For on-premises data sources, a data gateway is required to facilitate refreshes. There are two types of refreshes: full refresh, which reloads all data and incremental refresh, which only updates new or modified data to improve efficiency especially for large datasets.

    7. What techniques can be applied to enhance Power BI reports' performance and responsiveness?

    Ans:

    To enhance report speed, you can reduce the data model size by eliminating unnecessary columns and tables, simplify complex DAX expressions and use aggregations instead of detailed calculations. Limiting the number of visuals per page and enabling query folding in Power Query which pushes data transformation tasks back to the source system also helps speed up loading times and overall responsiveness.

    8. What are bookmarks in Power BI and how do they improve reports?

    Ans:

    Bookmarks in Power BI capture the current state of a report page, including filters, slicers and visuals. They help create interactive stories by allowing users to navigate through different views or scenarios. By combining bookmarks with buttons and navigation elements, you can design customized, engaging user experiences that make reports more dynamic.

    9. How do DirectQuery and Import modes differ in Power BI?

    Ans:

    Import mode loads data into Power BI’s internal storage for fast querying and offline use but requires periodic refreshes to keep data updated. DirectQuery option provides the most recent information but may result in slower performance because it queries the data directly from source in real-time each time the report is loaded. The choice depends on your requirements for data freshness dataset size and speed.

    10. How do you handle relationships between tables in Power BI?

    Ans:

    In Power BI, relationships link tables to form a coherent data model. You establish these by connecting matching columns (keys) between tables, typically primary and foreign keys. Properly managing relationships ensures accurate data flow in visuals and calculations. Control the cardinality, filter direction and activate or deactivate relationships to regulate how tables interact within your model.

    1. What is Power BI and how is it utilized for business reporting?

    Ans:

    Power BI by Microsoft is a data visualization and business intelligence tool that helps users convert raw, unorganized data into interactive dashboards and reports. It enables connections to multiple data sources, data transformation and creation of visual insights. The platform consists of Power BI Desktop for report creation, the cloud-based Power BI Service for sharing and collaboration and Power BI Mobile for accessing reports on mobile devices.

    2. Can you explain what DAX is in Power BI and its significance?

    Ans:

    DAX, standing for Data Analysis Expressions, is the formula language used in Power BI for calculations and data analysis. It allows users to build custom columns, measures and calculated tables. With a rich library of functions including aggregation (SUM, AVERAGE), filtering (FILTER, ALL) and logical operations (IF, SWITCH), DAX is vital for developing complex and dynamic data models.

    3. What kinds of relationships can be established between tables in Power BI?

    Ans:

    In Power BI, you can create three main types of relationships: one-to-one, one-to-many and many-to-many. A one-to-one relationship links each record in one table to exactly one record in another. When one record in one database correlates to several records in another, this is known as a one-to-many relationship. Many-to-many relationships happen when records in both tables are related to multiple entries in the other, often requiring an intermediate or bridge table.

    4. How do Import mode and DirectQuery mode differ in Power BI?

    Ans:

    Import mode loads all data into Power BI’s internal storage, enabling fast query performance and offline usage, but requires periodic data refreshes to remain current. DirectQuery mode, on the other hand, does not store data internally; it queries the source live each time a report is used, providing real-time data access but potentially slower performance depending on the data source.

    5. What are KPIs in Power BI and how do businesses use them?

    Ans:

    Key Performance Indicators (KPIs) in Power BI are visual tools designed to monitor how business metrics perform against targets. Typically a KPI shows the actual figure (such as sales revenue), the goal and an indicator (often color-coded green or red) reflecting progress. KPIs help organizations quickly gauge if they are on track to meet their objectives.

    6. Which data sources can Power BI connect to?

    Ans:

    Traditional databases like SQL Server, Oracle and MySQL; cloud services like Azure, Snowflake and Google BigQuery; and file formats like Excel, CSV, JSON and XML are just a few of the many data sources that Power BI supports. It also connects to APIs and platforms like SharePoint and Dynamics 365 providing flexibility for diverse data environments.

    7. How does Power BI assist in monitoring performance using KPIs?

    Ans:

    Power BI tracks KPIs by visually comparing actual results with target goals. KPI visuals display the metric being tracked, the desired target and an indicator (such as color or icon) showing progress. Determining if goals are being fulfilled or not is made simpler with this visual representation of performance patterns.

    8. What is the Power Query Editor in Power BI, and what is its purpose?

    Ans:

    Power Query Editor is a tool within Power BI used to connect to data sources, clean and transform data before it is loaded for reporting. Users can remove duplicates, change data types, merge or split columns and filter records. This tool simplifies data preparation allowing for efficient processing without advanced coding.

    9. What are hierarchies in Power BI and why are they beneficial?

    Ans:

    Hierarchies in Power BI organize data into multiple levels enabling users to drill down into detailed information. For example a date hierarchy might be structured as Year → Quarter → Month → Day, allowing exploration at different time granularities. Geographic hierarchies might follow Country → State → City. Hierarchies improve navigation and enhance the user experience in reports.

    10. What data connectivity options does Power BI provide?

    Ans:

    Power BI offers three primary data connectivity methods: Import, DirectQuery and Live Connection. Import mode loads data into Power BI for quick, offline use. DirectQuery accesses data live from the source, which might be slower but provides up-to-date information. Live Connection, similar to DirectQuery, specifically connects to SQL Server Analysis Services (SSAS) models for live data analysis without importing data into Power BI.

    1. How does Power BI differ from Excel when it comes to analyzing data?

    Ans:

    Although both Excel and Power BI are tools for data analysis, Power BI offers more advanced capabilities for creating visual reports and interactive dashboards. Unlike Excel’s spreadsheet format, Power BI is designed to manage large datasets, connect with multiple data sources and deliver dynamic, visually engaging analytics. Additionally, Power BI supports automation, real time data refreshes and easier report sharing, making it ideal for contemporary business intelligence tasks.

    2. How does Power BI manage data extraction and transformation using Power Query?

    Ans:

    Power BI utilizes Power Query as its ETL (Extract, Transform, Load) tool to prepare data before report creation. It starts by connecting to a data source (extract), then enables users to clean, filter, merge, split or reshape the data (transform) through a user-friendly interface. After these steps, the data is loaded into Power BI’s data model (load), ensuring it is organized, clean and ready for analysis.

    3. What is DAX in Power BI and which functions are commonly used?

    Ans:

    The DAX (Data Analysis Expressions) formula language in Power BI can be used to generate measures and calculated columns. Similar to Excel formulas but more robust, DAX empowers dynamic data modeling. Frequently used functions include SUM() to total values, AVERAGE() for mean calculations, CALCULATE() to apply filters and IF() for conditional logic, adding intelligence and flexibility to your reports.

    4. How do you establish relationships between tables in Power BI?

    Ans:

    In Power BI, relationships link different tables to create a cohesive data model. These connections are formed by matching common fields such as IDs or codes shared between tables. Power BI supports one-to-one, one-to-many and many-to-many relationships. With these relationships in place can combine data from multiple tables seamlessly in a single report, maintaining accuracy and consistency.

    5. What distinguishes Import mode from DirectQuery mode in the Power BI?

    Ans:

    Import mode loads data directly into Power BI’s internal storage, providing faster performance and offline capabilities but requiring periodic refreshes. In contrast DirectQuery does not store data locally; instead, it queries the source in real time whenever a report is accessed. While Import is generally faster DirectQuery is preferable for handling large datasets that frequently update.

    6. How do you add slicers to Power BI reports and what is their purpose?

    Ans:

    Slicers are interactive filters in Power BI that allow users to select which data is shown in visuals. To add a slicer, drag a field such as "Region" or "Category" into the slicer visual on the report canvas. Users can then click options within the slicer to filter all related visuals on the page, enabling easy, self-service data exploration without altering the report design.

    7. What is row-level security (RLS) in Power BI and how do you implement it?

    Ans:

    Row-level security (RLS) restricts data access so that users only see information relevant to their role or identity. It is implemented by creating roles and defining filter rules (for example, by region or department) within Power BI Desktop. After publishing the report, you assign users to these roles through the Power BI Service, ensuring secure and personalized data visibility.

    8. What actions can you take if your Power BI reports are performing slowly?

    Ans:

    If reports run slowly several strategies can help improve speed: reduce the data model size by removing unnecessary columns or tables, simplify complex DAX expressions and limit the number of visuals per page. Enabling query folding in Power Query and using aggregated or summary tables can also boost performance. Additionally, use Power BI Desktop’s Performance Analyzer tool to identify bottlenecks.

    9. How do you publish and share Power BI reports with others?

    Ans:

    To share a Power BI report, first publish it from Power BI Desktop to the Power BI Service (cloud environment). From there, you can grant access directly to users or add the report to shared workspaces. Reports can also be embedded in platforms like Microsoft Teams or SharePoint and you can configure automatic email subscriptions to keep stakeholders informed.

    10. What is Power BI Service and how does it differ from Power BI Desktop?

    Ans:

    Power BI Service is a cloud-based platform for hosting, sharing and collaborating on reports created in Power BI Desktop. While Power BI Desktop is used for designing and building reports locally, Power BI Service handles report publishing, scheduling data refreshes, managing user permissions and viewing dashboards from anywhere. Essentially, Desktop is the development environment and Service is the distribution and collaboration platform.

    1. What is Power BI and what are its main components?

    Ans:

    Microsoft created Power BI, a business intelligence application that enables users to model and transform data, connect to data sources and produce interactive dashboards and reports. Its primary parts include Power BI Desktop, which is used for report creation and design; Power BI Service, a cloud-based platform for publishing, sharing and collaboration; and Power BI Mobile, which enables viewing reports on mobile devices like smartphones and tablets.

    2. How does Power Query assist in cleaning and transforming data within Power BI?

    Ans:

    Power Query is an integrated tool in Power BI designed for converting raw data into a structured, analysis-ready format. It offers a user-friendly interface for connecting to several data sources and performing transformations without the need for coding, including filtering rows, eliminating duplicates, altering data types, dividing columns and combining tables.

    3. What is DAX in Power BI and how do SUM and SUMX functions differ?

    Ans:

    DAX, or Data Analysis Expressions, is the formula language used in Power BI for creating custom calculations like measures, calculated columns and tables. The SUM() function simply adds all values in a single column, whereas SUMX() performs row-by-row calculations over a table and then sums the results, allowing more complex aggregations.

    4. What is a data model in Power BI and why is it essential?

    Ans:

    A data model in Power BI represents the organized structure of your data, encompassing tables, relationships, calculations and metadata. It enables effective and linked analysis by combining data from several sources into a single format.

    5. How do you establish relationships between tables in Power BI?

    Ans:

    Relationships in Power BI link tables by matching common fields such as IDs or keys. These connections can be set up manually or detected automatically by Power BI. The most typical type is a one-to-many relationship, where one record in a primary table (e.g., "Customer") corresponds to multiple records in a related table (e.g., "Sales").

    6. What are calculated columns in Power BI and how do they differ from measures?

    Ans:

    Calculated columns are additional columns created using DAX expressions that evaluate data row by row and are stored within the data model. They can be used in visuals or relationships. In contrast, measures are dynamic calculations computed only when used in visuals and generally perform aggregations or summaries.

    7. How do Power BI Desktop and Power BI Service differ and what are their uses?

    Ans:

    Power BI Desktop is a desktop application where you connect to data, transform it and design reports with visuals. Power BI Service is the cloud-based platform used to publish those reports, share them with others, schedule data refreshes, manage access permissions and collaborate within workspaces.

    8. How can you limit user access to specific data in Power BI?

    Ans:

    Power BI uses Row-Level Security (RLS) to restrict data visibility. By creating roles and defining filters on the data model, RLS ensures users only see data relevant to them for example, a sales manager only viewing sales for their assigned region.

    9. What is the distinction between DirectQuery and Import mode in Power BI and when would you choose each?

    Ans:

    Import mode copies data into Power BI’s internal storage, offering fast report performance but requiring regular refreshes to keep data updated. DirectQuery keeps data in original source and queries it live when the report runs, making it suitable for large or frequently changing datasets, though it might be slower.

    10. Can you share an experience where you created a complex dashboard and addressed performance challenges?

    Ans:

    In a project involving a dashboard that combined multiple data sources with visuals tracking sales, inventory and customer metrics, performance issues arose due to the large dataset and complex DAX formulas. To optimize, I reduced the number of visuals per page, streamlined the data model by eliminating unused columns, replaced calculated columns with measures when possible and utilized summary tables with pre-aggregated data to speed up the report.

    Disclaimer Note:

    The details mentioned here are for supportive purposes only. There are no tie-ups or links with the corresponding PGs.

    Ladies PG Accommodation

      Velachery
    • Sanz Live Women's PG : 72007 19990
    • Krishnaveni Castle : 90801 95007
    • Anna Nagar
    • Pentos Women's PG : 93427 57797
    • Women's Nest - Ladies PG : 94451 25894
    • OMR
    • MSR Luxury PG : 89399 91922
    • Porur
    • Sree Shakthi Ladies Hostel : 90031 98767
    • Friends Ladies Hostel : 73389 19836
    • Tambaram
    • CK HIVE Girls Ladies PG90948 58303
    • Layaa Women’s Hostel63797 00573

    Mens PG Accommodation

      Velachery
    • Stayflix PG for Men's : 96000 45088
    • DJ Men's PG Velachery : 90803 19242
    • Anna Nagar
    • Stay Inn Men's Hostel(PG) : 94454 87884
    • Brights Boys Hostel : 88387 88921
    • OMR
    • Sree Siddhi Vinayaka Mens PG : 95577 95579
    • Rudhra Men’s PG : 93636 45199
    • Porur
    • SIDDHANS Men's PG : 88259 71908
    • Jaswanth Raaj Mens PG : 89255 15888
    • Tambaram
    • Sri Sai Grn Men's PG : 81228 24076
    • Rolexx Men's PG : 80988 84848

    Top Power BI Job Opportunities for Freshers

    • 1. Power BI Jobs at Startups and IT Companies
    • 2. Campus Placements and IT Service Jobs
    • 3. Internship-to-Job Programs
    • 4. Apply Through Job Portals
    • 5. Skills That Help You Get Hired

    Getting Started With Power BI Course in Offline

    No Coding
    8 Lakhs+ CTC
    No Work Pressure
    WFH Jobs (Remote)

    Why Power BI is the Ultimate Career Choice

    High Demand

    Companies prefer multi-skilled professionals who can handle entire project cycles.

    Global Opportunities

    Open doors to remote and international job markets.

    High Salary

    Enjoy competitive salaries and rapid career advancement.

    Flexible Career Path

    Explore roles such as developer, architect, freelancer, or entrepreneur.

    Future-Proof Career

    Stay relevant with skills that are consistently in demand in the evolving tech landscape.

    Versatility Across Industries

    Work in various domains like e-commerce, healthcare, finance, and more.

    Career Support

    Placement Assistance

    Exclusive access to ACTE Job portal

    Mock Interview Preparation

    1 on 1 Career Mentoring Sessions

    Career Oriented Sessions

    Resume & LinkedIn Profile Building

    Get Advanced Power BI Certification

    You'll receive a certificate proving your industry readiness.Just complete your projects and pass the pre-placement assessment.This certification validates your skills and prepares you for real-world roles.

    • PL-300 (Microsoft Power BI Data Analyst Associate)
    • Power BI for Data Science Certifications
    • Microsoft Certified: Data Analyst Associate
    • Power BI Professional Certificate Courses

    Yes, obtaining a Power BI certification can significantly boost your chances when applying for data analyst or business intelligence positions. It serves as proof of your skills and dedication to professional development, giving employers confidence in your abilities. When combined with practical experience and real project work, a certification can differentiate you from other candidates and increase your employability.

    The length of time varies according to your level of expertise and knowledge at time. Beginners might require between 2 to 4 months of consistent study and practice to become confident with material. Individuals already familiar with data analysis or Power BI basics can often prepare within 3 to 6 weeks. Success depends on regular hands on practice and thorough review of official exam resources.

    • Validates expertise in Power BI and data analysis
    • Improves resume and increases job opportunities
    • Helps you qualify for higher-paying positions
    • Boosts your professional credibility in analytics
    • Offers a structured path for learning and career development
    • Study the official Microsoft PL-300 exam guide and key topics
    • Practice creating dashboards, reports and data models using the Power BI Desktop
    • Work with real world datasets to gain hands on experience
    • Take practice tests, quizzes and review sample exam questions
    • Participate in online courses, join forums or form study groups to resolve doubts and stay motivated

    Complete Your Course

    A Downloadable Certificate in PDF Format, Immediately Available to You When You Complete Your Course.

    Get Certified

    A Physical Version of Your Officially Branded and Security-Marked Certificate.

    Get Certified

    Lowest Power BI Course Fees in OMR

    Affordable, Quality Training for Freshers to Launch IT Careers & Land Top Placements.

    Call Course Advisor

    How is ACTE's Power BI Course in ORM Different?

    Feature

    ACTE Technologies

    Other Institutes

    Affordable Fees

    Competitive Pricing With Flexible Payment Options.

    Higher Power BI Fees With Limited Payment Options.

    Industry Experts

    Well Experienced Trainer From a Relevant Field With Practical Power BI Training

    Theoretical Class With Limited Practical

    Updated Syllabus

    Updated and Industry-relevant Power BI Course Curriculum With Hands-on Learning.

    Outdated Curriculum With Limited Practical Training.

    Hands-on projects

    Real-world Power BI Projects With Live Case Studies and Collaboration With Companies.

    Basic Projects With Limited Real-world Application.

    Certification

    Industry-recognized Power BI Certifications With Global Validity.

    Basic Power BI Certifications With Limited Recognition.

    Placement Support

    Strong Placement Support With Tie-ups With Top Companies and Mock Interviews.

    Basic Placement Support

    Industry Partnerships

    Strong Ties With Top Tech Companies for Internships and Placements

    No Partnerships, Limited Opportunities

    Batch Size

    Small Batch Sizes for Personalized Attention.

    Large Batch Sizes With Limited Individual Focus.

    LMS Features

    Lifetime Access Course video Materials in LMS, Online Interview Practice, upload resumes in Placement Portal.

    No LMS Features or Perks.

    Training Support

    Dedicated Mentors, 24/7 Doubt Resolution, and Personalized Guidance.

    Limited Mentor Support and No After-hours Assistance.

    Power BI Course FAQs

    1. What do I need to begin learning Power BI training?

    To start learning Power BI, you only need basic computer skills and some logical thinking. Although it is not required, having knowledge of Excel or fundamental data concepts can be beneficial. Even beginners without any prior experience in data or analytics can quickly learn Power BI through guided training that walks you through the process step-by-step.
    Absolutely! Power BI is one of the leading business intelligence tools used by companies of all sizes worldwide. It is highly valued across industries such as finance, healthcare, marketing and retail for data visualization and supporting data-driven decision-making. As organizations continue to prioritize data insights, Power BI skills are increasingly in demand, making it a smart choice for a stable and evolving career path.
    A typical Power BI course usually starts with teaching data import and cleaning techniques using Power Query, followed by foundational concepts in data modeling. The training then moves on to creating visuals, dashboards and reports. Advanced topics often include learning DAX (Data Analysis Expressions) for custom calculations, implementing row-level security, scheduling data refreshes and optimizing report performance. Additionally, most courses cover how to use Power BI Service for publishing and collaboration.
    Yes, practical, real-world projects are an important component of Power BI training. You will have the opportunity to work with actual datasets, create interactive dashboards and solve business challenges using data visualization. These hands-on projects allow to apply the concepts you have learned and help build a portfolio that demonstrates your skills to potential employers.
    Most Power BI training programs offer assistance with resume preparation. This includes guidance on how to effectively highlight your Power BI skills, showcase your project work and list any certifications you have earned. Such support helps ensure that your resume catches the attention of hiring managers and recruiters in the competitive job market.
    Anyone interested in pursuing data analysis or business intelligence can join Power BI training. The course is suitable for complete beginners, students, or working professionals looking to upskill. It is designed to prepare learners for roles in data analysis, reporting and business intelligence across various industries.
    Having a college degree in a related field such as computer science or business can be beneficial but is not a strict requirement to become a Power BI professional. You can successfully build a career in Power BI through practical skills, hands-on project experience and obtaining relevant certifications, even without formal higher education.
    Starting a Power BI course does not require a lot of prior expertise. Logical reasoning and rudimentary computing abilities are adequate. Although having some experience with databases or Excel can be helpful, the course is made so that even total beginners can pick up the skills and understand the ideas fast.
    No programming knowledge is required to learn Power BI initially. The tool is designed to be user-friendly and accessible for non-programmers. While having a basic understanding of formulas and expressions can be helpful, all necessary skills including advanced features like DAX formulas are taught step-by-step throughout the course.

    1. Is job placement assistance provided with Power BI training?

    Yes, most Power BI training programs include job placement support. This typically involves resume reviews, interview preparation and career guidance. Some training institutes also organize campus hiring drives or directly connect students with companies looking to recruit Power BI professionals.

    2. Will I work on projects that can be showcased to employers?

    Definitely. Hands-on projects form a crucial part of Power BI training. You will develop dashboards and reports using real or simulated business data. Your professional portfolio can then contain these finished projects to demonstrate your useful abilities and win over potential employers.

    3. Can I apply to reputed companies after completing Power BI training?

    Yes, with strong Power BI knowledge, relevant project experience and certification, you will be well-equipped to apply to leading companies across industries such as finance, retail, healthcare and IT. Power BI skills are in demand, making you a competitive candidate for many roles.

    4. Is there support available for beginners or freshers?

    Comprehensive support is usually available for beginners or freshers enrolled in Power BI training programs. This support includes skill development, project work, mock interviews and career advice to help you land your first job in the data analytics or business intelligence fields.
    Yes, you will obtain a certificate attesting to your training and skill set after successfully completing the Power BI course. This certification strengthens your resume and adds credibility when presenting yourself to potential employers.
    Absolutely. Power BI is one of the most widely used business intelligence tools, enabling professionals to transform raw data into actionable insights. Gaining knowledge with Power BI opens you a wide range of job options in reporting, data analysis and decision-making positions in several industries.
    You do not need any prior programming or analytics experience before starting Power BI training. Basic computer literacy and logical thinking are sufficient and the training program will guide you through every step to ensure you build the skills you need.
    Power BI training equips you with industry-relevant skills and hands-on project experience, along with a recognized certification that enhances your job prospects. These advantages provide you the skills and self-assurance you need to succeed, preparing you for positions in data analysis, business intelligence and related fields.
    A Power BI course will teach how to utilize Power Query to import and process data, develop data models, generate reports and graphics and use DAX to perform custom calculations. The training also covers securing data with row-level security, publishing reports via Power BI Service and optimizing report performance for better user experience.

    1. Is placement support provided after course completion?

    Yes, most Power BI training providers offer full placement support after you finish the course. This usually includes help with resume building, mock interviews and guidance on job applications to assist you in finding the right career opportunity.
    Course fees can vary between training centers due to multiple factors including the experience and expertise of the faculty, duration of the course, resources and materials provided, level of placement support and quality of facilities. Premium training institutes might also offer personalized mentoring or additional projects which can increase the overall cost.
    Generally Power BI training is designed to be affordable, especially when considering the practical skills and career support it provides. Many training institutes also offer flexible payment plans to make it easier for beginners to access quality education.
    Typically, fees are quite consistent across different cities to ensure that learners everywhere have access to quality Power BI training without significant price differences.
    Learn (Power BI Desktop + DAX + Power Query + Data Modeling + Report Designing + Power BI Service + Data Visualization) at 30,680/- Only.
    Acte Technologies WhatsApp

    Power BI Course for All Graduates, NON-IT, Diploma & Career Gaps — ₹30,680/- only.

    Download Brouchure