Power BI Training in Hyderabad | Best Power BI Certification | Updated 2025
Home » Bi & Data Warehousing Courses Hyderabad » Power BI Course in Hyderabad

Power BI Course in Hyderabad

5988 Ratings

Rated #1 Recoginized as the No.1 Institute for Power BI Training in Hyderabad

Acte’s Power Bi Training in Hyderabad Is a Thorough Program Made for Anyone Who Wish to Advance Their Power Bi Training Courses.

In Addition to Imparting Knowledge, Acte Academy Gives You the Skills Necessary to Excel. In Addition to Keeping You Current, Our Power Bi Certification Offers You the Chance to Build a Successful Future. That Assurance Will Come From Your Acte Academy Power Bi Training Certification.

  • Top-Rated Power Bi Training in Hyderabad.
  • Reasonably Priced, the Best Curriculum With 100% Placement.
  • Benefit From Unlimited Interview Possibilities With Leading Mncs.
  • More Than 350 Employing Clients and Over 11462 Trained Learners.
  • Learn From Power Bi Certified Professionals With More Than Ten Years of Experience.
  • To Improve Your Skills in Power Bi Training in Hyderabad Join Our Interactive Sessions.

Fee INR 18000

INR 14000

Training

  • Case Studies and Projects 8+

  • Hours of Training 45+

  • Placement Assurance 100%

  • Expert Support 24/7

  • Support & Access Lifetime

  • Certification Yes

  • Skill Level All

  • Language All

Explore Our Extensive Power BI Training

  • Our Power BI training provides individuals with data visualization and business intelligence skills.
  • Participate in real-world projects replicating professional data scenarios, sharpening your practical Power BI skills.
  • Gain proficiency in Power BI, the leading business analytics tool for creating interactive reports and dashboards.
  • Our comprehensive course covers many topics, including data modeling, data visualization, DAX calculations, and Power Query translation.
  • Prepare for Power BI certification exams through hands-on practice, interactive exercises, and comprehensive mock tests.
  • Upon successfully completing our Power BI program, you'll receive a certificate verifying your data visualization and analytics expertise.
  • Enhance your career prospects in roles like business intelligence analyst, data analyst, and reporting specialist with a Power BI certification.
  • Classroom Batch Training
  • One To One Training
  • Online Training
  • Customized Training
  • Enroll Now

Talk to us

we are happy to help you 24/7

Other Categories Placements
  • Non-IT to IT (Career Transition) 2371+
  • Diploma Candidates3001+
  • Non-Engineering Students (Arts & Science)3419+
  • Engineering Students3571+
  • CTC Greater than 5 LPA4542+
  • Academic Percentage Less than 60%5583+
  • Career Break / Gap Students2588+
13-Jan-2025
Mon-Fri

Weekdays Regular

08:00 AM & 10:00 AM Batches

(Class 1Hr - 1:30Hrs) / Per Session

15-Jan-2025
Mon-Fri

Weekdays Regular

08:00 AM & 10:00 AM Batches

(Class 1Hr - 1:30Hrs) / Per Session

11-Jan-2025
Sat,Sun

Weekend Regular

(10:00 AM - 01:30 PM)

(Class 3hr - 3:30Hrs) / Per Session

12-Jan-2025
Sat,Sun

Weekend Fasttrack

(09:00 AM - 02:00 PM)

(Class 4:30Hr - 5:00Hrs) / Per Session

    Hear it from our Graduate

    Course Objectives

    Learning Power BI is valuable because it gives you the skills to transform data into actionable understandings, enhancing your career prospects in data analytics and business intelligence.

    What is the future perspective for Power BI?

    • Strong and favorable growth prospects.
    • Increasing demand for data-driven insights.
    • Integration with AI and cloud technologies.
    • Continuous development and feature enhancements.
    • Basic knowledge of ideas in data analysis.
    • It's beneficial to be familiar with Microsoft Excel.
    • Knowledge of operating systems based on Windows.
    Our training can provide you with essential skills in data visualization, analysis, and report creation. You'll learn to transform and model data, build interactive dashboards, and use advanced functions like DAX, enhancing your ability to make data-driven decisions and excel in data-related roles.
    In our Power BI training, participants frequently engage in practical projects that involve applying their skills to real-world situations, enabling them to acquire hands-on experience in data analysis and visualization.
    • Introduction to Power BI and its components
    • Data modeling and relationships
    • Creating and formatting visualizations
    • DAX (Data Analysis Expressions) functions and calculations
    • Power Query for data shaping and ETL
    • Sharing and collaboration features in Power BI
    It is possible to have a successful career in Power BI in India. There is a need for specialists who can use Power BI to analyze and visualize data due to a demand for data-driven decision-making among enterprises.

    What are the benefits of undergoing Power BI training?

    • Improved data visualization skills
    • Enhanced data analysis capabilities
    • Expanded career opportunities
    • Efficient data integration
    • Finance and Banking
    • Retail and E-commerce
    • Manufacturing
    • Energy and Utilities

    What are the essential tools used in Power BI?

    • Power BI Desktop
    • Power Query
    • Power BI Service
    • Power BI Mobile
    • Power BI Gateway
    • DAX (Data Analysis Expressions)

    Are learning materials provided during Power BI training?

    Learning materials are provided during Power BI training, including course manuals, presentation slides, sample datasets, exercise files, and online resources.
    Show More

    Power BI: A Comprehensive Analysis

    A Power BI course provides a comprehensive learning experience on Microsoft's business intelligence and data visualization tool. It covers data transformation, modeling, visualization, and best practices. Students learn to create and customize visuals, create interactive reports, and use advanced DAX queries. They also learn to share and collaborate on Power BI creations, manage access and security, and apply their skills to practical business scenarios. The course also covers advanced topics like data modeling strategies, integration with other Microsoft tools, and Power Query M for data transformations. Our training gives people the knowledge and abilities to use it successfully for data analysis and reporting, improving their capacity to make data-driven decisions and offer insightful information.

    Additional Info

    The Advantages of Enrolling in Power BI Training

    Enrolling in Power BI training can provide numerous advantages, primarily if you work with data or are involved in business intelligence and analytics. Here are some of the critical benefits of enrolling in Power BI training:

    • Improved Data Visualization Skills: You can learn how to make visually appealing and intelligent dashboards and reports with the help of Power BI training. You'll gain skills in designing charts, graphs, and interactive visuals that make it easier to communicate data-driven insights.
    • Enhanced Data Analysis: Power BI offers robust data analysis capabilities. Training will teach you how to effectively manipulate, transform, and clean data, enabling you to extract meaningful insights from complex datasets.
    • Time Efficiency: Learning Power BI can help you develop reports and analyze data in less time. Automation features, like data refresh and scheduled report delivery, can save you hours of manual work.
    • Integration with Multiple Data Sources: Power BI offers the flexibility to establish connections with various data sources, such as databases, cloud services, spreadsheets, and online services. Training will teach you to combine and merge data from diverse sources into a single report.
    • Real-time Data Updates: Power BI allows you to work with real-time data, making it suitable for monitoring key performance indicators (KPIs) and making data-driven decisions as soon as the data is updated.
    • Cross-Platform Compatibility: You can access Power BI on various platforms, including Windows, macOS, iOS, and Android. Training will help you use Power BI effectively across devices and operating systems.
    • Data Security: Understanding Power BI security features is crucial to ensuring the confidentiality and integrity of your data. Training can help you implement security best practices.
    • Career Advancement: Proficiency in Power BI is a valuable skill in the data and analytics job market. Enrolling in training and earning certifications can enhance your career prospects and earning potential.
    • Customization and Advanced Features: Advanced Power BI training can help you master more complex features, such as DAX (Data Analysis Expressions) for custom calculations, Power Query for data transformation, and custom visuals for unique reporting needs.
    • Stay Current with Updates: Power BI continuously evolves, with new features and updates regularly released. Training programs often include information on the latest features and best practices, helping you stay current.

    Career Opportunities for a Certified Power BI Developer

    • Business Intelligence Analyst: As a BI analyst, you'll work with business stakeholders to gather requirements, design data models, and create interactive Power BI dashboards and reports. Your goal is to provide valuable insights to support decision-making within the organization.
    • Data Analyst: Data analysts use Power BI and Tableau to analyze and interpret data, identify trends, and produce reports that help organizations make informed decisions. You may work with various data sources and develop visualizations to communicate findings effectively.
    • Data Visualization Specialist: If you have a knack for creating compelling and easy-to-understand visualizations, you can specialize in data visualization. Your expertise with Power BI can help organizations present data visually appealingly to enhance understanding.
    • Data Engineer: Data engineers focus on building and maintaining data pipelines, ETL (Extract, Transform, Load) processes, and data warehouses. A Power BI developer with data engineering skills can be valuable in ensuring data quality and availability for reporting.
    • BI Developer: Designing, creating, and managing business intelligence solutions, such as Power BI reports and dashboards, is the responsibility of BI developers. They collaborate with data engineers and analysts to ensure a smooth data flow.
    • Data Scientist: Data scientists use advanced analytics and machine learning approaches to extract ideas from data. Power BI can be integrated into data science workflows to visualize and communicate results effectively.
    • Data Analyst Manager: With experience, you can move into a management role where you oversee a team of data analysts or BI developers. Your responsibilities may include project management, resource allocation, and strategic planning.
    • Specialized Industries: Many different sectors, including healthcare, banking, retail, and manufacturing, are in need of people with Power BI expertise. You can find opportunities in these sectors, tailoring your skills to meet industry-specific needs.

    Exploring the Growth of Power BI Technology

    Microsoft's business intelligence and data visualization product, Power BI, has witnessed significant growth and development since its release. There are various reasons for its success, including:

    • Microsoft's Investment: Microsoft has consistently invested in the development and improvement of Power BI. Regular updates and new features are rolled out, keeping the tool competitive and in line with industry trends.
    • User-Friendly Interface: Business users may generate interactive reports and dashboards using Power BI's user-friendly interface without having to have deep technical expertise. This ease of use has contributed to its widespread adoption.
    • Integration with Microsoft Ecosystem: Power BI seamlessly integrates with other Microsoft products like Excel, SharePoint, Azure, and SQL Server. This integration simplifies data preparation, sharing, and collaboration for organizations already using Microsoft technologies.
    • Cloud-Based Solutions: Microsoft offers Power BI as both a cloud-based service (Power BI Service) and an on-premises solution (Power BI Report Server). The cloud-based option has gained significant popularity due to its scalability and accessibility.
    • AI and Machine Learning Integration: Power BI incorporates artificial intelligence and machine learning capabilities for data analysis. Features like automated insights and AI-powered visuals make it easier to uncover valuable insights from data.
    • Data Connectivity: Power BI offers a wide variety of data connectors, enabling users to connect to many data sources, including databases, cloud services, and web applications. This versatility makes it suitable for diverse industries and use cases.
    • Customization and Extensibility: Power BI offers extensive customization options, allowing developers to create custom visuals and implement custom business logic using Power Query, DAX (Data Analysis Expressions), and custom JavaScript.
    • Enterprise Adoption: Many large enterprises have adopted Power BI as their primary BI tool due to its scalability, governance features, and security capabilities. Power BI Premium and Power BI Premium Per User (PPU) are tailored for enterprise-level usage.
    • Regular Updates: Microsoft consistently releases monthly updates and feature enhancements to Power BI, ensuring that it remains competitive and up-to-date with industry trends and user needs.

    Key Tools in Power BI Development and Management

    Power BI development and management involve a set of key tools and components that enable users to create, deploy, and maintain Power BI solutions. These tools cater to different aspects of the Power BI lifecycle, from data preparation to report creation and distribution. Here are some essential tools for Power BI development and management:

    • Power BI Desktop: The main tool for developing interactive reports and dashboards is Power BI Desktop. It provides a user-friendly interface for designing data models, creating visualizations, and building reports. You can also use Power Query and DAX expressions within Power BI Desktop for data transformation and calculations.
    • Power BI Service (Power BI Web): Power BI Service, accessible through a web browser, is the cloud-based platform where you publish, share, and collaborate on Power BI reports and dashboards. It allows you to create workspaces, share content with colleagues, and schedule data refreshes.
    • Power BI Mobile App: Utilizing the Power BI Mobile app, users can conveniently access and engage with Power BI reports and dashboards via their mobile devices. It provides a responsive and touch-friendly interface for on-the-go data consumption.
    • Power BI Gateway: The Power BI Gateway is a critical tool for connecting on-premises data sources to Power BI Service. It facilitates secure data refresh from local databases or files to the cloud-based Power BI Service. There are two types of gateways: On-premises data gateway and Power BI Gateway for Enterprise.
    • DAX Studio: DAX (Data Analysis Expressions) Studio is an external tool that assists in writing, testing, and optimizing DAX formulas. It provides a more advanced and developer-friendly environment for working with DAX than the built-in formula bar in Power BI Desktop.
    • SQL Server Data Tools (SSDT): SSDT is used for developing SQL Server Analysis Services (SSAS) models, including Tabular models, which can be imported into Power BI. It's especially useful for organizations working with complex data models.
    • Power BI REST API: The Power BI REST API allows developers to programmatically interact with Power BI resources, such as workspaces, datasets, and reports. It's commonly used for automation, custom integration, and embedding Power BI content into custom applications.
    • Power BI Admin Portal: For administrators, the Power BI Admin Portal is used to manage Power BI tenant settings, monitor usage, configure security policies, and set up data loss prevention (DLP) policies to control data sharing.
    • Power BI PowerShell Module: PowerShell cmdlets provide automation capabilities for managing Power BI workspaces, datasets, reports, and more. It's particularly useful for bulk operations and administration tasks.
    • Azure Data Factory: Azure Data Factory can be used alongside Power BI to create ETL (Extract, Transform, Load) pipelines for data integration and transformation before it's loaded into Power BI. It's valuable when dealing with complex data scenarios.
    Show More

    Key Features

    ACTE Hyderabad offers Power BI Training in more than 27+ branches with expert trainers. Here are the key features,
    • 40 Hours Course Duration
    • 100% Job Oriented Training
    • Industry Expert Faculties
    • Free Demo Class Available
    • Completed 500+ Batches
    • Certification Guidance

    Authorized Partners

    ACTE TRAINING INSTITUTE PVT LTD is the unique Authorised Oracle Partner, Authorised Microsoft Partner, Authorised Pearson Vue Exam Center, Authorised PSI Exam Center, Authorised Partner Of AWS .
     

    Curriculum

    Syllabus of Power BI Course in Hyderabad
    Module 1: Introduction to Power BI
    • Introduction to Business Intelligence (BI)
    • Stages of business intelligence (BI)
    • Use cases of BI
    • Various BI tools
    • Overview of Data warehouse & concepts
    • Introduction to Power BI
    • Why Power BI
    • Power BI Components
    • Power BI pricing structure
    • Building blocks of Power BI
    • Architecture of Power BI
    • Power BI vs Tableau vs QlikView
    • Introduction of Power BI Desktop
    • Installation of Power BI Desktop
    • The key features of Power BI workflow
    • Process of creating reports in Power BI
    Module 2: Data Extraction
    • Overview of Power BI desktop
    • Data sources in Power BI
    • Using files (excel, pdf, csv, etc.) as a data source
    • Using SaaS connectors
    • Extracting data from folders, and databases
    • Working with Azure SQL database and database sources
    • Connecting to Analysis Services
    • Other data sources (OData, web, SharePoint etc.)
    • Python & R script in Power BI
    • Introduction of power query editor
    • Advance editor
    • Query dependency editor
    Module 3: Data Transformation – Shaping & Combining Data
    • Shaping data using Power Query Editor
    • Formatting data
    • Transformation of data
    • Understanding of Data types
    • Data profiling for data quality check
    • Naming conventions & best practices to consider
    • Identify and create appropriate keys for joins
    • Working with Parameters
    • Merge Query
    • Append Query
    • Group by of data (aggregation of data)
    • Applied steps (query settings)
    • Duplicate & Reference tables
    • Transpose of data
    • Fill
    • Pivot & Un-pivot of data
    • Custom columns
    • Conditional columns
    • Replace data from the tables
    • Split columns values
    • Move columns & sorting of data
    • Detect data type, count rows & reverse rows
    • Promote rows as column headers
    • Hierarchies in Power BI
    • M query
    Module 4: Data Modelling & DAX
    • Introduction of relationships
    • Creating relationships
    • Cardinality
    • Cross filter direction
    • Use of inactive relationships
    • Introduction of DAX
    • Why DAX is used
    • DAX syntax
    • DAX functions
    • Context in DAX
    • Calculated columns using DAX
    • Measures using DAX
    • Calculated tables using DAX
    • Learning about table, information, logical, text, iterator
    • Time intelligence functions (YTD, QTD, MTD)
    • Cumulative values, calculated tables, and ranking and rank over groups
    • Date and time functions
    • Identify poorly performing measures, relationships, and visuals
    • DAX advanced features
    Module 5: Data Visualization With Analytics
    • Deep dive into Power BI data visualization
    • Understanding Power View and Power Map
    • Data visualization techniques
    • Page layout & Formatting
    • Power BI Desktop visualization
    • Formatting and customizing visuals
    • Visualization interaction
    • Custom visualization in Power BI
    • Top-down and bottom-up analytics
    • Drill down
    • Drill through
    • Page navigations
    • Bookmarks
    • Selection pane to show/hide visuals
    • Comparing volume and value-based analytics
    Module 6: Power BI Service (Cloud), Q & A and Data Insights
    • Introduction to Power BI Service
    • Introduction of workspaces
    • Dashboard
    • Creating & Configuring Dashboards
    • Dashboard theme
    • Reports vs Dashboards
    • Building workspace Apps
    • Sharing reports & dashboards
    • configure subscriptions and data alerts
    • Paginated report
    • Introduction to Power Q & A
    • Ask questions about your data using Natural Query Language
    • Getting answers in the form of charts, graphs, and data discovery methodologies
    • Configure custom questions for Q&A like FAQ
    • Ad-hoc analytics building
    • Power Q&A best practices
    • Quick Ins
    • Subscribe, Alerts, Usage statics, Related content
    • Design reports on Power BI Service
    • Collaboration using Power BI Service
    Module 7: Power BI Settings, Administration & Direct Connectivity
    • Getting to understand Power BI Desktop settings
    • Aggregating data from multiple data sources
    • Power BI Service settings
    • Power BI Admin Portal
    • Administration activities
    • Power BI usage analysis
    • Introduction of Office 365 admin activities
    • Introduction of Data Gateway
    • Installation & Configuration of data gateways
    • Scheduling auto data refresh
    • Managing groups, row-level security, datasets, reports, and dashboards
    • Real time data analysis using Direct Connectivity
    • Direct Query vs Import Mode
    Module 8: Embedded Power BI With API & Power BI Mobile
    • Introduction to embedded Power BI
    • Create embedded code
    • Manage embedded code
    • Integration of Power BI in SharePoint
    • Introduction of Power BI API
    • Power BI Embedded playground
    • Introduction to Power BI Mobile
    • Creating mobile based reports & dashboards
    • Optimizing report for Power BI mobile app
    • Features of Power BI mobile app
    • Introduction of integrating Power BI & Excel
    • Power BI Analyze in Excel
    Module 9: Power BI Advance & Power BI Premium
    • Introduction of Power BI Premium
    • Power BI Premium per user
    • Power BI Premium features
    • Introduction to Data Flow
    • Create Data Flow
    • Advantages of Data Flow
    • Create reports using Data Flow
    • Introduction to Power BI Deployment Pipelines
    • Create Deployment Pipelines
    • Benefits of Deployment Pipelines
    • Introduction of Sensitivity Labels
    • Introduction of Power BI Goals feature
    • Incremental data load in Power BI
    • use AI visuals
    • use the Forecast feature
    • Power BI best practice rules to improve performance
    Show More
    Show Less
    Need customized curriculum?

    Hands-on Real Time Power BI Projects

    Get a Valuable Power BI Course With Placement

    Upon completing training at ACTE, every professional has the opportunity to enrich their learning experience through job placements. Some of our students have secured positions with major MNCs.

    • Students can refine their interview skills through mock interview sessions included in our Power BI course.
    • We offer continuous guidance and support to give our students a competitive advantage in the job market.
    • Our curriculum is thoughtfully composed to ensure students understand critical topics that align with current industry requirements.
    • Our Power BI course with placement program provides students with essential data analysis and visualization skills using Power BI.
    • In addition to Power BI training, we help with interview preparation, resume building, and job search strategies to empower students in their career pursuits.
    • Our students gain access to promising job opportunities Through strong partnerships with well-known companies such as HCL, Wipro, Dell, Accenture, Google, TCS, and IBM.

    Obtain Our Innovative Power BI Certification

    A Power BI Certification offers a comprehensive understanding of Microsoft's business analytics and data visualization tools. It covers topics like data sources, data transformation, and visualizations. The course emphasizes mastering DAX (Data Analysis Expressions), Power Query, and data integration with other tools. Completing a Power BI certification furnishes individuals with valuable data analysis and visualization skills in high demand across industries. This proficiency can lead to career advancement opportunities, making individuals more attractive to potential employers. Additionally, being certified in Power BI demonstrates a commitment to staying current with the latest data analytics technologies, which can be a competitive advantage in the job market.

    • Microsoft Certified: Data Analyst Associate
    • Microsoft Certified: Power BI Certified User
    • Microsoft Certified: Power BI Certified Expert
    • Microsoft Certified: Power BI Certified Master
    A Power BI certification can significantly boost your attractiveness to potential employers across various industries. It's essential to highlight real-world projects, build a robust portfolio, and actively seek job opportunities to bolster your certification's impact on your career prospects.
    • Foundational Knowledge in Data Analysis Concepts
    • Familiarity with Power BI Desktop
    • Understanding of Data Modeling Techniques
    • Knowledge of Data Analysis Expressions (DAX)
    • Basic Data Visualization Skills
    Acquiring Power BI certifications enhances career growth, job attractiveness, marketability, and career opportunities in data analysis and visualization.
    • Data Analyst
    • Business Intelligence Developer
    • BI Consultant
    • Data Visualization Specialist
    • Financial Analyst

    Complete Your Course

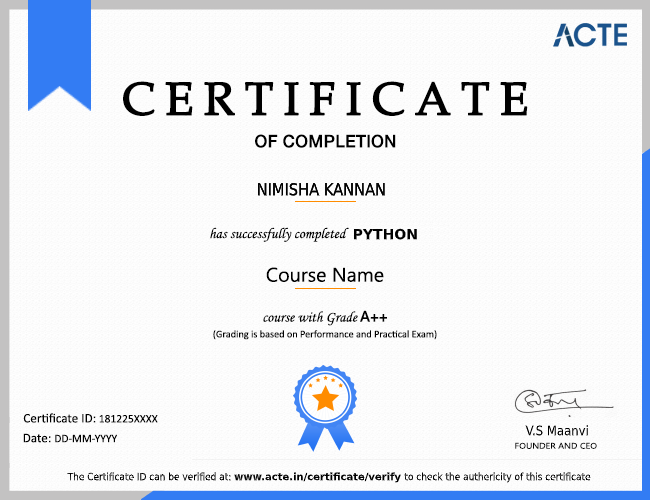
    a downloadable Certificate in PDF format, immediately available to you when you complete your Course

    Get Certified

    a physical version of your officially branded and security-marked Certificate.

    Get Certified

    Expert Power BI Trainers for Comprehensive Learning

    • Our Power BI trainers has over 8 years of data analysis and visualization expertise.
    • Our educators conduct hands-on, interactive training sessions built upon their deep knowledge of Power BI concepts.
    • Trainers actively assist students in securing positions through networking and internal job placement support.
    • Professionals in Power BI deliver comprehensive instruction in data visualization, report creation, and data analysis.
    • Our Power BI course in Hyderabad highlights practical exercises and real-world scenarios to enhance problem-solving skills.
    • To provide students with industry understanding, our Power BI professors continually stay up-to-date on the latest trends in data analysis techniques.

    Power BI Course FAQs

    Who are the course instructors, and how are they selected?

    At ACTE, all instructors have a minimum of 10–12 years of relevant IT experience. As they work in live corporate environments, they ensure the training is up-to-date and based on real industry knowledge. The instructors in this training are selected based on their expertise, teaching, and hands-on experience to give adequate quality and practical training according to industry standards.
    Yes, ACTE offers practice tests to assist learners in identifying and remedying their knowledge of Power BI. Practice tests are good tools for tracking progress and preparing learners for real-world situations.
    • ACTE is a legend in offering placement to students. Please visit our Placed Student list on our website.
    • We have solid working relationships with more than 700+ of the world's leading multinational corporations, including SAP, Oracle, Amazon, HCL, Wipro, Dell, Accenture, Google, ZOHO, TCS, IBM, and more.
    • More than 3500+ students placed last year in India & Globally. Our Placement Cell supports you till you get placed in a better MNC.
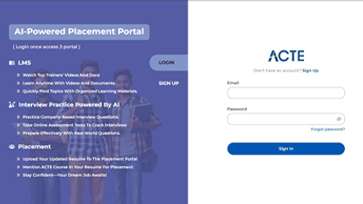
    • Please Visit Your Student Portal. Here, the FREE Lifetime Online Student Portal helps you to access Job Openings, Study Materials, Videos, Recorded sections, & Top MNC Interview Questions.
    Yes, we offer job assistance upon course completion
    • Practical Experience
    • Hands-On Projects
    • Resume Preparation
    • Aptitude and Technical Skills
    • Mock Interviews
    • Group Discussions
    To enroll in ACTE's Power BI course, visit their website, navigate to the course page, and click Enroll Now. Fill out the form, choose your preferred batch timing, and start your Power BI journey today!
    The ACTE Power BI Master Program is aimed at enabling students with immersive learning in the field of Power BI, particularly in data visualization, modelling, and business analytics. Come and acquire practical hands-on skills in designing dashboards, reports, and actionable insights using Power BI tools. Work on real-world projects, demonstrating how to transform data into valuable business intelligence-preparing you to excel in a successful career in data analysis and analytics.
    The ACTE certification is proof of mastery and knowledge in particular fields, thus offering more opportunities for a better career. However, its worth might differ according to employers' preferences, industry, and whether it addresses the requirements concerning a particular job role.
    • Basic Understanding of Data Analysis
    • Familiarity with Microsoft Excel
    • Knowledge of Databases and understanding of Data Visualization Concepts
    • Analytical and Problem-Solving Skills
    Yes, Most of our training programs work on actual projects. Such hands-on experience will ensure participants gain practical skills while comprehending and understanding real-life scenarios, making them highly employable and well-prepared for professional assignments.
    Recorded classes are available if you can't attend a class at ACTE, or you can work on a schedule with a make-up lesson. We also enable you to catch up on any missed content with resources and training materials.
    Our Power BI course is custom-fit to suit your schedule, with options such as one-on-one lessons, fast-track classes, customized courses, and online learning.
    Enroll in ACTE's Power BI training to benefit from a comprehensive curriculum, expert instructors, industry-relevant training, real-world projects, certification, job placement support, and a collaborative learning environment that will set you up for success in the field.
    Absolutely! The Power BI course provides lots of hands-on practice, real-world projects, and group discussions. It also features mock interviews and group activities to help participants hone their skills and improve their readiness for the job market. The participant learns to overcome technical challenges so that being productive in a collaborative and team-oriented environment is possible.
    Yes, we give students lifetime access to the study materials, videos, and top MNC interview questions on the Student’s Portal.
    We offer recorded video lessons for the training. After you complete the payment and enroll in the course, you will gain access to the pre-recorded sessions through our course platform, allowing you to watch them at your own pace.
    The salary for a Power BI professional typically ranges from 5 lakhs to 15 lakhs per year.
    Yes, learning Power BI is pretty easy, especially for people with Excel or data analysis backgrounds. The simple interface and the drag-and-drop functionality used to create interactive reports and dashboards make it easy to use. With numerous online courses, tutorials, and hands-on practice available, you can quickly grasp the concepts and start visualizing data effectively.
    • Data Connectivity
    • Data Visualization and Modeling
    • Data Visualization
    • Data Sharing and Collaboration
    Yes, Power BI is an ideal tool for freshers. Its intuitive, user-friendly interface allows you to create reports and visualizations without needing advanced technical skills. Freshers with a basic knowledge of Excel and data analysis can quickly learn Power BI and start working with real-world data.
    The best use of Power BI is that it can source raw data and convert it into incredibly valuable insights via interactive dashboards and reports. It is generally applied in analytics to help organizations assess data, track performance, and make informed decisions. Power BI specifically does an excellent job of visually communicating key metrics and trends in reports customized to a business's needs.
    Show More
    Request for Class Room & Online Training Quotation

          Job Opportunities in Power BI

          More Than 35% Of Developers Prefer Power BI. Power BI Is The Most Popular And In-Demand In The Tech World.

          Related Category Courses

          Informatica training acte
          Informatica Training in Chennai

          Beginner & Advanced level Classes. Hands-On Learning in Informatica. Best Read more

          Tableau Software training acte
          Tableau Training in Chennai

          Beginner & Advanced level Classes. Hands-On Learning in Tableau. Best Read more

          cognos training acte
          Cognos Training in Chennai

          Beginner & Advanced level Classes. Hands-On Learning in Cognos. Best Read more

          obiee training acte
          OBIEE Training in Chennai

          Beginner & Advanced level Classes. Hands-On Learning in OBIEE. Best Read more

          hadoop training acte
          Hadoop Training in Chennai

          Beginner & Advanced level Classes. Hands-On Learning in Hadoop. Best Read more

          java-acte
          SAS Training in Chennai

          Beginner & Advanced level Classes. Hands-On Learning in SAS. Best Read more

          web designing training acte
          Web Designing Training in Chennai

          Live Instructor LED Online Training Learn from Certified Experts Beginner Read more