Power BI Training in Tiruchirappalli | Best Power BI Certification Course
Home » Bi & Data Warehousing Courses Tamil Nadu » Power BI Training in Tiruchirappalli

Power BI Training in Tiruchirappalli

(5.0) 5988 Ratings 6023Learners

Live Instructor LED Online Training

Learn from Certified Experts

  • Beginner & Advanced level Classes.
  • Hands-On Learning in Power BI.
  • Best Practice for interview Preparation Techniques in Power BI.
  • Lifetime Access for Student’s Portal, Study Materials, Videos & Top MNC Interview Question.
  • Affordable Fees with Best curriculum Designed by Industrial Power BI Expert.
  • Delivered by 9+ years of Power BI Certified Expert | 12402+ Students Trained & 350+ Recruiting Clients.
  • Next Power BI Batch to Begin this week – Enroll Your Name Now!

Price

INR18000

INR 14000

Price

INR 22000

INR 18000

Have Queries? Ask our Experts

+91-7669 100 251

Available 24x7 for your queries
07-Oct-2024
Mon-Fri

Weekdays Regular

08:00 AM & 10:00 AM Batches

(Class 1Hr - 1:30Hrs) / Per Session

09-Oct-2024
Mon-Fri

Weekdays Regular

08:00 AM & 10:00 AM Batches

(Class 1Hr - 1:30Hrs) / Per Session

05-Oct-2024
Sat,Sun

Weekend Regular

(10:00 AM - 01:30 PM)

(Class 3hr - 3:30Hrs) / Per Session

05-Oct-2024
Sat,Sun

Weekend Fasttrack

(09:00 AM - 02:00 PM)

(Class 4:30Hr - 5:00Hrs) / Per Session

    Hear it from our Graduate

    Have Cracked Their Dream Job in Top MNC Companies

    Learn From Experts, Practice On Projects & Get Placed in IT Company

    • 100% Guaranteed Placement Support for Freshers & Working Professionals
    • You will not only gain knowledge of Power BI Certification and advanced concepts, but also gain exposure to Industry best practices
    • Experienced Trainers and Lab Facility
    • Power BI Professional Certification Guidance Support with Exam Dumps
    • Practical oriented / Job oriented Training. Practice on Real Time project scenarios.
    • We have designed an in-depth course so meet job requirements and criteria
    • Resume & Interviews Preparation Support
    • Concepts: Quick Start Power BI Service, Dashboards and Reports, Data with Power BI Desktop, Modelling with Power BI, Power BI Desktop Visualisations, Publishing and Sharing, Refreshing Datasets, Power BI and Excel Together.
    • START YOUR CAREER WITH Power BI CERTIFICATION COURSE THAT GETS YOU A JOB OF UPTO 5 TO 12 LACS IN JUST 60 DAYS!
    • Classroom Batch Training
    • One To One Training
    • Online Training
    • Customized Training
    • Enroll Now

    About Power BI Training Course in Tiruchirappalli

    Power BI users have a range of potential careers including data scientists, product managers, and business analysts. Understanding power query, the role played by data warehouses, and everything from Microsoft flow to self-service analytics makes knowledgable users valuable resources for a variety of organizations. Analysts use the robust platform to discover key insights that can change the course of a business or organization for the better. ACTE Imparts Power BI Class Room & Online Training Course Enroll Now!!!

    Most Job Oriented Power BI Topics Covered
    • Business Intelligence

      Data Analysis & Visualization

      Power BI Service & Data

    • Shaping and Combining Data

      Modeling Data

      Interactive Data Visualizations

    • Direct Connectivity

      Development with Power BI

      Power BI Mobile

    If you're having a small business, then Power BI is the best option for you. It is quite cheaper and provide all the necessary features to fulfill the small and medium business needs. On the other hand, if your business is large enough then you should about for Tableau.

    Power BI with the onset of data analytics and visualization in enterprises, the professionals with these skills has way better prospects than their peers. In the sphere of business intelligence and data visualization, Power BI lead the way.

    PowerBI is one of the best tools to learn in your career irrespective to your background field of commerce or science.

    And talking about its scope, if you are willing to go in any micromanagement or Project management post in the future, you need some basic data analytics tools to learn, as to make any reports and presentations, you have to use some Business intelligence tools and PowerBI is one of the easiest tools to learn and apply in your day to day usage!

    Even as a fresher, you can get a job in Power BI domain. Power BI with the onset of data analytics and visualization in enterprises, the professionals with these skills has way better prospects than their peers. In the sphere of business intelligence and data visualization, Power BI lead the way.

    We are happy and proud to say that we have strong relationship with over 700+ small, mid-sized and MNCs. Many of these companies have openings for Power BI. Moreover, we have a very active placement cell that provides 100% placement assistance to our students. The cell also contributes by training students in mock interviews and discussions even after the course completion.

    Well, users can use Power BI for free. However, the best of Power BI can be availed with the Power BI Pro subscription account. This can be purchased from the Microsoft Store. The subscription account basically offers an enhanced version of several features that are available with the Power BI free account. Most business users use a subscribed account as it offers more data refreshes per day and other features as compared to the free version.

    • Below are the minimum Prerequisite For Power BI.
    • Windows 7 / Windows Server 2008 R2, or later
    • .NET 4.5
    • Internet Explorer 9 or later.
    • Memory (RAM): At least 1 GB available, 1.5 GB or more recommended.
    • Display: At least 1440x900 or 1600x900 (16:9) recommended. Lower resolutions such as 1024x768 or 1280x800 are not recommended, as certain controls (such as closing the startup screen) display beyond those resolutions.
    • Windows Display settings: If your display settings are set to change the size of text, apps, and other items to more than 100%, you may not be able to see certain dialogs that must be closed or responded to in order to proceed using Power BI Desktop. If you encounter this issue, check your Display settings by going to Settings > System > Display in Windows, and use the slider to return display settings to 100%.

    Power BI is a set of tools that allows non-technical folks to perform the kinds of analytics previously reserved for technical specialists or IT departments. Power BI changes that. Any analyst can connect to any data source and quickly summarize findings into a simple report, no programming required.

    It offers Data modelling capabilities including data preparation, data discovery and interactive dashboards. As such there is no prior Technical Knowledge required to learn Power BI. However if you have an experience with fundamental understanding of Microsoft Excel and formulas will be an advantage.

    Our course ware is designed to give a hands-on approach to the students in Power BI. The course is made up of theoretical classes that teach the basics of each module followed by high-intensity practical sessions reflecting the current challenges and needs of the industry that will demand the students’ time and commitment.

    Yes It is worth , Future will be bright. As a business intelligence tool, Power BI offers the team an excellent visual analytics capabilities. With the right data and platform, it can be an excellent fit for in your efforts to use data to boost efficiency and productivity within an organization.

    Power BI is very user friendly and free to play with. I also recommend learning some database stuff. ... Tableau offers a cheaper option to start (10 a month for users, 70 a month for creators). All I can really recommend is if you start showing off the power of these tools, people are going to want them deployed quickly.

    Power BI Typically, such training will run for just about two to three days. In my case, I took a 3-day training since I really want to master the basics and advanced features of the tool.

    Top reasons to consider a career in Power BI?

    Power BI is highly compressed and performant.

    Power BI has a brand new visualisation engine.

    Power BI also has open source visualisations.

    Power BI is built for users familiar with Excel, but it’s not Excel.


    Why Use Power BI

    Power BI is Microsoft’s interactive data visualization and analytics tool for business intelligence (BI). You can use it to pull data from a wide range of systems in the cloud and on premises and create dashboards that track the metrics you care about the most, or drill in and (literally) ask questions about your data. You can create rich reports or embed dashboards and reports into reporting portals you already use. The dashboards, reports and visualizations you can create go far beyond bar and pie charts, but you don’t need to be a designer to use them. Here’s how to get more insights from the information you already have, in more areas than you might expect.

    Visualize the services you use

    • Power BI has hundreds of content packs, templates and integrations for hundreds of data services, apps and services that include pre-set reports and visualisations — and not just Microsoft ones like Dynamics 365 and SQL Server.
    • If you use Xero for accounting, or K2 Cloud to build business processes, or Adobe Marketing Cloud, SAP HANA, Salesforce, MailChimp, Marketo or Google Analytics, or even GitHub, you can use Power BI to visualize the data you have in those services, create reports against them and bring them together in a custom dashboard. You can also set up the on-premises gateway to use Power BI to explore data sets on your own servers.
    • That way you can compare website visitors with sales, or see which promotions have brought in new customers. You can create your own reports and visualizations, perform calculations (Power BI calls these calculated measures) and set access levels for individual users, data sources, or specific dashboards and reports to control who can view more sensitive information.

    Tell stories with your data

    • Charts are great for numbers, but if you want to show information that changes over time in a way that’s easy to understand, try the new Timeline Storytellercustom visual for Power BI.
    • You can create a linear list of dates or times, or lay them out in circles, spirals, grids or custom shapes.
    • You can also show a chronological list, a sequence that shows the duration of events, or pick relative or logarithmic scales.
    • Pick how to best represent, scale and lay out your data and Power BI will build a timeline from it; use that to tell the history of your business, show how demand is growing, or explain anything else in which the sequence of events matters.

    Explore ‘What-ifs’

    • You can compare different scenarios in Excel, but Power BI lets you do it by dragging a slider bar to show changes.
    • Add a calculated measure for a figure such as revenue and you can use the New Parameter button in Power BI Desktop to add parameters that change in your What-if scenario – setting the data type, minimum, maximum and increments.
    • That creates a calculated measure that you can reference in other calculated measures; so if you create a What-if parameter for the number of customers who respond to a particular promotion you can plug that into a formula that you create to show how many customer support tickets you can expect to have to deal with. Tick “Add slider to this page” in the What-if parameter dialog to add a slider bar that you can drag to show the difference when the number of customer responses is higher or lower.

    Ask questions in real time

    • Instead of designing charts and reports, use the natural language features of Power BI to ask questions and get visualizations in response. You can specify the way the data is presented — ask for “total sales by region by month as a line” — or let Power BI pick a layout that suits the data with a more general question like “what were the sales numbers for last quarter?”
    • If there are tiles pinned to the dashboard, Q&A will suggest those as questions, and as you type a question it will suggest terms you could add based on the tables in the data set.
    • If the question turns out to be extremely useful, you can pin the visualization to the dashboard, making this an easy way to create visualizations for a data set.
    • If you own the data set, you can also add featured questions in the dashboard settings.
    • Q&A uses the names of tables, columns and calculated fields in the data sets; if the column is called arearather than region, you’d need to ask for “sales by area” unless you add synonyms, and table names like CustomerSummary will make Q&A less natural than names like Customers (even though Q&A would know that’s the table you want if you ask about “customer summaries in Chicago” because it can break words up and understand plurals).
    • Power BI Q&A works in the Power BI website and the iOS Power BI app.

    It can work on data stored in an Excel table (or in a database via the on-premises gateway if you enable Q&A for the data set) or you can use Power Pivot to optimize the data set for Q&A. Make sure all the tables in your data set are joined correctly, check data types for dates and numbers, and create the default field set for columns and default label for tables to tweak the columns displayed and the type of graph or chart Q&A will show.

    Custom visualizations

    • Power BI includes a good range of visualizations, and you can add more, either by downloading them from the Office Storeor by creating your own with the open source Power BI Custom Visual Tool (which uses CSS, TypeScript and NodeJS).
    • The Office Store includes vizualisations from Microsoft, like word clouds, a correlation plot based on R script, chord charts to show interrelationships in a circular matrix, the “box and whisker plot” that highlights outliers, clusters and percentiles to show data that might otherwise get lost in summarized figures like averages, as well as visualisations created by other Power BI customers.
    • You can also link Visio diagramsto Power BI to use those as custom visuals, if you want to analyze progress through workflows and processes.
    • If you have Excel analytics models, you can use Frontline’s Analytic Solver to turn them into custom Power BI visualizations without having to design the custom visual in JavaScript. What you get isn’t a static report; it’s a dynamic model that you can drag and drop different Power BI data sets onto to simulate or optimise different options.

    Fit more data into executive dashboards

    • Different BI users need different levels of information in their visualizations.
    • Managers and business analysts may want a lot of details, but if your executives are tracking 20 or 30 key metrics, maybe for multiple regions around the world, it’s better to present that at a glance with a simple view that shows the target and the actual figure rather than a more complex visualization.
    • That way you can look up information quickly in a meeting without getting lost in too many charts and figures. The Power KPIcustom visualization combines multiple report types into a single tile.

    Power BI is for IT data, too

    • It isn’t only business users who have large amounts of information they need to distil down for insights; you can use Power BI to visualize data for IT monitoring tools. T
    • The Power BI solution template for Azure Activity Logsuses an Azure SQL database and Stream Analytics to collect logs and display them using pre-built Power BI Desktop reports, so you can look at trends in usage and problems.
    • There’s also a set of pre-built Power BI reports for the Intune Data Warehousethat shows device details like configurations and compliance state, and a solution template for System Center Configuration Manager with a dashboard that covers client and server health, malware protection levels, software inventory and which devices are missing updates.
    • There are templates for a range of other tools, and you can build your own dashboards and reports for other tools as long as you can get the data into a SQL Server or Azure SQL database.


    Show More

    Key Features

    ACTE Tiruchirappalli offers Power BI Training in more than 27+ branches with expert trainers. Here are the key features,

    • 40 Hours Course Duration
    • 100% Job Oriented Training
    • Industry Expert Faculties
    • Free Demo Class Available
    • Completed 500+ Batches
    • Certification Guidance

    Authorized Partners

    ACTE TRAINING INSTITUTE PVT LTD is the unique Authorised Oracle Partner, Authorised Microsoft Partner, Authorised Pearson Vue Exam Center, Authorised PSI Exam Center, Authorised Partner Of AWS and National Institute of Education (nie) Singapore.


    Curriculum

    Syllabus of Power BI Course in Tiruchirappalli
    Module 1: Quick Start Power BI Service
    • Get Power BI Tools
    • Introduction to Tools and Terminology
    • Dashboard in Minutes
    • Refreshing Power BI Service Data
    • Interacting with your Dashboards
    • Sharing Dashboards and Reports
    • Recap and What's Next
    Module 2: Getting and Transforming Data with Power BI Desktop
    • Introduction to Power BI Desktop
    • Getting Data: Excel vs Power BI Desktop & Service
    • Data Structure for Q&A
    • DirectQuery vs Import Data
    • Recap and What's Next
    Module 3: Modeling with Power BI
    • Introduction to Modeling
    • Setup and Manage Relationships
    • Cardinality and Cross Filtering
    • Default Summarization & Sort by
    • Creating Calculated Columns
    • Creating Measures & Quick Measures
    • Recap and What's Next
    Module 4: Power BI Desktop Visualisations
    • Creating Visualisations
    • Color Formatting
    • Setting Sort Order
    • Scatter & Bubble Charts & Play Axis
    • Tooltips
    • Slicers, Timeline Slicers & Sync Slicers
    • Cross Filtering and Highlighting
    • Visual, Page and Report Level Filters
    • Drill Down/Up
    • Hierarchies
    • Reference/Constant Lines
    • Tables, Matrices & Conditional Formatting
    • KPI's, Cards & Gauges
    • Map Visualizations
    • Custom Visuals
    • Managing and Arranging
    • Drillthrough
    • Custom Report Themes
    • Grouping and Binning
    • Selection Pane, Bookmarks & Buttons
    • Recap and What's Next
    Module 5: Power BI Service Visualisation Tools
    • ntroduction
    • Standalone Tiles
    • Data Driven Alerts
    • Quick and Related Insights
    • custom Q&A questions
    Module 6: Publishing and Sharing
    • Introduction
    • Sharing Options Overview
    • Publish from Power BI Desktop x
    • Publish to Web
    • Share Dashboard with Power BI Service
    • Workspaces and Apps (Power BI Pro)
    • Content Packs (Power BI Pro)
    • Print or Save as PDF
    • Row Level Security (Power BI Pro)
    • Export Data from a Visualization
    • Publishing for Mobile Apps
    • Export to PowerPoint
    • Sharing Options Summary
    Module 7: Refreshing Datasets
    • Understanding Data Refresh
    • Personal Gateway (Power BI Pro and 64-bit Windows)
    • Replacing a Dataset
    • Troubleshooting Refreshing
    Module 8: Power BI and Excel Together
    • Options for Publishing from Excel
    • Pin Excel Elements to Power BI
    • connect to Data using Power BI Publisher/Analyze in Excel
    • Excel 2016 Publish: Upload and Export to Power BI
    • Sharing Published Excel Dashboards
    Show More
    Show Less
    Need customized curriculum?

    Hands-on Real Time Power BI Projects

    Project 1
    BI Presentation Service Project

    This project can consist of Presentation layer catalogs and their associated business model.

    Project 2
    Reporting and Data Access Tools Project

    This project is used to access includes tools for highlighting data on a report.

    Our Top Hiring Partner for Placements

    ACTE Tiruchirappalli offers placement opportunities as add-on to every student / professional who completed our classroom or online training. Some of our students are working in these companies listed below.

    • We are associated with top organizations like HCL, Wipro, Dell, Accenture, Google, CTS, TCS, IBM etc. It make us capable to place our students in top MNCs across the globe
    • We have separate student’s portals for placement, here you will get all the interview schedules and we notify you through Emails.
    • After completion of 70% Power BI training course content, we will arrange the interview calls to students & prepare them to F2F interaction
    • Power BI Trainers assist students in developing their resume matching the current industry needs
    • We have a dedicated Placement support team wing that assist students in securing placement according to their requirements
    • We will schedule Mock Exams and Mock Interviews to find out the GAP in Candidate Knowledge

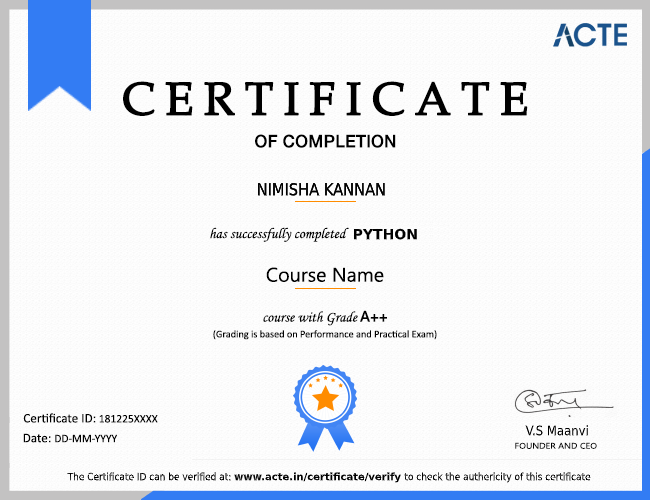
    Get Certified By Power BI & Industry Recognized ACTE Certificate

    Acte Certification is Accredited by all major Global Companies around the world. We provide after completion of the theoretical and practical sessions to fresher's as well as corporate trainees.

    Our certification at Acte is accredited worldwide. It increases the value of your resume and you can attain leading job posts with the help of this certification in leading MNC's of the world. The certification is only provided after successful completion of our training and practical based projects.

    Complete Your Course

    a downloadable Certificate in PDF format, immediately available to you when you complete your Course

    Get Certified

    a physical version of your officially branded and security-marked Certificate.

    Get Certified

    About Experienced Power BI Trainer

    • Our Power BI Training in Tiruchirappalli. Trainers are certified professionals with 7+ years of experience in their respective domain as well as they are currently working with Top MNCs.
    • As all Trainers are Power BI domain working professionals so they are having many live projects, trainers will use these projects during training sessions.
    • All our Trainers are working with companies such as Cognizant, Dell, Infosys, IBM, L&T InfoTech, TCS, HCL Technologies, etc.
    • Trainers are also help candidates to get placed in their respective company by Employee Referral / Internal Hiring process.
    • Our trainers are industry-experts and subject specialists who have mastered on running applications providing Best Power BI training to the students.
    • We have received various prestigious awards for Power BI Training in Tiruchirappalli from recognized IT organizations.

    Power BI Course FAQs

    Looking for better Discount Price?

    Call now: +91 93833 99991 and know the exciting offers available for you!
    • ACTE is the Legend in offering placement to the students. Please visit our Placed Students List on our website
    • We have strong relationship with over 700+ Top MNCs like SAP, Oracle, Amazon, HCL, Wipro, Dell, Accenture, Google, CTS, TCS, IBM etc.
    • More than 3500+ students placed in last year in India & Globally
    • ACTE conducts development sessions including mock interviews, presentation skills to prepare students to face a challenging interview situation with ease.
    • 85% percent placement record
    • Our Placement Cell support you till you get placed in better MNC
    • Please Visit Your Student Portal | Here FREE Lifetime Online Student Portal help you to access the Job Openings, Study Materials, Videos, Recorded Section & Top MNC interview Questions
      ACTE Gives Certificate For Completing A Course
    • Certification is Accredited by all major Global Companies
    • ACTE is the unique Authorized Oracle Partner, Authorized Microsoft Partner, Authorized Pearson Vue Exam Center, Authorized PSI Exam Center, Authorized Partner Of AWS and National Institute of Education (NIE) Singapore
    • The entire Power BI training has been built around Real Time Implementation
    • You Get Hands-on Experience with Industry Projects, Hackathons & lab sessions which will help you to Build your Project Portfolio
    • GitHub repository and Showcase to Recruiters in Interviews & Get Placed
    All the instructors at ACTE are practitioners from the Industry with minimum 9-12 yrs of relevant IT experience. They are subject matter experts and are trained by ACTE for providing an awesome learning experience.
    No worries. ACTE assure that no one misses single lectures topics. We will reschedule the classes as per your convenience within the stipulated course duration with all such possibilities. If required you can even attend that topic with any other batches.
    We offer this course in “Class Room, One to One Training, Fast Track, Customized Training & Online Training” mode. Through this way you won’t mess anything in your real-life schedule.

    Why Should I Learn Power BI Course At ACTE?

    • Power BI Course in ACTE is designed & conducted by Power BI experts with 10+ years of experience in the Power BI domain
    • Only institution in India with the right blend of theory & practical sessions
    • In-depth Course coverage for 60+ Hours
    • More than 50,000+ students trust ACTE
    • Affordable fees keeping students and IT working professionals in mind
    • Course timings designed to suit working professionals and students
    • Interview tips and training
    • Resume building support
    • Real-time projects and case studies
    Yes We Provide Lifetime Access for Student’s Portal Study Materials, Videos & Top MNC Interview Question.
    You will receive ACTE globally recognized course completion certification Along with National Institute of Education (NIE), Singapore.
    We have been in the training field for close to a decade now. We set up our operations in the year 2009 by a group of IT veterans to offer world class IT training & we have trained over 50,000+ aspirants to well-employed IT professionals in various IT companies.
    We at ACTE believe in giving individual attention to students so that they will be in a position to clarify all the doubts that arise in complex and difficult topics. Therefore, we restrict the size of each Power BI batch to 5 or 6 members
    Our courseware is designed to give a hands-on approach to the students in Power BI. The course is made up of theoretical classes that teach the basics of each module followed by high-intensity practical sessions reflecting the current challenges and needs of the industry that will demand the students’ time and commitment.
    You can contact our support number at +91 93800 99996 / Directly can do by ACTE.in's E-commerce payment system Login or directly walk-in to one of the ACTE branches in India
    Show More
    Request for Class Room & Online Training Quotation

        Job Opportunities in Power BI

        More Than 35% Of Developers Prefer Power BI. Power BI Is The Most Popular And In-Demand In The Tech World.

        Related Category Courses

        Informatica training acte
        Informatica Training in Chennai

        Beginner & Advanced level Classes. Hands-On Learning in Informatica. Best Read more

        Tableau Software training acte
        Tableau Training in Chennai

        Beginner & Advanced level Classes. Hands-On Learning in Tableau. Best Read more

        cognos training acte
        Cognos Training in Chennai

        Beginner & Advanced level Classes. Hands-On Learning in Cognos. Best Read more

        obiee training acte
        OBIEE Training in Chennai

        Beginner & Advanced level Classes. Hands-On Learning in OBIEE. Best Read more

        hadoop training acte
        Hadoop Training in Chennai

        Beginner & Advanced level Classes. Hands-On Learning in Hadoop. Best Read more

        java-acte
        SAS Training in Chennai

        Beginner & Advanced level Classes. Hands-On Learning in SAS. Best Read more

        web designing training acte
        Web Designing Training in Chennai

        Live Instructor LED Online Training Learn from Certified Experts Beginner Read more