
Last updated on 15th Jul 2020| 5872
Portfolio Performance Evaluation Methods
The objective of modern portfolio theory is maximization of return or minimization of risk. In this context the research studies have tried to evolve a composite index to measure risk based return. The credit for evaluating the systematic, unsystematic and residual risk goes to Sharpe, Treynor and Jensen.
The portfolio performance evaluation can be made based on the following methods:
- Sharpe’s Measure
- Treynor’s Measure
- Jensen’s Measure
1. Sharpe’s Measure
Sharpe’s Index measure total risk by calculating standard deviation. The method adopted by Sharpe is to rank all portfolios on the basis of evaluation measure. Reward is in the numerator as risk premium. Total risk is in the denominator as standard deviation of its return. We will get a measure of portfolio’s total risk and variability of return in relation to the risk premium. The measure of a portfolio can be done by the following formula:
SI =(Rt – Rf)/σf
Where,
- SI = Sharpe’s Index
- Rt = Average return on portfolio
- Rf = Risk free return
- σf = Standard deviation of the portfolio return
2.Treynor’s Measure
The Treynor’s measure related a portfolio’s excess return to non-diversifiable or systematic risk. The Treynor’s measure employs beta. Treynor based his formula on the concept of characteristic line. It is the risk measure of standard deviation, namely the total risk of the portfolio is replaced by beta. The equation can be presented as follow:
Tn =(Rn – Rf)/βm
Where,
- Tn = Treynor’s measure of performance
- Rn = Return on the portfolio
- Rf = Risk free rate of return
- βm= Beta of the portfolio ( A measure of systematic risk)
The Treynor Ratio, also known as Rewards-to-Volatility Ratio, is a performance metric to determine how much excess return is generated for each unit of the risk taken by a portfolio. In other word, it tries to measure how well an investment has compensated its investors at its given level of risk.
Treynor ratio
- Treynor Ratio was developed by Jack Treynor, an American economist who was one of the inventors of the Capital Asset Pricing Model (CAPM).
- The ratio measures the excess return generated per unit of risk taken by the portfolio. Excess return here means the return earned above the return that could have been earned in a risk-free investment.
- There is no true risk-free investment. So Treasury Bills are often used to represent the risk-free return in the ratio. Risk in the ratio refers to the systematic risk which is measured by the portfolio’s Beta. Beta measures the tendency of a portfolio’s return to change in response to changes in return for the overall market.
- It is a risk assessment tool that calculates the value of an investment adjusted risk by measuring the volatility in the market. In other words, it is a financial equation that investors use to calculate the risk of certain investments taking into account the volatility of the market.
- It aims to adjust all the investment for the market volatility and the risk associated with it, in order to compare investments based on their performance instead of market factors.
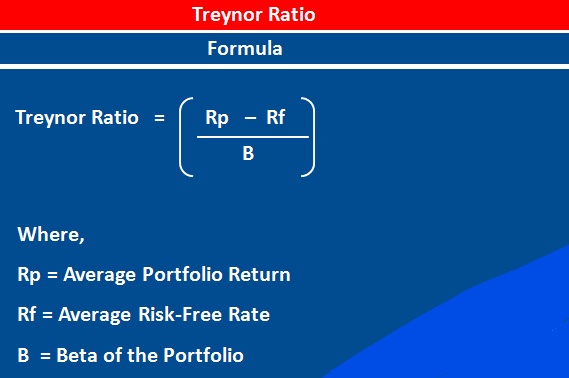
formula
- Treynor Ratio = [Average Portfolio Return – Average Risk Free Rate] / Beta of the Portfolio
TR = [ Rp – Rf ] / B
Where,
- TR = Rp = Return of the Portfolio
- Rf = Risk-Free Rate of Return
- B = Beta of the Portfolio
- Rp represents the actual return of the stock or investment. Rf represents the rate that a risk free investment like Treasure bills is willing to pay. B represents the volatility of the investment portfolio in comparison to the market as a whole.
What is the Treynor ratio and how does it help in evaluating an equity mutual fund?
- Treynor ratio measures the return earned over risk-free return to the portfolio’s market risk. It measures the excess return per unit of market risk. Market Risk of a fund is measured through Beta, which consists of Systematic Risk. Market Risk is non-diversifiable, so Treynor ratio can be best used for funds which are fully diversified and have zero or negligible unsystematic risk. Risk-free return is typically a treasury bill return.
- It can be calculated by the following formula:
Treynor Ratio = (Portfolio Return – Risk Free Return)/Beta of a fund
- Treynor Ratio is useful to compare different MF Schemes on risk-adjusted parameter. it is important to note that we should compare the mutual fund schemes which have the same attributes.
- Fund with a higher Treynor ratio will produce a better risk-adjusted return.
Let’s understand this with an example:
| Mutual Fund A | Mutual Fund B | |
|---|---|---|
| Annual Return | 15% | 12% |
| Risk Free Return | 6% | 6% |
| Fund Beta | 1.5 | 0.8 |
| Treynor Ratio | (15%-6%)/1.5 = 6% | (12%-6%)/0.8 = 7.5% |
| Better Risk Adjusted Return |
In the above example, Fund B has a better risk-adjusted return. However, fund A seems to be a better choice based on a return, but higher returns are due to the high risk taken by that fund.
TreynorRatio :
Calculate Treynor Ratio Or Modified Treynor Ratio Of Excess Return Over CAPM Beta :
The Treynor ratio is similar to the Sharpe Ratio, except it uses beta as the volatility measure (to divide the investment’s excess return over the beta).
Usage
- TreynorRatio(Ra, Rb, Rf = 0, scale = NA, modified = FALSE)
Arguments
- Ra – an xts, vector, matrix, data frame, timeSeries or zoo object of asset returns
- Rb – return vector of the benchmark asset
- Rf – risk free rate, in same period as your returns
scale
number of periods in a year (daily scale = 252, monthly scale = 12, quarterly scale = 4)
Modified
a boolean to decide whether to return the Treynor ratio or Modified Treynor ratio
Details
To calculate modified Treynor ratio, we divide the numerator by the systematic risk instead of the beta.
3. Jensen’s Measure
- Jensen attempts to construct a measure of absolute performance on a risk adjusted basis. This measure is based on the Capital Asset Pricing Model (CAPM) model. It measures the portfolio manager’s predictive ability to achieve higher return than expected for the accepted riskiness. The ability to earn returns through successful prediction of security prices on a standard measurement.
- The Jensen measure of the performance of portfolio can be calculated by applying the following formula:
Rp = Rf + (RMI – Rf) x β
Where,
- Rp = Return on portfolio
- RMI= Return on market index
- Rf= Risk free rate of return
When to use Sharpe Ratio and when to use Treynor ratio…
The big challenge is in knowing when to use the Sharpe ratio and when to use the Treynor ratio. There are some basic rules that you can follow. Since the Treynor ratio uses the Beta as the denominator, it is more suited to well-diversified equity portfolios. Here is why! There are two types of risks in equities. Unsystematic risks focus on company and industry level factors, while Systematic risk focuses on market level factors. Systematic risk is measured by Beta, while Standard Deviation measures the total risk. In a diversified portfolio, the unsystematic risk is diversified away and hence the Treynor ratio is more suitable.
What do fund managers and analysts use more often?
While the Treynor may appear to be a more sophisticated measure of a mutual fund performance, the Sharpe ratio is more popular. There are 2 reasons for the popularity of Sharpe Ratio. Firstly, Sharpe ratio captures the past performance of the fund, whereas Treynor ratio is more useful as an indicator of future performance. Since fund fact sheets are more an evaluation of past performance, they will necessarily disclose the Sharpe ratio but not necessarily the Treynor ratio. Hence Sharpe ratio is more easily available and accessible for investors. Secondly, the Beta is much more intuitive than standard deviation and hence there is a high element of discretion. From a realistic perspective, Sharpe is therefore more popular.
For investors what is important is that both the Sharpe and the Treynor measures give almost similar comparative results over a period of time. What is more essential is that you understand the importance of imputing the risk aspect when evaluating the returns of a fund. That will give you a better handle on how your fund manager is actually performing.
Comparing Treynor Measure and Sharpe Measure
The Sharpe ratio and the Treynor ratio are two ratios used to measure the risk-adjusted rate of return. Both are named for their creators, Nobel Prize winner William Sharpe and American economist Jack Treynor, respectively. While they may help investors understand investments and risk, they offer different approaches to evaluating investment performance. The Sharpe ratio helps investors understand an investment’s return compared to its risk while the Treynor ratio explores the excess return generated for each unit of risk in a portfolio.
Limitations of Each Ratio
There are certain drawbacks to each of these ratios. Where the Sharpe ratio fails is that it is accentuated by investments that don’t have a normal distribution of returns like hedge funds. Many of them use dynamic trading strategies and options that can skew their returns.
The main disadvantage of the Treynor ratio is that it is backward-looking and that i relies on using a specific benchmark to measure beta. Most investments, though, don’t necessarily perform the same way in the future that they did in the past.