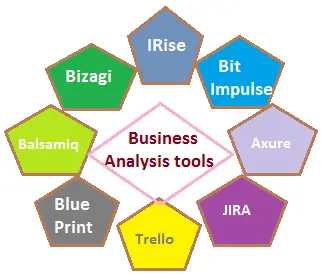
- Overview of Key Business Analysis Tools
- Microsoft Visio for Process Visualization
- Lucidchart for Collaborative Diagrams
- JIRA for Agile Project Management
- Trello & Asana for Workflow Tracking
- Draw.io for Free Business Diagrams
- Tableau & Power BI for Data Insights
- Google Suite for Team Collaboration
Overview of Key Business Analysis Tools
An effective business strategy heavily relies on the use of robust Business Analysis Tools to collect, process, and interpret data for informed decision-making. These tools help organizations identify trends, uncover inefficiencies, and forecast outcomes with greater accuracy. Among the wide array of Business Analytics Software available today, Tableau and Power BI stand out as two of the most powerful and user-friendly platforms. Tableau is renowned for its advanced data visualization capabilities, allowing users to create interactive dashboards that bring complex datasets to life. On the other hand, Power BI, developed by Microsoft, offers seamless integration with various Microsoft products and excels in providing real-time data insights and collaborative analytics, making it a valuable tool often emphasized in Business Analyst Training programs. Both tools support a wide range of data sources and are essential in transforming raw data into meaningful business intelligence. Other key Business Analysis Tools include SWOT analysis, PESTLE analysis, and predictive modeling tools, all of which aid in strategic planning and performance tracking. The integration of these technologies within a company’s analytics ecosystem enhances decision-making, increases operational efficiency, and supports long-term business growth. In today’s data-driven landscape, leveraging advanced Business Analytics Software like Tableau and Power BI is critical to staying competitive and responsive to market dynamics.
Are You Interested in Learning More About Web Developer Certification? Sign Up For Our Business Analyst Online Training Today!
Microsoft Visio for Process Visualization
- Intuitive Diagramming Interface: Visio offers an easy-to-use interface with drag-and-drop functionality, enabling users to quickly build professional process diagrams without needing advanced design skills.
- Integration with Microsoft Tools: Seamless integration with Google Suite and Microsoft 365 apps enhances productivity by allowing users to embed diagrams into documents, presentations, and collaborative platforms concepts often explored in a Business Analysis Tutorial for Beginners.
- Collaboration Across Teams: When used alongside Jira Service Management and Jira Project Management, Visio helps visualize service workflows and project pipelines, improving transparency and coordination.
Microsoft Visio is a powerful diagramming and vector graphics application widely used for creating detailed process maps, organizational charts, and workflow diagrams. It helps businesses visually represent complex processes, making it easier to analyze, improve, and communicate workflows across teams. Especially when integrated with tools like Jira Service Management, Jira Project Management, Google Suite, and Draw.io, Microsoft Visio becomes an essential part of a collaborative and efficient work environment.
Here are six key benefits of using Microsoft Visio for process visualization:

- Extensive Template Library: Visio provides a wide range of pre-built templates for flowcharts, network diagrams, and business process models, speeding up the design process.
- Data-Linked Diagrams: Users can link diagrams directly to real-time data sources, enabling dynamic updates and visual dashboards.
- Alternative Compatibility: While Visio is feature-rich, it’s also compatible with tools like Draw.io, making it easier for teams using different platforms to share and view diagrams collaboratively.
- Flexible Agile Boards: JIRA supports both Scrum and Kanban boards, allowing teams to adapt workflows based on project needs and improve sprint planning.
- Deep Integration Capabilities: JIRA works well with tools like Microsoft Visio for process mapping and Draw.io for system design, enhancing project visualization useful for understanding the various Types Of Business Analytics.
- Streamlined IT Operations: With Jira Service Management, support teams can track incidents, requests, and changes while staying aligned with development efforts.
- Centralized Project Oversight: Jira Project Management offers features for backlog grooming, task prioritization, and release tracking, providing a single source of truth.
- Collaboration with Google Tools: Integration with Google Suite enables document sharing, calendar syncing, and real-time collaboration on project assets.
- Custom Workflows: JIRA’s workflow customization allows teams to design processes that fit specific business needs, improving control and consistency across projects.
- Completely Free and Cloud-Based: Draw.io offers powerful features without any subscription cost and works directly in your browser.
- Easy Integration with Google Suite: It integrates smoothly with Google Drive, Google Docs, and Google Sheets, allowing for real-time sharing and editing.
- Compatible with Microsoft Visio: Users can import and export Visio files, making Draw.io a viable alternative or companion to Microsoft Visio helpful when working with visual representations of data, such as What Is Ordinal Data.
- Useful for Jira Environments: Teams using Jira Project Management or Jira Service Management can embed diagrams directly into Jira issues for better task clarity.
- Wide Range of Templates: It provides extensive templates for various business diagram needs, reducing setup time and ensuring professional results.
- Collaborative Editing: Multiple team members can collaborate on diagrams simultaneously, promoting alignment and faster decision-making.
Lucidchart for Collaborative Diagrams
Lucidchart is a powerful cloud-based diagramming tool designed to enhance collaboration and clarity in visual communication, making it a valuable asset among modern Business Analysis Tools. It allows teams to create flowcharts, process maps, system diagrams, and data models collaboratively in real time, streamlining project planning and analysis. Lucidchart integrates smoothly with popular Business Analytics Software such as Tableau and Power BI, enabling analysts to visualize data flows, business processes, and analytical models with ease. This makes it especially useful for translating complex data insights into clear, actionable visuals that support decision-making across departments. With its intuitive drag-and-drop interface and a wide range of customizable templates, users can quickly build professional diagrams without extensive design expertise. Its cloud-based nature ensures access from anywhere, promoting real-time collaboration across distributed teams an essential skill for those exploring the How To Become A Research Analyst Career Path. In business environments where cross-functional input and agile adjustments are essential, Lucidchart stands out by simplifying the visualization of workflows and system architectures. Whether used to complement data dashboards in Power BI or to structure analytical processes tied to Tableau, Lucidchart enhances communication and understanding across technical and non-technical teams. Overall, it’s an essential tool for any organization leveraging Business Analysis Tools to drive informed, data-backed decisions.
Are You Preparing for Business Analyst Jobs? Check Out ACTE’s Business Analyst Interview Questions & Answers to Boost Your Preparation!
JIRA for Agile Project Management
JIRA is a widely used tool for Agile project management, helping teams plan, track, and manage software development and other projects with efficiency and transparency. It supports Agile methodologies like Scrum and Kanban, making it a preferred choice for tech teams and cross-functional departments. When integrated with tools like Microsoft Visio, Google Suite, Draw.io, Jira Service Management, and Jira Project Management, JIRA becomes even more powerful, enabling seamless communication and workflow visualization.
Here are six key benefits of using JIRA for Agile project management:
Are You Considering Pursuing a Master’s Degree in Business Analyst? Enroll For Business Analyst Masters Program Training course Today!
Trello & Asana for Workflow Tracking
Trello and Asana are two of the most popular tools for workflow tracking and project management, offering intuitive and flexible solutions to help teams stay organized, meet deadlines, and streamline collaboration. As part of a modern suite of Business Analysis Tools, both platforms support task assignments, progress tracking, and deadline management across multiple projects. Trello uses a card-and-board system that makes it easy to visualize tasks in different stages, while Asana offers more structured project views such as lists, timelines, and calendars, making it ideal for tracking both daily operations and long-term goals skills often covered in Business Analyst Training. These tools integrate seamlessly with various Business Analytics Software, including Tableau and Power BI, allowing users to connect project performance data and generate actionable insights. For business analysts and team leads, this integration bridges the gap between operational execution and data-driven decision-making. By connecting Trello or Asana to platforms like Tableau and Power BI, organizations can create dashboards that visualize project timelines, workload distribution, and task completion rates in real time. This enhances transparency, improves accountability, and supports strategic planning. In today’s fast-paced and data-driven business environment, Trello and Asana serve as essential tools within the broader ecosystem of Business Analysis Tools and analytics platforms.

Draw.io for Free Business Diagrams
Draw.io is a free, web-based diagramming tool that allows users to create professional business diagrams without the need for expensive software. It’s an excellent alternative to Microsoft Visio, especially for teams looking for a cost-effective solution with robust functionality. Draw.io supports a wide range of diagram types, including flowcharts, org charts, network diagrams, and process models, making it ideal for various business and project needs. When used in conjunction with tools like Jira Service Management, Jira Project Management, and Google Suite, it enhances collaboration and visual communication.
Here are six key benefits of using Draw.io for business diagrams:
Tableau & Power BI for Data Insights
Tableau and Power BI are two of the leading platforms in the realm of Business Analytics Software, helping organizations extract valuable insights from their data. These tools are integral to modern Business Analysis Tools, enabling businesses to visualize complex datasets, track key performance indicators (KPIs), and make data-driven decisions. Tableau excels in creating highly interactive, visually appealing dashboards that allow users to explore data from various angles, while Power BI, developed by Microsoft, seamlessly integrates with other Microsoft products and provides real-time analytics with deep visualization capabilities. Both platforms empower users to connect to a wide variety of data sources, from spreadsheets to cloud-based databases, and transform raw data into actionable insights concepts that are crucial in understanding Power BI Architecture Explained. With their advanced data modeling and filtering options, Tableau and Power BI support complex analysis, such as trend forecasting, sales performance, and customer behavior, helping businesses identify opportunities and inefficiencies. These tools also foster collaboration, as teams can share reports and dashboards easily. In an era driven by data, utilizing Tableau and Power BI as part of your Business Analytics Software suite is crucial for staying competitive, improving decision-making, and ensuring long-term business growth.
Google Suite for Team Collaboration
Google Suite is a powerful set of cloud-based tools designed to enhance team collaboration and productivity. Offering apps like Google Docs, Google Sheets, Google Drive, and Google Meet, Google Suite enables seamless communication and file-sharing across teams, regardless of location. It’s particularly beneficial for project management and business analysis when integrated with tools like Microsoft Visio, Jira Service Management, Jira Project Management, and Draw.io. Teams can collaborate on documents in real time, track changes, and leave comments, ensuring alignment across tasks and projects skills that are often developed through Business Analyst Training With Google Drive, users can store and share files securely, while Google Meet allows for instant video meetings, making remote collaboration effortless. Integrating Google Suite with Jira Service Management and Jira Project Management improves task management and tracking, as team members can link documents and diagrams directly to Jira tickets. Additionally, Google Suite works well with Draw.io for creating business diagrams and flowcharts, and it also integrates with Microsoft Visio for more detailed process mapping. This synergy of tools helps streamline workflows, improve transparency, and foster collaboration, allowing teams to work more efficiently and make data-driven decisions. In today’s fast-paced business environment, Google Suite is an essential tool for ensuring smooth team collaboration and project success.


