
Last updated on 06th Jun 2025| 13567
- Introduction to Data Warehousing
- What is a Fact Table?
- Types of Fact Tables (Transactional, Snapshot, Accumulating)
- What is a Dimension Table?
- Differences Between Fact Tables and Dimension Tables
- Star Schema vs. Snowflake Schema
- Granularity in Fact Tables
- Relationship Between Fact and Dimension Tables
Introduction to Data Warehousing
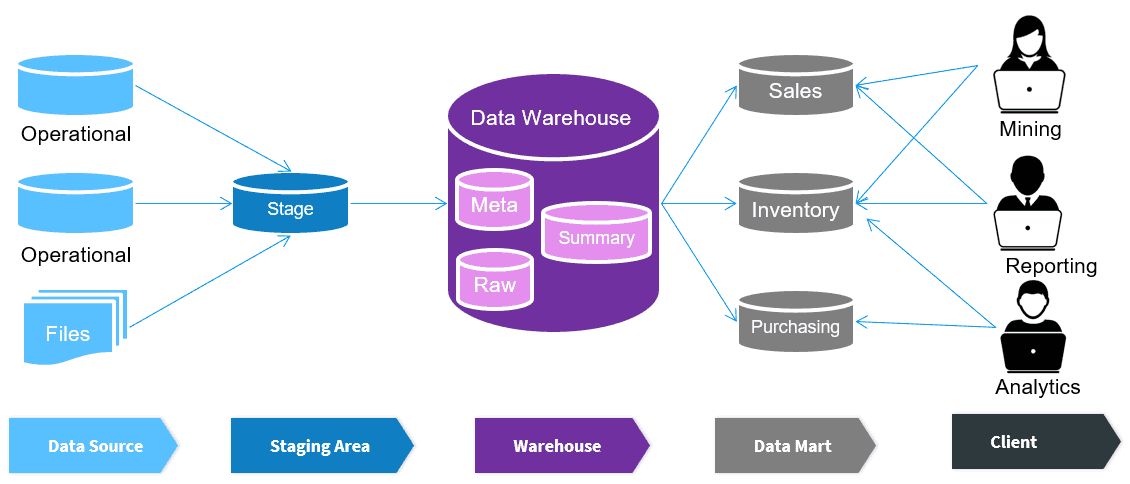
Data warehousing is a critical component of modern data management systems, designed to support business intelligence and decision-making processes. It involves collecting, storing, and managing large volumes of data from multiple sources in a centralized repository. Unlike traditional databases optimized for transaction processing, data warehouses are structured to facilitate efficient querying and analysis of historical data. This centralized approach enables organizations to gain insights, identify trends, and make data-driven decisions. Data in a warehouse is typically cleaned, transformed, and Business Analyst Training organized into a consistent format using Extract, Transform, Load (ETL) processes, ensuring data quality and integrity. The architecture of a data warehouse often includes fact and dimension tables arranged in star or snowflake schemas, optimized for complex analytical queries. Businesses leverage data warehousing to track key performance indicators (KPIs), forecast trends, and generate reports across various departments. With the growth of big data and cloud computing, modern data warehouses are increasingly scalable and capable of handling real-time data integration and analysis. Data warehousing is the backbone of enterprise analytics, enabling organizations to convert raw data into actionable insights, enhance operational efficiency, and maintain a competitive edge in the marketplace.
Are You Interested in Learning More About Business Analyst? Sign Up For Our Business Analyst Training Today!
What is a Fact Table
- Stores Measurable Data: Fact tables contain numerical data like sales amount, profit, quantity sold, or transaction counts that can be aggregated.
- Contains Foreign Keys: Each fact record includes foreign keys that reference the primary keys of related dimension tables (e.g., customer, product, time).
- Supports Analytical Queries: Designed for high-performance analytical operations, fact tables help in summarizing data for business intelligence. For more insights, check out How To Measure The Effectiveness Of Corporate Training
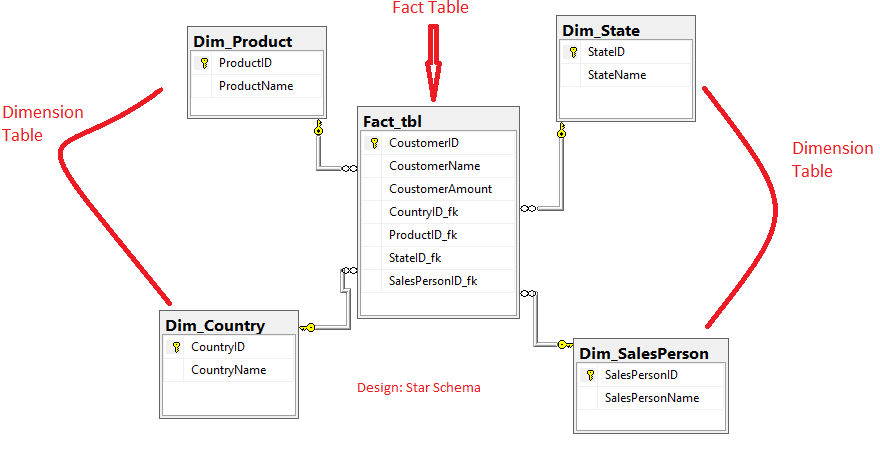
A fact table is a central component of a star or snowflake schema in a data warehouse. It stores quantitative data (measurable facts) for analysis and is typically surrounded by dimension tables that provide context to the data. Fact tables contain keys to the dimension tables and numerical values called measures that users analyze through queries and reports.
- Granularity Matters: The level of detail (granularity) in a fact table, such as daily sales vs. monthly sales, affects both the size of the table and the type of analysis possible.
- Types of Fact Tables: Common types include transaction fact tables (record individual events), snapshot fact tables (capture data at regular intervals), and accumulating fact tables (track lifecycle events).
- Optimized for Aggregation: Fact tables are structured to support aggregations like SUM, AVG, MAX, and MIN for reporting and data visualization.
Types of Fact Tables (Transactional, Snapshot, Accumulating)
Fact tables in a data warehouse are categorized based on the nature and timing of the data they store, primarily into three types: transactional, snapshot, and accumulating. Transactional fact tables capture detailed data about individual events or business transactions, such as a product sale or customer order. Each record typically represents a single event and includes foreign keys to dimension tables along with measurable data like quantity or amount. These tables are highly granular and often grow rapidly due to the frequency of transactions. Snapshot fact tables store data at specific intervals, such as daily, weekly, or monthly, to provide a “snapshot” view of business performance over time. Checkout and explore our How to Create Pivot Table in Excel They are useful for trend analysis, performance tracking, and monitoring changes across periods. Unlike transactional tables, snapshot tables contain aggregated or summarized data. Accumulating fact tables are used for processes that have a defined beginning and end, such as order fulfillment or customer onboarding. These tables are updated over time as events progress through different stages, capturing key milestones within a single row. Each type serves a distinct analytical purpose, and choosing the right fact table depends on the specific reporting and business intelligence needs of an organization.
To Explore Business Analyst in Depth, Check Out Our Comprehensive Business Analyst Training To Gain Insights From Our Experts!
What is a Dimension Table
- Descriptive Attributes: Dimension tables contain descriptive fields (e.g., product name, customer gender, region) that provide context for facts.
- Primary Key: Each dimension table has a primary key that uniquely identifies each record and links to the foreign key in the fact table.
- Denormalized Structure: Typically, dimension tables are denormalized for faster query performance, storing all relevant attributes in a single table. Learn more in How to Create Dashboard in Power BI Quickly
A dimension table is a key component of a data warehouse schema that provides descriptive, textual, or categorical information about the data stored in fact tables. These tables help to add context to the measurable data by storing attributes related to dimensions such as time, product, customer, or location. Dimension tables are essential for filtering, grouping, and labeling data in analytical queries and reports.
- Used for Filtering and Grouping: Analysts use dimension attributes in queries to slice, dice, and group data for deeper analysis.
- Slowly Changing Dimensions (SCDs): These tables often handle changes over time in attributes, such as a customer’s address or a product’s category.
- Improve Query Readability: By providing human-readable labels and categorizations, dimension tables make reports and dashboards more intuitive and user-friendly.
- Star Schema: Features a central fact table connected directly to denormalized dimension tables.
- Snowflake Schema: Expands dimension tables into multiple related tables through normalization. Normalization:
- Star Schema: Dimension tables are typically denormalized, leading to data redundancy.
- Snowflake Schema: Dimension tables are normalized, reducing redundancy but increasing complexity. Query Performance:
- Star Schema: Faster query performance due to fewer joins.
- Snowflake Schema: Slightly slower performance due to additional joins between normalized tables. Check out and Explore more in Best Power BI Alternatives. Ease of Use:
- Star Schema: Easier to understand and use, especially for end-users and analysts.
- Snowflake Schema: A more complex structure, requiring a better understanding of table relationships. Storage Efficiency:
- Star Schema: Consumes more space due to denormalized data.
- Snowflake Schema: More storage-efficient by avoiding data duplication. Use Cases:
- Star Schema: Ideal for simple, high-performance reporting and dashboards.
- Snowflake Schema: Better suited for complex data models with hierarchical relationships.

Differences Between Fact Tables and Dimension Tables
Fact tables and dimension tables serve distinct but complementary roles in a data warehouse schema, working together to support data analysis and reporting. A fact table stores quantitative data or measurable metrics, such as sales revenue, profit, or order quantity, which can be aggregated and analyzed. Learn more about this in Business Analyst Training. These tables are central to the schema and typically contain foreign keys linking to multiple dimension tables, along with numeric facts. In contrast, a dimension table holds descriptive information that adds context to the data in fact tables, such as product names, customer details, dates, or geographic locations. While fact tables are generally large and grow continuously with new transactions or events, dimension tables are relatively smaller and change less frequently. Fact tables are designed for performance and optimized for complex calculations and aggregations, whereas dimension tables support filtering, grouping, and labeling in queries. Another key difference lies in structure: fact tables are usually normalized and consist mainly of numeric values and keys, while dimension tables are often denormalized and include text-based, user-friendly data. Together, fact and dimension tables form the foundation of star and snowflake schemas, enabling powerful, flexible business intelligence and data analysis capabilities across organizations.
Gain Your Master’s Certification in Business Intelligence by Enrolling in Our Business Intelligence Master Program Training Course.
Star Schema vs. Snowflake Schema
Star schema and snowflake schema are two common data modeling techniques used in data warehousing to organize data for efficient querying and reporting. Both schemas use fact and dimension tables, but they differ in structure, normalization, and complexity. Understanding their differences helps in choosing the right design based on performance needs and data complexity.
Structure:Granularity in Fact Tables
Granularity in fact tables refers to the level of detail captured for each record in the table and is a fundamental concept in data warehouse design. It defines what each row in the fact table represents whether it’s a single transaction, a daily summary, or a monthly total. High granularity means data is stored at the most detailed level (e.g., each sale or transaction), allowing for detailed analysis and flexibility in reporting. However, this results in larger fact tables that require more storage and processing power. On the other hand, low granularity involves storing summarized or aggregated data (e.g., total sales per product per month), which reduces table size and improves performance but limits the depth of analysis. Learn more in Spotfire Explained benefits business. Choosing the right granularity depends on business requirements, analytical goals, and system capabilities. It’s important to define granularity clearly during the design phase, as changing it later can be complex and costly. For example, a sales fact table could have a granularity of one row per product per transaction, including keys for date, customer, and store, along with measures like quantity and amount. In summary, granularity impacts the usability, performance, and scalability of a data warehouse, making it a critical design decision.
Preparing for Business Analyst Job? Have a Look at Our Blog on Business Analyst Interview Questions and Answers To Ace Your Interview!
Relationship Between Fact and Dimension Tables
The relationship between fact and dimension tables is central to the structure and functionality of a data warehouse, forming the foundation of dimensional modeling used in star and snowflake schemas. Fact tables store quantitative data such as sales amount, order quantity, or revenue while dimension tables provide descriptive context for that data, such as product names, customer details, time periods, and geographic locations. These two types of tables are linked through keys: each fact table contains foreign keys that reference the primary keys of related dimension tables. For more details, check out Business Analyst Training. This relationship allows users to perform detailed analysis by filtering, grouping, and aggregating fact data based on various dimensions. For instance, a sales fact table may include foreign keys to dimension tables like Date, Product, Store, and Customer, enabling queries such as “total sales by region and product category over the last quarter.” This structure also supports drill-down and roll-up operations in OLAP (Online Analytical Processing), where users can explore data at different levels of detail. Maintaining referential integrity between fact and dimension tables is essential for accurate and meaningful analysis. Overall, the relationship between these tables transforms raw data into organized, insightful information that supports informed decision-making across an organization.