
Last updated on 07th Jun 2025| 10332
- Sales Performance Dashboard
- Customer Segmentation Analysis
- Financial Budget vs. Actual Report
- Marketing Campaign Effectiveness
- Human Resources Attrition Analysis
- Inventory Management Dashboard
- Healthcare Patient Admissions Report
- Website Traffic and Engagement Analysis
Sales Performance Dashboard
A Sales Performance Dashboard is a powerful visual tool that enables businesses to monitor, analyze, and optimize their sales activities and outcomes in real time. By aggregating data from various sources such as CRM systems, marketing platforms, and financial software, the dashboard provides a comprehensive overview of key performance indicators (KPIs) such as total revenue, sales growth, conversion rates, average deal size, and customer acquisition costs. It allows sales managers and teams to assess the effectiveness of their strategies, track progress against targets, and identify trends or areas needing improvement. The interactive nature of modern dashboards offers the flexibility to drill down into specific data segments, such as individual sales reps’ performance, regional sales, or product-specific metrics, providing actionable insights for decision-making skills emphasized in Business Analyst Training. Visual elements like bar charts, line graphs, and heat maps simplify complex data, making it easier for stakeholders to understand and respond to performance dynamics quickly. Furthermore, dashboards can be customized to align with the organization’s goals and updated in real time to reflect the most current figures. This helps in making timely, data-driven decisions, enhancing accountability and aligning the sales team’s efforts with broader business objectives. Ultimately, a Sales Performance Dashboard is not just a reporting tool it is a strategic asset that drives growth, efficiency, and sustained competitive advantage.
Interested in Obtaining Your Business Analyst Certificate? View The Business Analyst Training Offered By ACTE Right Now!
Customer Segmentation Analysis
Customer Segmentation Analysis involves dividing a company’s customer base into distinct groups based on shared characteristics. These characteristics could include demographic factors like age, gender, and income, as well as behavioral aspects such as purchasing habits, customer loyalty, and product preferences. By performing customer segmentation, businesses can develop targeted marketing strategies and create personalized offers that resonate with each group. One of the most critical metrics in customer segmentation is Customer Lifetime Value (CLV), which predicts the total revenue a customer will bring over their relationship with the company an important concept in How To Measure The Effectiveness Of Corporate Training. This metric helps businesses identify high-value customers who are worth investing in. Customer Retention Rate is another vital metric, indicating how effectively a company can keep customers over time. Engagement Rate measures the level of interaction that different segments have with the company’s communications, be it via email, social media, or other marketing channels. By understanding which segments are most engaged, businesses can tailor their marketing efforts accordingly. Power BI, for example, can use pie charts to display customer distribution across different segments (e.g., age, income level), helping to quickly identify which group makes up the largest portion of the customer base. Heatmaps can also be useful in mapping customer activity across regions or time periods, allowing companies to spot trends in customer behavior or location-specific demand patterns.
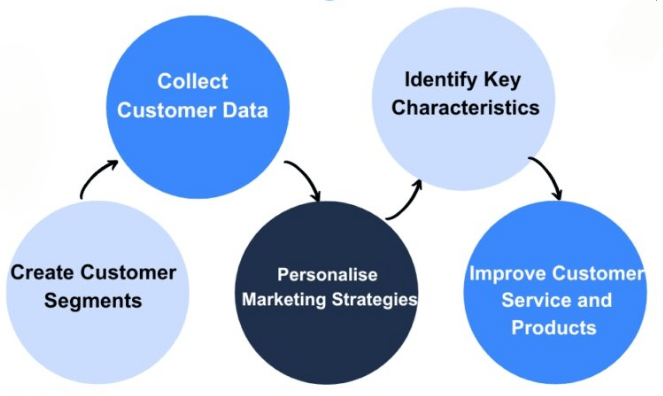
Additionally, scatter plots can help visualize relationships between two factors, such as income level and purchase frequency, helping businesses identify lucrative customer segments. A company in the fashion industry, for instance, could use customer segmentation analysis to identify frequent buyers of luxury items versus those who purchase at discounted prices. By understanding these behaviors, the company can offer tailored promotions or loyalty rewards, improving customer satisfaction and increasing sales conversion rates.
Financial Budget vs. Actual Report
- Comparison of Planned vs. Actual Spending: This report compares the budgeted financial figures against actual expenditures, helping organizations track whether they are overspending or underspending in various departments or projects.
- Variance Analysis: It highlights variances between budgeted and actual amounts, both in dollars and percentages, allowing managers to quickly identify significant discrepancies and investigate underlying causes.
- Revenue vs. Expense Tracking: The report tracks both projected and actual revenues alongside expenses, offering a clear picture of profitability and cash flow performance relative to expectations.
- Departmental and Project-Level Insights: Breaking down the budget vs. actual data by departments or projects helps pinpoint which areas are performing within budget and which require corrective action or additional oversight an important skill taught in Business Analyst Training.
- Trend Identification: By analyzing budget variances over multiple periods, organizations can identify recurring patterns or seasonal fluctuations, improving the accuracy of future budgeting.
- Forecast Adjustments: The report supports dynamic financial management by informing mid-cycle budget revisions or reallocations, ensuring that resources are aligned with changing business priorities.
- Decision-Making Support: Providing detailed financial insights, this report empowers leadership to make informed decisions about cost control, investment opportunities, and strategic planning to achieve organizational goals.
- Campaign Reach and Impressions: Measures how many people saw the campaign across different channels, indicating overall visibility and awareness.
- Click-Through Rate (CTR): Shows the percentage of viewers who clicked on the campaign’s call-to-action, reflecting audience engagement.
- Conversion Rate: Tracks how many visitors completed desired actions like purchases or sign-ups, indicating the campaign’s success in driving results an important metric covered in Business Analyst Training and crucial for understanding Why Should I Become a CBAP.
- Return on Investment (ROI): Compares revenue generated against campaign costs to evaluate financial efficiency and justify marketing spend.
- Audience Segmentation and Targeting: Identifies which audience groups respond best, enabling personalized messaging and better campaign focus.
- Engagement Metrics: Includes likes, shares, comments, and time spent, revealing how compelling and relevant the campaign content is.
- Attribution Analysis: Determines which channels and touchpoints contribute most to conversions, helping optimize multi-channel marketing strategies.
- Real-Time Stock Monitoring: Provides up-to-date information on stock levels across locations to avoid stockouts or overstocking.
- Reorder Alerts and Thresholds: Sends automated notifications when inventory falls below reorder points to ensure timely replenishment.
- Inventory Turnover Rates: Tracks how fast products sell to identify fast-moving and slow-moving items for better purchasing decisions an approach aligned with the principles in the History & Evolution of Six Sigma.
- Product Categorization and Segmentation: Groups inventory by categories, suppliers, or warehouses for detailed analysis and management.
- Demand Forecasting: Uses historical data and trends to predict future inventory needs and reduce excess stock.
- Supply Chain Visibility: Integrates supplier and logistics data for insights on shipment status, lead times, and delays.
- Customizable Visual Reports: Presents data through charts, graphs, and heat maps for easy tracking and informed decision-making.
To Earn Your Business Analyst Certification, Gain Insights From Leading Data Science Experts And Advance Your Career With ACTE’s Business Analyst Training Today!
Marketing Campaign Effectiveness

Human Resources Attrition Analysis
Human Resources (HR) Attrition Analysis focuses on understanding the reasons behind employee turnover within an organization. This analysis helps businesses identify retention issues, address dissatisfaction, and develop strategies to keep top talent. An attrition analysis can be broken down into various factors, such as job satisfaction, work-life balance, and compensation. The Attrition Rate is the primary metric, calculating the percentage of employees who leave the company during a specific period. Voluntary vs. Involuntary Attrition helps determine whether employees are leaving on their own accord or being let go, insights that can be analyzed effectively by How to use Control Chart Constants. Exit Interviews provide qualitative data on why employees leave, while Retention Rate measures the effectiveness of retention strategies. Additionally, Tenure Analysis tracks how long employees tend to stay at the company before leaving, which can highlight trends in employee longevity. Bar charts are commonly used to display attrition rates across departments, time periods, or demographic groups. Stacked area charts can show how different categories of attrition (voluntary, involuntary) contribute to overall turnover over time. Heatmaps can visualize which departments or roles are experiencing the highest levels of turnover. For example, a tech company might use HR attrition analysis to understand why developers are leaving at a higher rate than other departments. By analyzing these insights, the company can then develop retention strategies, such as improving work conditions or increasing compensation packages to retain valuable talent.
Are You Considering Pursuing a Master’s Degree in Business Intelligence? Enroll in the Business Intelligence Master Program Training Course Today!
Inventory Management Dashboard
Healthcare Patient Admissions Report
A Healthcare Patient Admissions Report is an essential document that provides detailed insights into the patterns and trends of patient admissions within a healthcare facility over a specific period. This report helps hospital administrators, medical staff, and policymakers understand patient flow, optimize resource allocation, and improve overall operational efficiency. Typically, the report includes data on the total number of admissions, patient demographics (such as age, gender, and location), admission sources (emergency, referrals, outpatient clinics), and the reasons for admission, categorized by medical conditions or departments. By analyzing this information, healthcare providers can identify peak admission times, seasonal variations, and the most common health issues requiring inpatient care. This understanding enables better staffing decisions, ensuring that adequate medical personnel and beds are available during high-demand periods, thereby reducing wait times and improving patient care quality key concepts taught in Data Analytics Course For Beginners. The report also tracks admission outcomes, such as discharge rates, transfers, or mortality, offering insights into treatment effectiveness and patient recovery trends. Moreover, the report can highlight readmission rates, which are crucial for assessing the quality of care and identifying patients who may need additional support post-discharge. Integrating this data with electronic health records (EHR) and hospital management systems facilitates a comprehensive view of patient journeys and resource utilization. Overall, a Healthcare Patient Admissions Report is a vital tool for improving healthcare delivery, enhancing patient satisfaction, and supporting strategic planning. It empowers healthcare organizations to respond proactively to changing demands and ensures the efficient and compassionate care of patients.
Preparing for a Business Analyst Job? Have a Look at Our Blog on Business Analyst Interview Questions and Answers To Ace Your Interview!
Website Traffic and Engagement Analysis
A Website Traffic and Engagement Analysis is a vital tool for understanding how visitors interact with a website, providing valuable insights that help businesses and organizations optimize their online presence. This analysis tracks key metrics such as the total number of visitors, page views, session duration, bounce rates, and traffic sources, offering a comprehensive picture of user behavior. By examining where visitors come from whether through organic search, paid ads, social media, or referrals organizations can evaluate the effectiveness of their marketing campaigns and identify the most valuable traffic channels. Engagement metrics, including average time spent on the site, pages per session, and user interactions like clicks, downloads, or form submissions, reveal how effectively the website captures and retains visitor interest key concepts taught in Business Analyst Training. High engagement typically indicates compelling content and a positive user experience, whereas low engagement may suggest the need for improvements in design, usability, or content relevance. Additionally, analyzing the behavior of returning visitors versus new visitors provides insights into customer loyalty and brand awareness. A detailed analysis also includes demographic data and device usage, helping tailor content and design for target audiences and platforms, whether desktop or mobile. Heatmaps and user journey tracking further enhance understanding by visualizing where visitors focus their attention and identifying potential navigation obstacles. Ultimately, Website Traffic and Engagement Analysis empowers businesses to make data-driven decisions, improve conversion rates, and enhance user satisfaction. By continually monitoring and refining their websites based on these insights, organizations can increase their online visibility, attract more qualified traffic, and achieve their digital goals effectively.


