Last updated on 09th Jun 2025| 11029
- Introduction to Data Scientist Uses Tableau for Data Science
- What is Tableau?
- What is a Data Scientist?
- How Tableau Helps Data Scientists
- How Data Scientists Integrate Tableau into Their Workflow
- Case Studies: Real-World Applications of Tableau in Data Science
- How Tableau Boosts Data-Team Collaboration
- Tableau vs. Traditional Data Science Tools
Introduction to Data Scientist Uses Tableau for Data Science
Data science has become an integral part of decision-making across industries, and tools like Tableau have revolutionized the way data scientists analyze and visualize complex datasets. Tableau is a powerful, user-friendly data visualization tool that allows data scientists and professionals undergoing Business Analyst Training to quickly turn raw data into interactive, meaningful insights. Its drag-and-drop interface makes it accessible to both beginners and experienced professionals, eliminating the need for complex coding while still offering robust analytical capabilities. With Tableau, data scientists can seamlessly connect to various data sources, whether it’s a database, cloud service, or spreadsheet, and generate dynamic dashboards that help stakeholders make data-driven decisions. Beyond visualization, Tableau empowers data scientists to perform advanced analytics like trend analysis, forecasting, and clustering. Its integration with programming languages like Python and R further extends its capabilities, allowing for sophisticated statistical modeling and machine learning tasks. As businesses increasingly rely on data to guide their strategies, the ability to present data in a clear, visually compelling way has become crucial. Tableau serves as an essential tool in the data science toolkit, making it possible for professionals to communicate insights effectively, uncover hidden patterns, and drive impactful business outcomes with data.
Are You Interested in Learning More About Business Analyst? Sign Up For Our Business Analyst Training Today!
What is Tableau?
- User-Friendly Interface: Tableau’s drag-and-drop interface makes it easy to create complex visualizations without needing extensive coding knowledge.
- Data Connectivity: Tableau can connect to various data sources such as spreadsheets, databases, cloud services, and web data connectors, enabling seamless integration and analysis, and offering valuable Tableau Developer Salary in India insights for those exploring career opportunities.
- Real-Time Analytics: Tableau allows for real-time data analysis, ensuring up-to-date insights and timely decision-making.
Tableau is a leading data visualization and business intelligence tool used for transforming raw data into interactive, shareable dashboards. It allows users to analyze and visualize data, making it easier to understand complex insights and make data-driven decisions. Tableau’s ease of use and powerful capabilities make it a preferred choice for businesses, analysts, and data scientists alike.
Key Features of Tableau: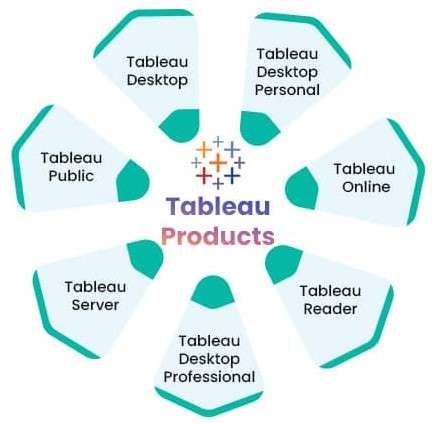
- Interactive Dashboards: Users can create dynamic and interactive dashboards that allow stakeholders to explore data and gain insights on their own.
- Advanced Analytics: Tableau supports advanced analytics like forecasting, trend analysis, clustering, and regression, providing deeper insights into the data.
- Collaboration and Sharing: Tableau offers collaboration features that allow users to share their findings through reports or dashboards, making it easy to communicate insights with team members or clients.
What is a Data Scientist?
A data scientist is a professional who combines expertise in statistics, programming, and domain knowledge to analyze and interpret complex data. They use various techniques from machine learning, data mining, and predictive modeling to extract meaningful insights and help businesses or organizations make data-driven decisions. Data scientists work with large datasets, clean and process the data, and apply advanced algorithms to uncover patterns, trends, and correlations. They often use programming languages like Python, R, and SQL, along with specialized tools such as Tableau and Hadoop, to manipulate and visualize data, complemented by resources like the How to become an excel expert guide for mastering spreadsheet skills. In addition to technical skills, data scientists must also have a strong understanding of the specific industry they are working in to draw relevant insights that drive business value. Their work may involve developing predictive models, creating data visualizations, and presenting findings to stakeholders in a way that is both accessible and actionable. Data scientists play a crucial role in helping organizations leverage data to optimize operations, improve products, enhance customer experiences, and gain a competitive advantage in their respective markets. Their ability to translate raw data into actionable insights makes them invaluable to any data-driven organization.
To Explore Business Analyst in Depth, Check Out Our Comprehensive Business Analyst Training To Gain Insights From Our Experts!
How Tableau Helps Data Scientists
- Effortless Data Visualization: Tableau transforms complex data into clear, interactive visuals, making it easier to identify trends, outliers, and patterns.
- Seamless Data Integration: It supports connections to a wide range of data sources, including Excel, SQL databases, cloud services, and big data platforms, along with a comprehensive Guide to Tableau Gauge Chart for effective data visualization.
- Real-Time Analysis: Tableau enables real-time data monitoring and live dashboard updates, helping data scientists analyze fresh insights instantly.
Tableau is a powerful data visualization tool that significantly enhances the workflow of data scientists by simplifying the process of exploring, analyzing, and presenting data. While data scientists often work with complex models and large datasets, Tableau helps bridge the gap between deep analytics and clear communication, enabling them to deliver insights in an intuitive, visual format that stakeholders can easily understand and act upon.
Key Ways Tableau Helps Data Scientists: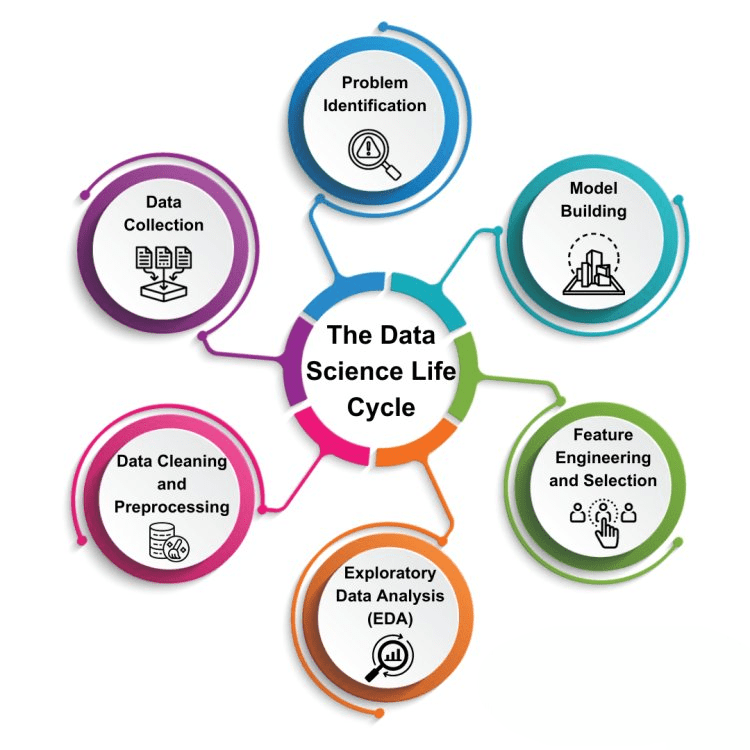
- Advanced Analytics Support: With built-in features like forecasting, clustering, and trend lines, Tableau allows data scientists to perform sophisticated analysis without extensive coding.
- Integration with Python and R: Data scientists can integrate Tableau with Python and R scripts to extend functionality and apply complex statistical or machine learning models.
- Improved Communication of Insights: Tableau’s visual storytelling capabilities help data scientists present their findings in a compelling and easy-to-understand format for non-technical stakeholders.
- Healthcare Analytics: Hospitals use Tableau to analyze patient records, monitor treatment effectiveness, and optimize staffing. Data scientists build dashboards to track patient outcomes, reduce readmission rates, and manage resources efficiently.
- Retail Sales Optimization: Retailers leverage Tableau to analyze customer purchasing behavior, product performance, and inventory levels. Data scientists use this insight to forecast demand, personalize marketing campaigns, and enhance the customer experience, all while following the Actions in Tableau for effective interaction design.
- Financial Risk Management: Financial institutions employ Tableau to monitor fraud, assess credit risk, and analyze market trends. Real-time dashboards help data scientists identify anomalies and respond quickly to emerging threats.
- Supply Chain Management: Companies use Tableau to visualize supply chain performance, track shipments, and optimize logistics. Data scientists create models to predict delays and suggest improvements in distribution strategies.
- Public Sector Policy Analysis: Governments utilize Tableau to evaluate the impact of public programs, track budget allocations, and communicate results to stakeholders with transparent visual reports.
- Education Performance Monitoring: Educational institutions apply Tableau to track student performance, enrollment trends, and resource allocation. Data scientists use these insights to improve learning outcomes and institutional efficiency.

How Data Scientists Integrate Tableau into Their Workflow
Data scientists integrate Tableau into their workflow to enhance the efficiency and clarity of data analysis, from data exploration to insight communication. The process typically begins with data preparation, where data scientists clean and preprocess large datasets using tools like Python, R, or SQL. Once the data is ready, it is imported into Tableau for visualization. Tableau allows data scientists and individuals undergoing Business Analyst Training to quickly create interactive charts and dashboards that reveal trends, correlations, and anomalies that might be difficult to detect through raw data analysis alone. These visualizations help in both exploratory data analysis (EDA) and hypothesis testing. For more advanced analytics, data scientists can integrate Tableau with R or Python scripts using Tableau’s Extensions or Tableau Prep, allowing them to run complex models and directly visualize the outputs. Tableau also supports live connections to databases and data warehouses, enabling real-time updates and dynamic dashboards. As findings are developed, Tableau becomes the primary tool for sharing insights with stakeholders clearly and engagingly, often eliminating the need for lengthy reports. By combining the analytical power of coding languages with Tableau’s intuitive visualization capabilities, data scientists streamline their workflow and make their analyses more impactful and accessible to decision-makers.
Case Studies: Real-World Applications of Tableau in Data Science
Tableau has been widely adopted across industries for its ability to transform data into actionable insights through interactive visualizations. Data scientists use Tableau in real-world scenarios to solve complex problems, improve operations, and guide strategic decision-making. Here are six notable applications that highlight how Tableau supports data science in diverse fields:
Preparing for Business Analyst Job? Have a Look at Our Blog on Business Analyst Interview Questions and Answers To Ace Your Interview!
How Tableau Boosts Data-Team Collaboration
Tableau plays a crucial role in bridging the gap between data scientists and business teams by transforming complex analytical findings into clear, interactive visualizations that are easily understood by non-technical stakeholders. Data scientists often work with large datasets, statistical models, and machine learning algorithms, which can be difficult for business users to interpret without a visual aid. Tableau simplifies this communication by allowing data scientists to present their insights through dynamic dashboards and charts that highlight key trends, patterns, and forecasts. This visual clarity enables business teams to quickly grasp the meaning of the data and make informed decisions based on evidence rather than assumptions. Tableau’s collaborative features, such as dashboard sharing, real-time updates, and commenting capabilities, further enhance teamwork by enabling constant feedback and iteration, while also supporting Business Intelligence Architecture solutions for seamless integration and data flow. Business users can explore the data themselves, ask questions, and suggest areas for deeper analysis, making the entire decision-making process more interactive and aligned. By facilitating this two-way communication, Tableau ensures that data-driven strategies are better understood, more quickly adopted, and more effectively implemented. Ultimately, Tableau empowers both data scientists and business teams to work together seamlessly, leading to smarter solutions and greater organizational success.
Tableau vs. Traditional Data Science Tools
Tableau and traditional data science tools serve different but complementary purposes in the data analysis process. Traditional tools like Python, R, and SQL are highly flexible and powerful for data manipulation, statistical modeling, and machine learning. They allow data scientists to build custom algorithms, clean and preprocess large datasets, and perform in-depth predictive and prescriptive analytics. However, these tools often require strong programming skills and are not always accessible to non-technical users. Tableau, on the other hand, excels in data visualization and ease of use. It enables users to create interactive dashboards and visual representations of data with minimal coding, making it ideal for communicating insights to stakeholders. While it doesn’t replace the advanced modeling capabilities of tools like Python or R, Tableau integrates with them, allowing data scientists and professionals in Business Analyst Training to visualize model outputs and share results more effectively. In a typical workflow, traditional tools are used for heavy analytical lifting, and Tableau is used for presenting findings in a clear, intuitive format. This combination enhances the overall impact of data science by making complex insights more accessible and actionable across teams. Ultimately, Tableau complements rather than competes with traditional tools, making it a vital part of a modern data science toolkit.