
Last updated on 11th Jun 2025| 10617
- Introduction
- What is Power BI?
- Power BI Architecture
- Key Features of Power BI
- Applications of Power BI
- Benefits of Using Power BI
- Challenges with Power BI
- Conclusion
Introduction
In today’s data-driven world, organizations face increasing pressure to transform raw data into meaningful insights that drive better decisions. Power BI, a business analytics tool developed by Microsoft, has become one of the most popular solutions for addressing this challenge. It offers powerful data visualization, transformation, and reporting capabilities that allow users to explore and understand their data more effectively. Power BI’s intuitive interface makes it accessible to both technical and non-technical users. It enables connections to a wide variety of data sources, including spreadsheets, databases, cloud services, and web APIs. Once connected, users can clean, shape, and model their data to prepare it for analysis, an essential part of Business Analyst Training. Power BI’s rich set of visualizations helps present complex data in a clear and engaging way, making it easier to spot trends, patterns, and anomalies. This blog will provide a detailed explanation of what Power BI is and take a deep dive into its architecture, including components like Power BI Desktop, Power BI Service, and Power BI Mobile. Additionally, it will explore key features such as interactive dashboards, data connectors, and advanced analytics. The article will also discuss Power BI’s broad range of applications across industries like finance, healthcare, education, and retail. By the end of this article, you will gain a comprehensive understanding of Power BI’s capabilities and learn how to harness its power to support various business needs, from reporting to strategic decision-making.
Are You Interested in Learning More About Business Analyst? Sign Up For Our Business Analyst Training Today!
What is Power BI?
Power BI is a comprehensive suite of business analytics tools developed by Microsoft that enables users to visualize their data, share insights across their organization, and make informed, data-driven decisions. It allows organizations to connect to a wide range of data sources, whether on-premises or cloud-based, and transform this raw data into meaningful reports and dashboards. This flexibility makes Power BI a versatile solution for businesses of all sizes and industries. One of the key features of Power BI is its data connectivity, supporting the goals of What Is Corporate Social Responsibility CSR. It supports connections to numerous sources including databases, cloud services, Excel files, and many others, allowing users to consolidate data from diverse systems into a single platform. Power BI also offers powerful data transformation capabilities through tools like Power Query, which help clean, shape, and prepare data for analysis. Data visualization is another core strength of Power BI. Users can create interactive reports and dashboards that present data in clear, engaging formats such as charts, graphs, and maps. These visuals make it easier to identify trends, patterns, and insights that support better decision-making.
Additionally, Power BI fosters collaboration by enabling teams to share reports, dashboards, and insights seamlessly across the organization. Power BI consists of several components, including Power BI Desktop for creating and publishing reports, Power BI Service for cloud-based sharing and collaboration, Power BI Mobile for accessing data on the go, and Power BI Gateway, which securely connects on-premises data sources to the cloud service. Together, these components provide a powerful, end-to-end analytics solution.
Power BI Architecture
- Data Sources: Power BI connects to a wide variety of data sources, including databases (SQL Server, Oracle), cloud services (Azure, Salesforce), files (Excel, CSV), and web APIs, allowing flexible data ingestion.
- Data Gateway: The On-premises Data Gateway acts as a bridge to securely transfer data between on-premises data sources and the Power BI cloud service without moving sensitive data outside the organization.
- Power BI Desktop: This is a Windows application where users design and create reports and data models by importing, transforming, and visualizing data. It’s the primary tool for data preparation and report creation.
- Power BI Service (Cloud): A cloud-based platform where users publish reports and dashboards created in Power BI Desktop. It offers collaboration, sharing, and management features accessible via a web browser, exemplifying What is Insights-as-a-Service IaaS.
- Data Modeling and Storage: Power BI uses the VertiPaq engine, an in-memory data model optimized for fast querying and compression, enabling efficient analysis even with large datasets.
- Visualization Layer: This layer consists of interactive visual elements like charts, graphs, and maps that help users explore data insights. Users can customize visuals and dashboards to suit their needs.
- Power BI Mobile & APIs: Power BI provides mobile apps for Android and iOS for on-the-go access. It also offers APIs for embedding reports in custom applications and integrating with other business systems.
- Data Connectivity: Power BI connects to hundreds of data sources like Excel, SQL Server, Azure, Salesforce, and more, allowing users to pull data from multiple places for unified analysis.
- Data Transformation: With Power Query, users can clean, reshape, and transform raw data without coding. It simplifies data preparation, ensuring that the data is accurate and ready for analysis.
- Interactive Visualizations: Power BI offers a wide variety of customizable visuals, such as bar charts, maps, gauges, and KPIs, which are interactive and allow users to explore data dynamically, a feature highlighted in Business Analyst Training.
- Real-Time Dashboards: Dashboards can display real-time data from streaming sources, enabling businesses to monitor operations and respond quickly to changing conditions.
- Mobile Accessibility: Power BI’s mobile apps let users access reports and dashboards anytime, anywhere, ensuring decision-makers stay informed on the go.
- Natural Language Query (Q&A): Users can ask questions in plain English, like “What were the sales last quarter?” and Power BI generates visuals instantly, making data accessible even to non-technical users.
- Collaboration and Sharing: Power BI facilitates easy sharing of reports and dashboards across teams, with built-in collaboration tools and integration with Microsoft Teams and SharePoint.
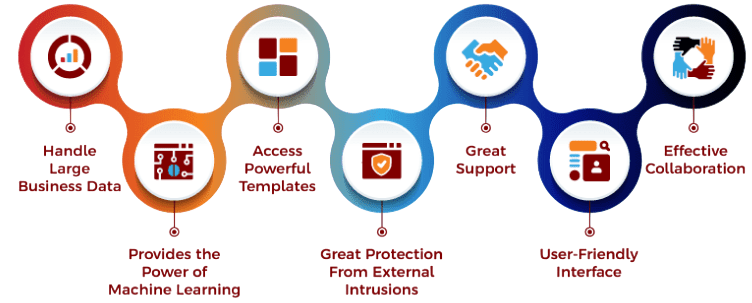
- Improved Decision-Making: Power BI provides real-time, data-driven insights that help businesses make informed decisions.
- Cost-Effective: Power BI offers a low-cost entry point for businesses compared to other BI tools.
- User-Friendly Interface: The platform is intuitive and easy to use, even for non-technical users, reflecting the user-friendly design of What Is SAP Human Capital Management HCM.
- Integration with Microsoft Products: Power BI integrates seamlessly with other Microsoft products like Excel, Azure, and Teams, making it a powerful addition to existing workflows.
- Scalability: Power BI can scale to meet the needs of both small businesses and large enterprises.
- Customizable Visuals and Reports: Power BI allows users to create highly customizable and interactive reports and dashboards, tailoring visualizations to specific business needs and enhancing data storytelling.
- Robust Security and Compliance: Power BI provides strong data security features, including row-level security, encryption, and compliance with industry standards, ensuring sensitive data is protected.
To Explore Business Analyst in Depth, Check Out Our Comprehensive Business Analyst Training To Gain Insights From Our Experts!
Key Features of Power BI

Applications of Power BI
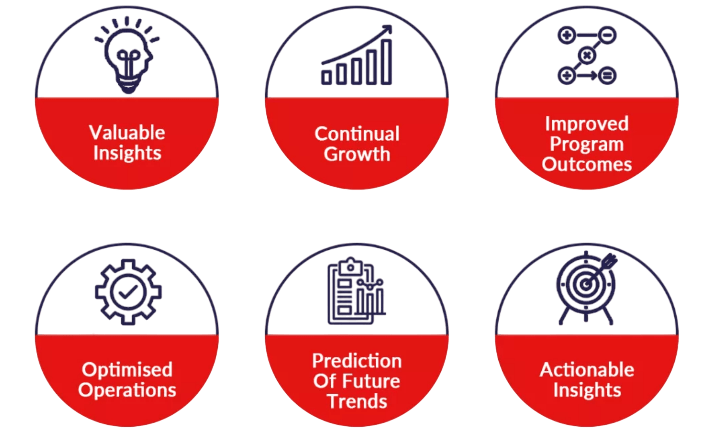
Power BI can be applied across a wide range of industries and use cases, providing valuable insights and helping organizations make smarter decisions. One key application is in educational institutions, where Power BI is used to analyze student performance, monitor attendance, and evaluate teaching effectiveness. By consolidating data from multiple sources, educators and administrators gain a comprehensive view of student progress and engagement. With Power BI, schools can track grades, test scores, and assignment completion rates, identifying students who may need additional support. Attendance data can be monitored in real time, enabling early intervention when patterns of absenteeism emerge, a process similar to What is Build Verification Testing. Additionally, Power BI helps evaluate teaching methods by analyzing class performance and feedback, allowing for continuous improvement in instructional strategies. Beyond education, Power BI is widely used in industries such as finance, healthcare, retail, and manufacturing. In finance, it supports budgeting, forecasting, and risk analysis. Healthcare organizations leverage Power BI to monitor patient outcomes, resource utilization, and compliance. Retailers use it to track sales trends, customer behavior, and inventory management, while manufacturers benefit from production monitoring and quality control insights. Power BI’s versatility, interactive visualizations, and real-time data capabilities make it an invaluable tool for organizations seeking to harness the power of data. By applying Power BI in various contexts, businesses and institutions can improve operational efficiency, enhance decision-making, and drive better outcomes across diverse sectors.
Are You Considering Pursuing a Master’s Degree in Business Intelligence? Enroll in the Business Intelligence Master Program Training Course Today!
Benefits of Using Power BI
Challenges with Power BI
While Power BI is a powerful and widely used business intelligence tool, it does come with certain challenges that users and organizations may face. One common challenge is the learning curve associated with mastering the platform. Although Power BI offers a user-friendly interface, leveraging its full potential, such as creating complex data models, writing DAX formulas, and designing advanced visualizations, can require significant training and expertise. This can slow down adoption, especially for teams without prior experience in data analytics or business intelligence. Data integration can also be difficult. Power BI supports many data sources, but consolidating data from multiple, disparate systems can be complex and may require extensive data cleaning and transformation, which impacts the What is Cost of Quality COQ. Ensuring data quality and consistency is critical because inaccurate or incomplete data can lead to misleading insights and poor decision-making. Performance issues may arise when working with large datasets or highly complex reports. Slow load times and lagging interactivity can frustrate users and reduce productivity. Optimizing data models, reducing the number of visuals, and using aggregation techniques are often necessary to maintain dashboard responsiveness. Security and governance pose challenges as well, especially for larger organizations handling sensitive data. Managing access permissions, data privacy, and compliance with regulations requires careful planning and administration within Power BI’s framework. Finally, while Power BI’s sharing capabilities are strong, some advanced collaboration features and integrations may require additional licensing costs, which could impact the total cost of ownership. Addressing these challenges involves ongoing training, robust data management, and strategic planning to maximize Power BI’s value.
Go Through These Business Analyst Interview Questions and Answers to Excel in Your Upcoming Interview.
Conclusion
Power BI is a robust business intelligence platform designed to help organizations transform raw data into meaningful insights. Its powerful architecture combined with a user-friendly interface enables users to easily connect to a wide variety of data sources including Excel files, cloud services, databases, and more allowing seamless integration of diverse data sets. Once connected, Power BI provides comprehensive tools for in-depth data analysis, enabling users to create interactive reports and dashboards that reveal trends, patterns, and key metrics critical to business success. Power BI’s versatility makes it suitable for numerous industries such as finance, sales, healthcare, education, and beyond, as emphasized in Business Analyst Training. Whether tracking sales performance, monitoring patient outcomes, or analyzing student progress, Power BI adapts to the unique needs of different sectors. Its interactive visualizations allow users to explore data from multiple angles, helping uncover insights that might otherwise go unnoticed. One of Power BI’s strongest advantages is its ability to foster collaboration across teams. Users can share reports and dashboards securely through the Power BI service, ensuring that stakeholders at all levels have access to timely, accurate information. This accessibility enhances decision-making and promotes a data-driven culture within organizations. From small businesses to large enterprises, Power BI provides scalable solutions that improve efficiency and drive growth. By mastering its key features and applications, organizations can unlock the full potential of their data, gain a competitive edge, and make smarter, faster business decisions.


