Last updated on 07th Jun 2025| 10946
- Introduction to Funnel Charts
- Use Cases for Funnel Charts
- Creating a Funnel Chart in Tableau
- Data Preparation for Funnel Charts
- Customizing Funnel Chart Colors
- Sorting and Filtering Funnel Data
- Adding Labels to Funnel Charts
- Using Funnel Charts in Sales Analysis
Introduction to Funnel Charts
Funnel charts are specialized visualizations used primarily to depict a process that has stages with a progressive reduction in values. They are especially useful for analyzing the flow of data in a business process, showing how data moves through various stages while decreasing at each point. The shape of a funnel chart typically reflects the stages of a process, where the widest section represents the initial stage, and the narrowest part represents the final stage. These charts are useful in identifying bottlenecks, inefficiencies, and areas of improvement in processes, particularly in sales, marketing, and customer journeys. The funnel chart, often covered in Business Analyst Training, helps to visualize the drop-off rate at different stages of a process, enabling decision-makers to track and evaluate performance. For example, in a sales funnel, you may track the number of leads generated at the top of the funnel and see how many ultimately convert into paying customers at the bottom. This visualization is effective at illustrating trends, making it easy to spot where attention should be focused to improve performance. Funnel charts are often favored for their simplicity and the ease with which they highlight areas where action is needed. Although the concept of a funnel chart is easy to grasp, implementing them requires a strategic approach to ensure that the data is accurately represented and provides useful insights.
Are You Interested in Learning More About Business Analyst? Sign Up For Our Business Analyst Training Today!
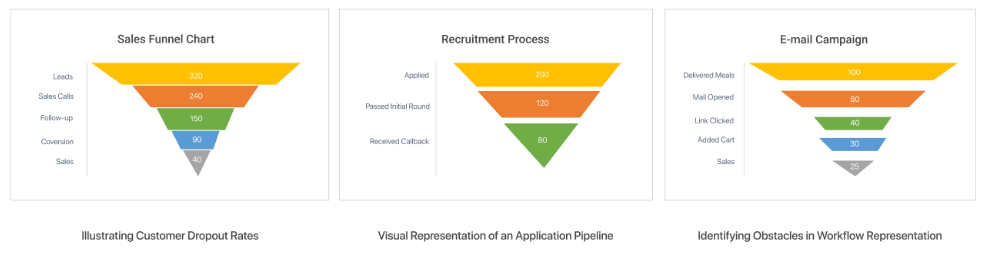
Use Cases for Funnel Charts
Funnel charts are versatile and can be applied to a variety of scenarios, particularly where processes are sequential with measurable stages. In sales, funnel charts are widely used to track leads and opportunities through different stages of the sales pipeline. For instance, at the top of the funnel, you may have a large number of leads, but as the process progresses such as qualification, pitching, negotiating, and closing the number of leads narrows. A funnel chart helps visualize how effectively these leads are being converted into customers and where the drop-offs are occurring, a concept discussed in Which Certification is Right for You: Six Sigma or Lean Six. Marketing teams often use funnel charts to assess the effectiveness of campaigns. From awareness to conversion, a funnel chart can track metrics like website visits, email open rates, click-through rates, and final purchases or sign-ups. Marketers can then focus on optimizing stages where the most significant drop-offs occur. Customer journey mapping is another use case where funnel charts are highly effective. They can illustrate how customers move from one touchpoint to another, be it from a website visit to adding items to the shopping cart, completing a purchase, or subscribing to a service. By analyzing these stages, companies can understand customer behavior, uncover friction points, and improve the overall experience.
Funnel charts are also useful for tracking the progress of product development. For example, in an agile environment, the number of ideas in the backlog, features in development, and completed product releases can be visualized using a funnel chart. This can help product managers monitor the efficiency of their development process and identify stages that need optimization. For customer support teams, a funnel chart can represent the stages of a support ticket process, from the initial ticket creation to the resolution. This can help identify areas where support agents may need additional training or resources to improve ticket resolution times.
Creating a Funnel Chart in Tableau
- Prepare the Data: To create an effective funnel chart, your data needs to have distinct stages, each with a corresponding value. For example, if you’re working with a sales funnel, the data should include stages like “Lead Generation,” “Qualification,” “Proposal Sent,” and “Closed Won” along with the number of leads or opportunities at each stage.
- Set Up Tableau: Open Tableau and connect to your dataset. You can import data from Excel, Google Sheets, a database, or any other supported data source.
- Drag and Drop Fields: Place your stages on rows and values on columns to form the funnel chart base, a method found in Books To Read For a Six Sigma Certification.
- Create a Calculated Field: In Tableau, you’ll need to create a calculated field to adjust the shape of the funnel. You can use a running total to accumulate the values in each stage and adjust the funnel chart’s appearance.
- Adjust the View: After setting up your data, customize the chart by selecting a stacked bar chart and adjusting the formatting. In some cases, you may want to create a “reverse funnel” chart where the largest values are at the top, representing the narrowing process.
- Apply Formatting: Adjust colors, labels, and tooltips to improve the visualization’s readability. Choose contrasting colors to clearly distinguish the funnel stages. Add labels for each stage to provide context and clarity for the audience.
- Final Adjustments: Review the chart to ensure it represents the data accurately and adjust the axis, formatting, or other visual elements as necessary.
- Define the Stages: Identify and define the stages of your process. Whether it’s sales, marketing, or product development, clear stage definitions will help in mapping the data to the chart.
- Collect Quantitative Data: Gather the numerical data for each stage, such as leads, conversion rates, or deal values key concepts covered in Business Analyst Training.
- Ensure Consistent Time Periods: If your process involves time-based stages, make sure that the time periods for each stage are consistent. For instance, you might be tracking leads over several months, and you should ensure that the same time period applies across each funnel stage for accurate comparison.
- Handle Null or Missing Data: Missing or incomplete data can distort the funnel chart and lead to incorrect conclusions. Ensure that your data set is clean, and handle any null values appropriately. You might need to filter out incomplete stages or fill missing values to maintain the integrity of the chart.
- Normalize the Data: Sometimes, raw data may require normalization before creating a funnel chart. For instance, you may need to adjust figures to represent a percentage of the total, making it easier to compare the drop-off rate at each stage.
- Enhanced Data Organization: Sorting funnel data allows users to arrange information based on specific criteria such as date, conversion rate, or lead source. This organization makes it easier to analyze stages in a logical order and identify trends quickly.
- Focused Data Analysis through Filtering: Filtering narrows down the dataset to include only relevant records, such as leads from a particular region, campaign, or time period. This targeted view helps uncover insights specific to certain customer segments or marketing efforts.
- Improved Conversion Rate Tracking: By sorting funnel stages from highest to lowest conversion rates or vice versa, businesses can quickly identify strong and weak points within the funnel, enabling focused improvements on underperforming stages an important skill in How to Build a Successful Data Analyst Career.
- Identification of Bottlenecks: Filtering and sorting data highlight funnel stages where prospects drop off disproportionately. Recognizing these bottlenecks allows teams to prioritize actions to enhance customer flow and increase conversions.
- Customization for Stakeholder Needs: Different stakeholders may require unique perspectives on funnel data. Sorting and filtering enable customizable reports that cater to sales teams, marketing managers, or executives, each focusing on metrics most relevant to their goals.
- Time-Efficient Decision Making: With clear, sorted, and filtered data, decision-makers spend less time sifting through irrelevant information and more time implementing strategies based on actionable insights.
- Enhanced Data Visualization: Sorted and filtered funnel data can be better visualized through charts and graphs, making it easier to communicate findings and track performance improvements over time.
To Explore Business Analyst in Depth, Check Out Our Comprehensive Business Analyst Training To Gain Insights From Our Experts!
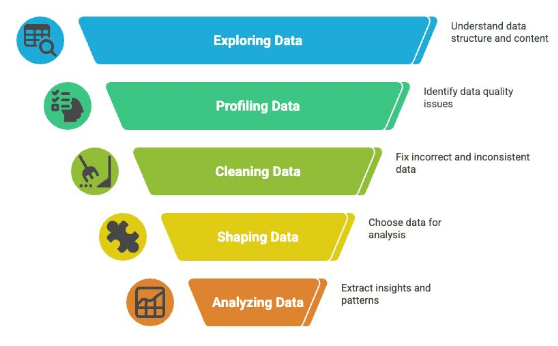
Data Preparation for Funnel Charts

Customizing Funnel Chart Colors
Customizing funnel chart colors is a crucial step in creating effective visualizations that are both appealing and easy to interpret. Colors not only enhance the aesthetic appeal of the chart but also play a vital role in conveying meaning and highlighting key data points. By using distinct colors for each stage of the funnel, viewers can quickly differentiate between steps, understand progression, and spot potential problem areas such as significant drop-offs or bottlenecks. When customizing funnel chart colors, it’s important to choose a palette that aligns with your brand identity and ensures good contrast for readability. Consistent use of colors across related dashboards and reports helps maintain a cohesive visual language, a principle emphasized in What is SAP Certification, making it easier for stakeholders to interpret data consistently over time. For example, using cooler colors like blue or green for early funnel stages and warmer colors like orange or red for later stages can intuitively indicate urgency or risk. Many visualization tools, including Tableau, Power BI, and Excel, offer flexibility in customizing funnel chart colors. Users can assign specific colors manually or leverage conditional formatting rules that automatically change colors based on thresholds such as conversion rates or volume sizes. This dynamic coloring helps draw attention to critical areas needing improvement or celebration. While vibrant colors can be effective, it’s essential to avoid overuse, which can overwhelm the viewer and obscure important insights. A balanced, thoughtful approach using contrasting yet harmonious colors enhances clarity without distracting from the data. Ultimately, customized funnel chart colors improve communication, making complex sales or conversion data more accessible and actionable for decision-makers.
Looking to Master Business Intelligence? Discover the Business Intelligence Master Program Training Course Available at ACTE Now!
Sorting and Filtering Funnel Data
Adding Labels to Funnel Charts
Adding labels to a funnel chart is essential for enhancing clarity and making the data more accessible and actionable. Labels provide critical context for each stage of the funnel by displaying key information such as the exact number of leads, conversion rates, or the monetary value associated with that stage. This additional detail helps stakeholders quickly understand the significance of each segment, facilitating better analysis and decision-making. Without labels, funnel charts may look visually appealing but lack the necessary information to interpret the data effectively. In tools like Tableau, adding data labels to funnel charts is straightforward. Users can enable labels directly on each funnel section to display numbers, percentages, or custom metrics. Tableau’s flexibility allows for formatting these labels to match the visualization style, improving readability and ensuring the chart communicates the intended message clearly an approach aligned with What is the ASAP Methodology. However, it is important to be mindful of label placement to prevent overcrowding or clutter. Overlapping or excessive labels can confuse viewers and diminish the chart’s effectiveness. To maintain a clean and professional look, consider using concise labels and strategically positioning them either inside or outside the funnel sections based on available space. Additionally, incorporating tooltips alongside labels can provide supplementary information without overwhelming the chart visually. Using color contrast between labels and funnel sections also enhances visibility. Ultimately, well-placed and thoughtfully designed labels transform funnel charts from simple visuals into powerful communication tools that support accurate insights, encourage stakeholder engagement, and drive informed business decisions. Proper labeling ensures that the nuances of each sales or conversion stage are clearly understood and actionable.
Go Through These Business Analyst Interview Questions and Answers to Excel in Your Upcoming Interview.
Using Funnel Charts in Sales Analysis
Funnel charts are powerful visualization tools commonly used in sales analysis to represent the progressive stages of a sales process and identify areas where potential customers drop off. By visually illustrating each stage from lead generation to final purchase funnel charts provide a clear, intuitive view of conversion rates and sales pipeline health. The widest part of the funnel represents the initial number of leads or prospects, while the narrowing sections reflect subsequent stages such as qualification, proposal, negotiation, and closing. This visual format, emphasized in Business Analyst Training, makes it easy to spot where the largest attrition occurs, enabling sales teams to focus their efforts on improving weaker stages and optimizing the overall conversion process. In sales analysis, funnel charts help managers quickly assess pipeline performance and forecast revenue by highlighting the proportion of deals moving through each phase. They facilitate data-driven decision-making by showing the impact of different factors like lead quality, sales tactics, or market conditions on progression rates. Additionally, funnel charts support benchmarking and trend analysis by allowing comparisons across different periods, teams, or products. Beyond identifying bottlenecks, funnel charts encourage collaboration between sales and marketing teams by providing shared visibility into the customer journey, improving alignment on lead nurturing strategies. They also assist in resource allocation, helping managers prioritize time and budget toward stages with the greatest potential for improvement. Overall, using funnel charts in sales analysis enhances transparency, drives efficiency, and supports continuous growth by turning complex sales data into actionable insights.


