
Last updated on 09th Jun 2025| 10962
- Introduction to Qlik Sense
- Key Features of Qlik Sense
- Installing and Setting Up Qlik Sense
- Connecting to Data Sources
- Data Transformation in Qlik Sense
- Creating Basic Visualizations
- Advanced Visualizations in Qlik Sense
- Building Dashboards in Qlik Sense
Introduction to Qlik Sense
Qlik Sense is a powerful, self-service data visualization and business intelligence (BI) tool designed to help users explore and analyze data to uncover insights. It is part of the Qlik product suite and is widely used by businesses of all sizes to transform data into interactive, meaningful visualizations and dashboards. Qlik Sense is a robust platform that enables business users to create personalized reports, interactive dashboards, and data visualizations without needing technical expertise in data science or analytics. Qlik Sense provides a user-friendly interface with drag-and-drop functionality, allowing users to work with data from various sources to create visual reports and dashboards, a tool often introduced in Business Analyst Training. One of the standout features of Qlik Sense is its associative data engine, which allows users to explore data relationships and trends dynamically. It connects data from different sources, allowing users to perform ad hoc analysis by filtering and selecting various data points. The platform is known for its in-memory analytics capabilities, making it fast and efficient when handling large datasets. Its responsive design ensures that users can work on their data visualizations from any device, be it desktop, tablet, or mobile phone, making it an ideal solution for businesses looking to democratize data and enable data-driven decision-making at every level of the organization.
Are You Interested in Learning More About Business Analyst? Sign Up For Our Business Analyst Training Today!
Key Features of Qlik Sense
Qlik Sense offers a broad range of features that cater to both novice users and experienced data analysts. One of Qlik Sense’s most distinctive features is its associative model, which allows users to explore data in any direction. Unlike traditional BI tools, which operate on a rigid query structure, Qlik Sense lets users freely interact with data by selecting different fields and making connections between various datasets. Qlik Sense empowers users to create their own data visualizations, reports, and dashboards. The platform’s intuitive interface makes it easy for non-technical users to build custom charts, graphs, and tables, as well as perform ad-hoc analysis on the data, a key focus of Data Analytics Course For Beginners. Qlik Sense is designed with a responsive interface, ensuring that visualizations are automatically optimized for any screen size or device. Whether you’re accessing Qlik Sense from a laptop, tablet, or smartphone, your visualizations will be automatically resized and adjusted for an optimal viewing experience. Qlik Sense supports a wide variety of data sources, including databases, cloud services, Excel files, and web-based data. It integrates seamlessly with both traditional data warehouses and modern data lakes, making it a versatile choice for businesses with complex data infrastructures. With Qlik Sense, users can easily collaborate by sharing dashboards, reports, and insights with others within the organization. Collaboration features, such as commenting and sharing visualizations, make it easy for teams to work together on data-driven projects. Qlik Sense also supports advanced analytics features, including statistical analysis, predictive modeling, and integration with data science platforms like R and Python.
This allows users to dive deeper into their data and apply more sophisticated analytical techniques. Qlik Sense provides robust security and governance features to ensure that data is handled in a secure and compliant manner. Users can define access rights and permissions, ensuring that only authorized individuals can access sensitive data. Qlik Sense can be embedded into other applications and web pages, making it a great choice for businesses that need to integrate interactive data visualizations into their existing systems or customer-facing portals.
Installing and Setting Up Qlik Sense
- Download Qlik Sense: Go to the official Qlik website and download the Qlik Sense installer. Qlik Sense Desktop is available for free for personal use, while Qlik Sense Enterprise requires a paid subscription.
- Run the Installer: Once the installer is downloaded, run the installation wizard. You will be prompted to accept the terms and conditions and choose the destination folder for installation.
- Configure Qlik Sense: During installation, Qlik Sense configures components like Qlik Engine and Proxy, related to the History & Evolution of Six Sigma.
- License Qlik Sense: After installation, you will need to apply a license key. For Qlik Sense Desktop, you can activate the license directly from the application.
- Access Qlik Sense: Once the installation is complete, you can open Qlik Sense either through the desktop application or a web browser, depending on your installation choice.
- Initial Configuration: After the installation, you may need to configure various settings, such as creating users, defining data connections, and setting up security rules.
- Data Load Editor: The Data Load Editor in Qlik Sense provides a powerful interface to load and connect data from different sources. You can use the built-in connectors or write custom SQL scripts to pull data into Qlik Sense.
- Select Data Source: To connect to a data source, you need to first create a data connection. You can connect to sources like SQL Server, Oracle, MySQL, SAP, Excel files, and cloud storage services like Google Analytics or Salesforce.
- Load Data: After creating the connection, you can load data from your source into Qlik Sense. The data load process allows you to define fields, filter data, and even transform it as it is being loaded, a process commonly taught in Business Analyst Training.
- Transform Data: Qlik Sense offers a variety of data transformation options, such as cleaning data, merging multiple datasets, and performing calculations. You can write scripts in the Data Load Editor to modify data before it is loaded into Qlik Sense.
- Data Model Viewer: After loading data, you can use the Data Model Viewer to visually inspect how your tables are connected. This helps identify relationships, key fields, and potential data modeling issues like synthetic keys or circular references.
- Schedule Reloads: In Qlik Sense Enterprise, you can automate data updates by scheduling reload tasks. This ensures your app always uses the most recent data without requiring manual intervention, keeping dashboards current and reliable.
- Create an App: Start by creating a new app in Qlik Sense. Once the app is created, you can add sheets to it, where you can build your visualizations.
- Select Visualization Type: Qlik Sense offers various visualization types, including bar charts, line charts, pie charts, scatter plots, and tables. Choose the one that best represents the data you want to display.
- Drag and Drop Fields: To create a visualization, simply drag and drop fields from the data model into the visualization’s axes or measures. Qlik Sense will automatically generate a preview of the visualization.
- Customize the Visualization: You can further customize your visualization by adjusting settings like colors, labels, and axes, a skill highlighted in Why Should I Become a CBAP.
- Interactivity: Qlik Sense visualizations are highly interactive. Users can click on data points to filter and explore related data, allowing for dynamic and detailed analysis.
- Add Calculations and Expressions: You can enhance your visualizations by adding custom calculations or expressions using Qlik Sense’s powerful scripting language. This allows for advanced metrics, aggregations, or conditional formatting to better highlight insights.
- Publish and Share: Once your visualizations and sheets are ready, you can publish your app to streams or share it with colleagues. Qlik Sense supports collaborative analysis, enabling multiple users to access, interact with, and contribute to the data story.
To Explore Business Analyst in Depth, Check Out Our Comprehensive Business Analyst Training To Gain Insights From Our Experts!
Connecting to Data Sources


Data Transformation in Qlik Sense
Data transformation is a critical step in preparing data for analysis in Qlik Sense. It ensures that the data is clean, consistent, and structured in a way that supports meaningful insights. Qlik Sense provides a powerful Data Load Editor where users can write custom scripts using Qlik’s scripting language to perform complex transformations. This includes filtering rows, renaming fields, joining multiple tables, and creating calculated fields tailored to specific analytical needs. Once data is loaded, it is stored in Qlik’s associative data model, which automatically detects relationships between datasets. This model allows users to explore data freely, uncovering associations and trends across multiple tables without needing predefined joins or rigid structures, a concept explained in How to use Control Chart Constants. Qlik Sense also supports ETL (Extract, Transform, Load) processes. It can pull data from various sources, including databases, spreadsheets, cloud services, and APIs, transforming it during the load process using built-in functions. For data cleansing, Qlik Sense offers robust tools to handle common issues such as missing values, duplicates, and inconsistent formatting. You can standardize formats, replace nulls, and remove or consolidate duplicate records to improve data quality. Additionally, Qlik Sense allows for data aggregation during transformation. You can compute totals, averages, counts, and other summary statistics to reduce data volume and focus on key performance indicators. These transformation capabilities ensure that data is accurate, structured, and ready for insightful analysis.
Are You Considering Pursuing a Master’s Degree in Business Intelligence? Enroll in the Business Intelligence Master Program Training Course Today!
Creating Basic Visualizations
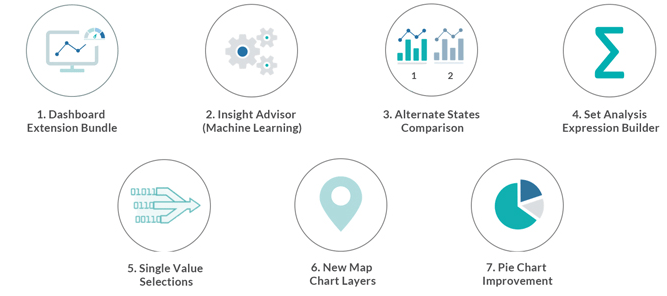
Advanced Visualizations in Qlik Sense
Qlik Sense offers a wide range of advanced visualizations that go beyond basic charts and graphs, enabling users to uncover deeper insights and present data more effectively. These advanced visualizations include options like combo charts, waterfall charts, KPI objects, gauge charts, box plots, and maps. Each of these visualizations serves a specific purpose and is designed to handle more complex analytical needs. For instance, combo charts allow users to display bars and lines in a single chart, making it ideal for comparing different measures such as sales volume and revenue over time. Waterfall charts help in visualizing incremental changes in value, useful in financial analysis and performance tracking, a topic covered in How To Measure The Effectiveness Of Corporate Training. Geospatial analysis is another powerful capability in Qlik Sense, enabled through map visualizations. Users can plot data points geographically and layer them with demographic or sales data to identify location-based trends. Box plots are useful for statistical analysis, allowing users to observe distribution, outliers, and central tendencies of data. Advanced visualizations in Qlik Sense are also highly interactive. Users can apply filters, make selections, and drill down into data directly within the visualization. Additionally, Qlik’s associative engine ensures that all visualizations remain linked, reflecting changes across the entire app as users explore data. With the help of extensions and third-party visualizations, users can further enhance the capabilities of Qlik Sense to suit unique business requirements and complex data stories.
Are You Preparing for Business Analyst Jobs? Check Out ACTE’s Business Analyst Interview Questions and Answers to Boost Your Preparation!
Building Dashboards in Qlik Sense
Dashboards are a central feature of Qlik Sense, enabling users to view, interact with, and analyze multiple visualizations on a single interface. They provide a consolidated view of key metrics, trends, and patterns, supporting data-driven decision-making across an organization. Building a dashboard in Qlik Sense begins with designing a layout that suits the type of data being presented. Qlik Sense uses a flexible, grid-based layout system, allowing users to position visualizations precisely on the sheet to create a clear and logical flow of information. After setting the layout, users can add a variety of visualizations such as bar charts, line graphs, pie charts, tables, KPIs, and maps to present different aspects of the data. These elements can be arranged to highlight comparisons, trends, or performance against targets, a concept emphasized in Business Analyst Training. One of the most powerful features of Qlik Sense dashboards is their interactivity. Users can apply filters, click on data points, and instantly see how other visualizations update in response. This associative model supports dynamic data exploration without needing to switch between reports. Customization options allow users to match the dashboard to organizational branding, including themes, colors, and background images. Once complete, dashboards can be published to the Qlik Sense Hub or shared with specific users or groups, ensuring secure, real-time access to insights across teams. Qlik Sense dashboards transform complex data into accessible, actionable information.


