
Last updated on 07th Jul 2025| 10044
- Importance of Hands-On Projects
- Data Sources and Dataset Collection
- Project 1: Sales Forecasting
- Project 2: Customer Segmentation
- Project 3: Marketing Campaign Analysis
- Project 4: HR Analytics Attrition Prediction
- Project 5: Financial Report Dashboards
- Project 6: Supply Chain Optimization
- Project 7: Retail Product Analysis
- Tools Used: Excel, Python, Power BI
- Presenting Your Results Effectively
- Building a Portfolio for Job Interviews
- Conclusion
Importance of Hands-On Projects
A Business Analyst in Project Management plays a crucial role in turning business goals into clear project steps. They ensure everyone involved is on the same page and that the project runs smoothly. However, just having theoretical knowledge is not enough to prepare analysts for real-world data issues. Working on actual business Analyst Project Topics is essential because it allows you to use data-cleaning methods, statistical techniques, machine learning, and visualization tools on real datasets. These experiences improve your problem-solving skills by exposing you to challenges like missing data and unclear requirements. They also help you build a strong portfolio that highlights your technical skills, creativity, and understanding of business qualities that employers appreciate. Most importantly, practical work boosts your confidence and communication skills. It helps you explain data insights clearly to both technical teams and business stakeholders. For anyone looking to become a Business Analyst in Project Management, hands-on experience is the key to connecting classroom theory with job-ready skills.
Are You Interested in Learning More About Web Developer Certification? Sign Up For Our Business Analyst Online Training Today!
Data Sources and Dataset Collection
Choosing the right dataset is foundational for a successful Business Analyst Project Topics. You want data that is rich enough to apply various analytical techniques, yet manageable for your current skill level.
Popular Data Sources:
- Kaggle: Offers thousands of datasets across domains like finance, healthcare, retail, and social media.
- UCI Machine Learning Repository: Classic datasets often used for teaching.
- Government Portals: Such as data.gov, which provides open datasets related to demographics, environment, and economics.
- Google Dataset Search: A powerful search engine for datasets.
- Company Websites and APIs: Many companies provide data or APIs for data extraction (e.g., Twitter, Yelp).
- Public Excel files and CSVs: From blogs and research sites.
When selecting datasets, consider:
- Relevance to your area of interest (marketing, HR, finance, etc.)
- Data quality and size
- Availability of both numeric and categorical features
- The presence of a clear business problem or question

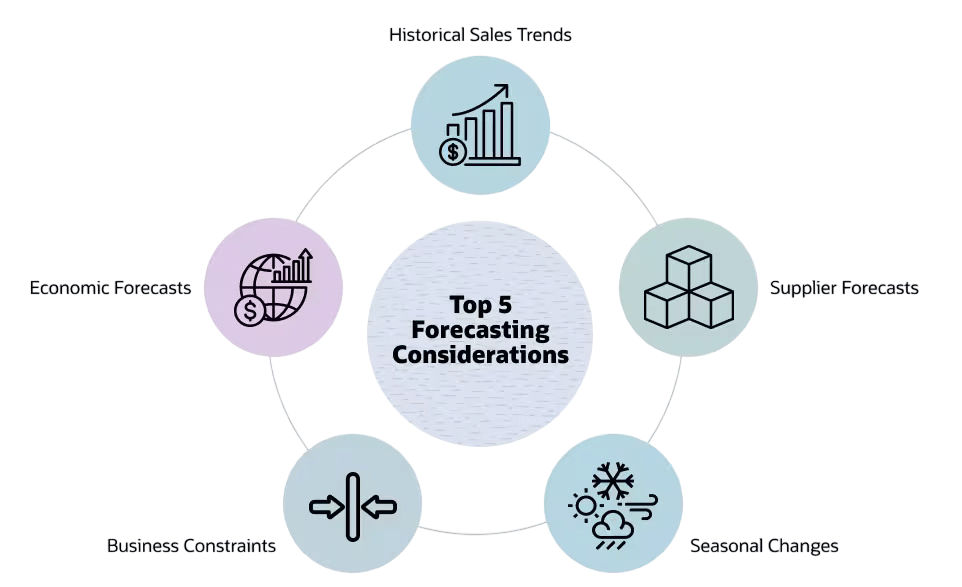
Project 1: Sales Forecasting
The goal of this project is to predict future sales for a retail company by examining historical sales data and including factors like promotional campaigns, seasonal trends, and holiday impacts. This project helps you build important skills such as time series analysis, data cleaning, and feature engineering through lag variables or moving averages. It also improves your understanding of regression and forecasting models, including ARIMA, Prophet, and machine learning methods, while helping you visualize sales patterns clearly. The workflow begins with data exploration, where you identify key trends, seasonality, and outliers in the sales data. The next step is data preprocessing, which involves cleaning missing values and creating new date-based features to enhance model performance. After preparing the data, you proceed to model building by applying forecasting algorithms to generate future predictions. You then evaluate the models using accuracy metrics like RMSE and MAE. The final step is visualization, where you compare actual and predicted sales values using clear charts to effectively communicate your results.
The tools used in this project include Excel for basic exploration, Python with libraries like pandas, statsmodels, and Prophet for modeling, and Power BI to create interactive dashboards that present your insights in a visually appealing way.
Are You Preparing for Business Analyst Jobs? Check Out ACTE’s Business Analyst Interview Questions & Answers to Boost Your Preparation!
Project 2: Customer Segmentation
The goal of this project is to group customers based on their buying behavior. This task allows you to improve skills in exploratory data analysis, clustering algorithms like K-Means and Hierarchical clustering, data scaling, normalization, and dimensionality reduction using PCA. It also helps you interpret clusters and turn raw analytics into practical business insights. The project starts with cleaning the data by removing duplicates and addressing missing values. Next, you choose key features such as purchase frequency, recency, and monetary value to define customer behavior. These variables are then scaled or normalized to ensure they contribute equally to the model. Once the data is ready, clustering algorithms are applied, and the best number of clusters is chosen using visual tools like the Elbow Method. Finally, you convert these insights into business recommendations, suggesting specific marketing actions for each customer group. The tools used for this Topics For Business Analytics Project include Python with libraries like scikit-learn, matplotlib, and visualization. Excel is also used during the data preparation stage for quick inspection and validation.
Are You Considering Pursuing a Master’s Degree in Business Analyst? Enroll For Business Analyst Masters Program Training course Today!
Project 3: Marketing Campaign Analysis
Objective: Evaluate the effectiveness of a marketing campaign and identify factors influencing success.
Skills Practiced:
- Statistical hypothesis testing (A/B testing)
- Conversion rate analysis
- Data visualization
- ROI calculation
- Reporting insights for stakeholders
Workflow:
- Data Cleaning: Prepare data on campaign interactions and customer responses.
- Descriptive Analysis: Calculate click-through and conversion rates.
- Hypothesis Testing: Conduct tests to compare control and treatment groups.
- Segmentation: Analyze response rates by demographics or channels.
- Visualization: Build dashboards highlighting key metrics.
- Recommendations: Suggest improvements based on findings.
Tools: Excel for quick calculations and pivot tables, Python for advanced stats, Power BI for dashboards.
Project 4: HR Analytics Attrition Prediction
Objective: Predict employee turnover to help HR teams take preventive actions.
Skills Practiced:
- Data preprocessing (handling categorical variables)
- Feature engineering (tenure, performance ratings)
- Classification algorithms (Logistic Regression, Random Forest)
- Model evaluation metrics (accuracy, precision, recall, ROC-AUC)
- Communicating business impact
Workflow:
- Data Exploration: Understand attrition patterns.
- Feature Engineering: Create relevant features like engagement scores.
- Model Training: Train classification models.
- Evaluation: Assess performance using confusion matrices and ROC curves.
- Interpretation: Identify key attrition drivers.
- Action Plan: Propose interventions.
Tools: Python (pandas, scikit-learn), Topics For Business Analytics Project using excel for summary reports.
Project 5: Financial Report Dashboards
Objective: Building an interactive financial dashboard is one of the most popular Business Analyst Project Topics because it blends design with data interpretation.
Skills Practiced:
- Data aggregation and summarization
- KPI selection and calculation
- Dashboard design principles
- Interactivity features (filters, drill-downs)
- Storytelling through data visualization
Workflow:
- Data Preparation: Consolidate financial data from multiple sources.
- KPI Definition: Define metrics like revenue growth, profit margins.
- Dashboard Development: Use Power BI or Tableau to create visual reports.
- User Testing: Gather feedback and refine usability.
- Presentation: Showcase dashboard for decision-making.
Tools: Power BI, Excel, Tableau.
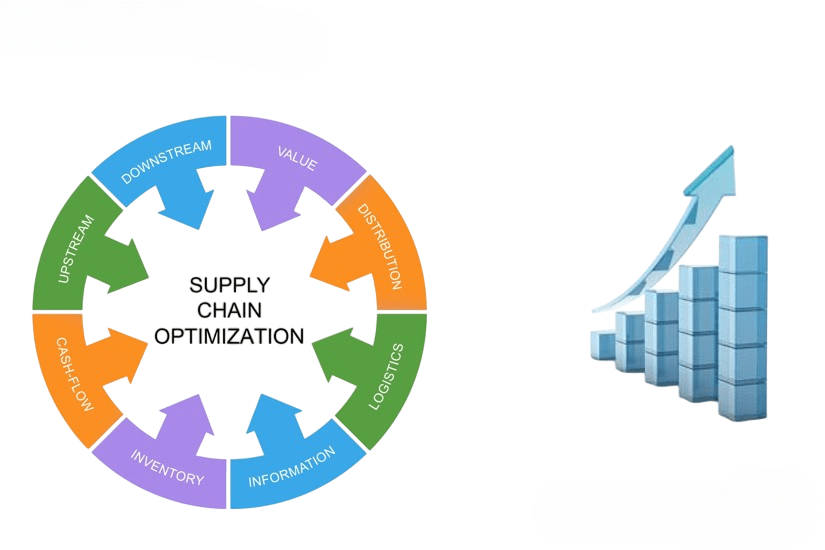
Project 6: Supply Chain Optimization
Optimizing logistics using data is a classic example among Topics for business analytics projects, especially in manufacturing and retail.
Objective: Analyze supply chain data to identify bottlenecks and optimize inventory levels.
Skills Practiced:
- Data cleaning of logistics and inventory data
- Demand forecasting
- Optimization techniques
- Visualization of supply chain metrics
- Cost-benefit analysis
Workflow:
- Data Cleaning: Prepare shipment and inventory datasets.
- Exploratory Analysis: Identify lead times and delays.
- Forecasting: Predict inventory needs.
- Optimization Modeling: Use linear programming or heuristics.
- Visualization: Communicate supply chain performance.
- Recommendations: Suggest process improvements.
Tools: Python (pandas optimize), Excel, Power BI.
Project 7: Retail Product Analysis
Optimizing logistics with data is one of the most valuable topics for business analytics projects, especially in manufacturing and retail. This project aims to analyze supply chain data to find bottlenecks and improve inventory levels without raising costs or causing delays. It involves working with real-world logistics data, developing forecasting models, and using optimization methods to improve operational efficiency. Once the data is ready, exploratory analysis helps identify common problems like delays, long lead times, or inconsistent order patterns. With this information, forecasting models predict future inventory needs based on past trends and seasonality. Using tools like linear programming or heuristic methods, you build optimization models to streamline the supply chain. Data visualization is crucial for showing metrics such as stock turnover, delivery delays, and cost changes.
Tools Used: Excel, Python, Power BI
Mastery of these tools is critical for any Business Analyst In Project Management, as they enable you to convert raw data into stakeholder-ready insights.
Excel:
- Great for quick data cleaning, pivot tables, and basic analysis.
- Widely used in business environments.
- Useful for initial exploration and small datasets.
Python:
- Essential for data scientists and advanced analysts.
- Libraries like pandas, numpy, matplotlib, and scikit-learn allow powerful data manipulation, analysis, and modeling.
- Jupyter notebooks enable a narrative format combining code and results.
Power BI:
- Popular for creating interactive business dashboards.
- Connects easily to multiple data sources.
- Provides visual storytelling features to help decision-makers grasp insights quickly.
Proficiency in these tools makes you versatile and able to handle a variety of data problems, from raw data processing to delivering executive-level reports.
Presenting Your Results Effectively
Technical skills alone are not enough; the ability to communicate your findings clearly is critical. Every one of your Topics For the Business Analytics Project must be accompanied by clear presentation skills that demonstrate both logic and business value.
Tips for Effective Presentation:
- Know Your Audience: Tailor the depth of technical detail based on who will see your results.
- Use Clear Visuals: Choose charts and graphs that best represent the data story.
- Tell a Story: Structure your presentation around a clear problem, your approach, findings, and recommendations.
- Highlight Key Insights: Use callouts, summaries, and annotations.
- Be Concise: Avoid overwhelming your audience with too much data.
- Practice Delivery: Be prepared to answer questions and explain your methodology.
Well-presented projects demonstrate not only your analytical ability but also your business communication skills.
Building a Portfolio for Job Interviews
Your portfolio should reflect a variety of strong Business Analyst Project Topics, from marketing analysis to operational dashboards.
Why Build a Portfolio?
- Shows practical experience and initiative.
- Demonstrates problem-solving ability.
- Provides tangible examples to discuss during interviews.
- Differentiates you from other candidates.
What to Include:
- A variety of projects showcasing different skills and tools.
- Clear descriptions of the problem, your approach, and results.
- Visuals like dashboards, charts, or code snippets.
- Links to GitHub repositories or personal websites.
- Documentation or reports in PDF format for offline viewing.
Tips for a Strong Portfolio:
- Use version control (GitHub) to showcase code quality.
- Keep projects up-to-date and relevant.
- Include real-world or realistic datasets.
- Explain your role clearly if projects were collaborative.
- Practice discussing your projects confidently.
Conclusion
Hands-on projects are the cornerstone of building a successful career in data analysis and data science. They provide the opportunity to apply theoretical concepts to practical problems, develop technical skills, and build a compelling portfolio that attracts employers. From sales forecasting and customer segmentation to HR analytics and supply chain optimization, working on diverse projects will prepare you for the complexities of real-world data challenges. The Business Analyst In Project Management ensures the right data turns into the right decisions. Mastering tools like Excel, Python, and Power BI, along with effective communication of your results, will set you apart in the competitive job market. Start small, pick interesting datasets, and gradually take on more complex projects. Your portfolio is not just a collection of work; it’s your story of growth and expertise in the data domain.