
Last updated on 12th Jun 2025| 11111
- Introduction
- Why Tableau?
- Coca-Cola: Optimizing Supply Chain and Operations
- NASA: Visualizing Space Data for Groundbreaking Insights
- Verizon: Enhancing Customer Experience with Real-Time Analytics
- Dell: Streamlining Business Intelligence Across Global Operations
- The Weather Channel: Real-Time Data Visualizations for Forecasting
- Tableau Software: A Self-Case Study in Data Visualization
Introduction
Tableau has revolutionized data analytics for enterprises worldwide, offering powerful visualization tools that transform complex data into actionable insights. In this article, we explore seven companies that have harnessed Tableau with remarkable success. Global retail giant Walmart leverages Tableau to optimize supply chain logistics and enhance customer experience. Charles Schwab uses it to empower financial advisors with real-time analytics, improving client services. At Coca-Cola Bottling Company, Tableau streamlines operational data, boosting efficiency across production and distribution. Verizon employs Tableau to analyze customer behavior and network performance, helping drive innovation and retention. Business Analyst Training plays a key role in enabling professionals to leverage these insights effectively. The University of Michigan relies on it for institutional research, aiding data-driven decision-making in education. LinkedIn integrates Tableau to monitor platform usage and improve product development strategies. Lastly, Lufthansa uses Tableau for predictive maintenance and performance monitoring, enhancing safety and operational reliability. These enterprises demonstrate how Tableau empowers teams to interact with data dynamically, identify trends swiftly, and drive strategic growth across industries.
Do You Want to Learn More About Business Analyst? Get Info From Our Business Analyst Training Today!
Why Tableau?
- User-Friendly Interface: Tableau’s intuitive drag-and-drop design allows users to build dashboards and visualizations without coding knowledge.
- Fast Performance: It enables real-time data interaction and quick rendering of complex datasets for timely decision-making, aligning with key Tableau Developer roles responsibilities tips to ensure efficient data visualization and actionable insights.
- Wide Data Connectivity: Tableau connects easily to various data sources, including Excel, SQL databases, cloud services, and big data platforms.
Tableau has become a go-to analytics platform for businesses seeking to turn data into actionable insights with speed and clarity. Its simplicity, versatility, and powerful capabilities make it a preferred choice across industries. Here are six key reasons why Tableau stands out:
- Advanced Visualization Tools: A diverse library of visual formats helps users explore data patterns, trends, and outliers in depth.
- Scalable and Collaborative: Tableau supports enterprise-wide sharing, collaboration, and governance through Tableau Server and Tableau Cloud.
- Vibrant Community and Support: With a strong global user base, helpful forums, and rich learning resources, Tableau ensures users never feel stuck.
Coca-Cola: Optimizing Supply Chain and Operations
Coca-Cola, one of the world’s most iconic beverage brands, uses Tableau to streamline and optimize its complex supply chain and operational processes. With thousands of products distributed across global markets, Coca-Cola relies on data-driven insights to maintain efficiency and responsiveness. Tableau allows the company to visualize real-time data from multiple sources, helping teams monitor inventory levels, production rates, and transportation logistics with precision, while also offering a reference point when evaluating MSBI vs Power BI Key Differences in terms of data integration and reporting capabilities. By integrating Tableau into their daily operations, Coca-Cola can quickly identify bottlenecks, predict demand fluctuations, and make informed decisions that reduce waste and costs. The ability to drill down into region-specific data enables localized strategies and quicker problem-solving, enhancing both agility and service delivery. Operations teams benefit from interactive dashboards that provide end-to-end visibility across the supply chain, ensuring that raw materials, manufacturing, and delivery align seamlessly. Moreover, Tableau empowers Coca-Cola’s workforce to be more data-literate and collaborative, fostering a culture of continuous improvement. From warehouse optimization to forecasting and performance tracking, Tableau plays a vital role in Coca-Cola’s commitment to operational excellence. By turning complex data into clear visual narratives, Coca-Cola ensures that every link in its supply chain is both efficient and resilient in today’s fast-paced global environment.
Would You Like to Know More About Business Analyst? Sign Up For Our Business Analyst Training Now!
NASA: Visualizing Space Data for Groundbreaking Insights
- Mission Monitoring: Tableau dashboards help track spacecraft telemetry, mission timelines, and system statuses in real time.
- Scientific Research: Researchers use Tableau to visualize astronomical data, aiding in the study of planetary systems, solar activity, and cosmic phenomena, showcasing its relevance among the Top Business Intelligence Tools for scientific analysis.
- Public Data Sharing: NASA makes data accessible to the public through interactive Tableau dashboards, promoting transparency and education.
NASA handles vast and complex datasets generated from satellites, space missions, telescopes, and research labs. To make sense of this data and uncover meaningful insights, NASA leverages Tableau for advanced data visualization and analysis. By transforming raw data into interactive visuals, scientists and engineers can explore patterns, monitor mission progress, and drive innovation with clarity. Here’s how NASA uses Tableau for impactful results:
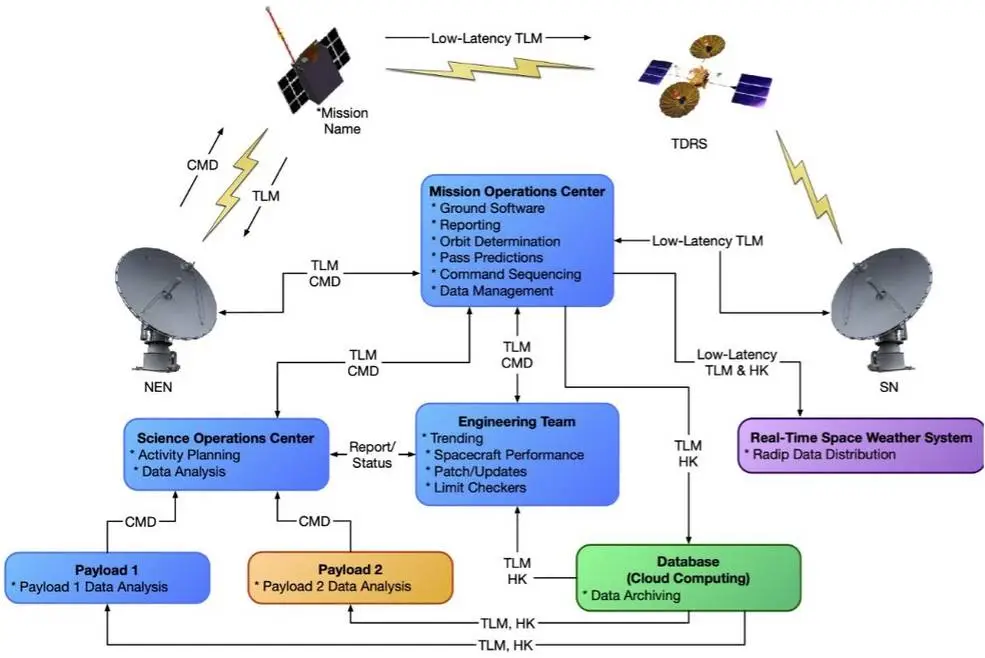
- Operational Efficiency: Teams optimize logistics, resources, and staff scheduling using data insights displayed clearly in Tableau.
- Climate and Earth Studies: Tableau aids in analyzing satellite imagery and environmental data to monitor climate change and natural events.
- Collaboration Across Departments: Tableau enables seamless collaboration by providing a unified platform for data sharing among scientists, engineers, and decision-makers.
- Centralized Data Access: Tableau provides Dell with a single platform to access and visualize data from multiple global systems and departments.
- Supply Chain Optimization:Interactive dashboards help monitor inventory, track shipments, and forecast demand to reduce delays and minimize costs, offering functionality comparable to tools explored in What Is Power BI discussions.
- Sales and Performance Tracking: Dell’s sales teams use Tableau to track KPIs, analyze regional performance, and identify growth opportunities in real time.
- Customer Support Insights: Tableau enables support teams to monitor customer issues, service metrics, and satisfaction trends to enhance response strategies.
- Executive Reporting: Leadership uses customized Tableau dashboards for high-level visibility into business health, market trends, and financial performance.
- Agile Decision-Making: With self-service analytics, Dell empowers employees at all levels to explore data independently, accelerating decision-making across the enterprise.

Verizon: Enhancing Customer Experience with Real-Time Analytics
Verizon, a global leader in telecommunications, leverages Tableau to elevate customer experience through real-time analytics and data-driven decision-making. With millions of users generating massive volumes of data daily, Verizon uses Tableau to monitor network performance, customer interactions, and service usage across various touchpoints. By integrating data from call centers, mobile networks, and digital platforms, teams gain immediate insights into customer behavior, service quality, and potential issues. This allows Verizon to proactively address service disruptions, optimize network traffic, and tailor offerings to meet customer needs. Tableau’s interactive dashboards empower customer service teams to track key metrics such as response times, resolution rates, and customer satisfaction scores, leading to faster, more personalized support. Business Analyst Training helps teams interpret these metrics to drive continuous improvement. Marketing and product teams also benefit by identifying usage trends and preferences, enabling them to design targeted campaigns and innovate services accordingly. With a unified view of the customer journey, Verizon can ensure consistent, high-quality experiences across all channels. Tableau’s real-time capabilities not only enhance operational agility but also help Verizon foster stronger customer relationships. In a competitive market where customer satisfaction is paramount, Verizon’s use of Tableau has become a critical factor in delivering seamless, responsive, and data-informed service.
Looking to Master Business Intelligence? Discover the Business Intelligence Master Program Training Course Available at ACTE Now!
Dell: Streamlining Business Intelligence Across Global Operations
As a global technology leader, Dell manages vast amounts of data across its manufacturing, supply chain, sales, and support operations. To harness this data effectively, Dell uses Tableau to unify and streamline its business intelligence efforts. Tableau empowers Dell’s teams with faster access to insights, enabling smarter decisions and greater operational efficiency. Here’s how Dell leverages Tableau across its global operations:
The Weather Channel: Real-Time Data Visualizations for Forecasting
The Weather Channel, one of the most trusted sources for weather information, relies heavily on Tableau to deliver real-time, data-driven insights for accurate forecasting and public communication. Handling billions of data points from satellites, radar systems, and sensors worldwide, the organization uses Tableau to transform raw meteorological data into clear, interactive visualizations. These dashboards help meteorologists analyze changing weather patterns, track severe storms, and model forecasts with greater precision and speed. Tableau’s real-time capabilities enable quick interpretation of incoming data, allowing teams to issue timely warnings and updates to the public. The visualizations also support decision-making for emergency services, media broadcasts, and mobile applications, ensuring that critical weather information reaches users promptly and clearly skills that are essential to learn when exploring How to Become a Power BI Developer guide Beyond forecasting, The Weather Channel uses Tableau to monitor user engagement, optimize content delivery, and improve digital experiences across platforms. With the ability to customize and share dashboards instantly, the organization maintains agility during rapidly evolving weather events. Tableau not only enhances operational efficiency but also strengthens The Weather Channel’s mission to keep people informed and safe. Through intuitive, dynamic visual storytelling, Tableau helps turn complex atmospheric data into actionable insights for millions around the globe.
Tableau Software: A Self-Case Study in Data Visualization
As the creator of one of the world’s leading data visualization platforms, Tableau Software exemplifies the power of its own tools by using them internally to drive performance, innovation, and strategic decision-making. Tableau employs its software across all departments from marketing and sales to product development and customer support to gain real-time insights and foster a data-driven culture. Internal teams use Tableau dashboards to track KPIs, monitor user engagement, optimize campaigns, and identify growth opportunities with clarity and speed. Business Analyst Training equips professionals with the skills to maximize the value of these insights. Product teams analyze customer feedback and usage data to guide feature enhancements, while sales and customer success teams leverage visual analytics to tailor strategies and improve client relationships. The company also uses Tableau to track internal operations, such as resource allocation, financial performance, and employee productivity, promoting transparency and accountability across the organization. By adopting a “drink your own champagne” approach, Tableau continuously tests, refines, and showcases the capabilities of its platform, demonstrating the tangible value of visual analytics in real-world business contexts. This self-use not only strengthens Tableau’s credibility but also ensures ongoing innovation, as the company’s internal needs help shape future product developments. In essence, Tableau is its own best case study proving the impact of clear, interactive data visualization every day.