Last updated on 07th May 2025| 8859
- Introduction
- Why Big Data Visualization is Important
- Top Big Data Visualization Tools
- Key Features to Look for in Big Data Visualization Tools
- How to Choose the Right Big Data Visualization Tool
- Future Trends in Big Data Visualization
- Real-World Applications of Big Data Visualization
- Challenges in Big Data Visualization
- Conclusion
Introduction
Organizations generate and process vast amounts of data in today’s data-driven world. However, raw data is useless unless presented in a way that can be understood and acted upon quickly. This is where big data visualization tools come into play. These tools help convert complex datasets into clear, interactive, and insightful visualizations, enabling decision-makers to make informed, Business Analyst Training . As we move toward 2025, the demand for intuitive, high-performance, and Interactive visualizations data visualization tools is only expected to rise. From large enterprises to small businesses, leveraging big data visualization can significantly impact performance, efficiency, and overall strategic decisions. In this blog, we will explore the top big data visualization tools, their features, and how to choose the best one for your needs.
Why Big Data Visualization is Important?
Big data visualization allows businesses and individuals to turn enormous amounts of raw data into understandable, actionable insights. As data continues to grow, the ability to represent this information in a visual format is vital to understanding trends, making decisions, and uncovering patterns that would otherwise remain hidden. As businesses rely on data for competitive advantage, investing in the right visualization tools is becoming increasingly critical. Some of the key Data Analytics Courses for Beginner big data visualization is essential include:
- Quick Insights: Visualizations allow stakeholders to interpret and act on data, reducing decision-making time quickly.
- Identifying Patterns: Effective visualizations can reveal trends, outliers, and patterns within large datasets.
- Improved Communication: Visualizing complex data makes it easier to communicate findings to both technical and non-technical audiences.
- Real-Time Decision-Making: Interactive visualizations allow businesses to make real-time data-driven decisions.
Become a Business Analyst expert by enrolling in this Business Analyst Training today.
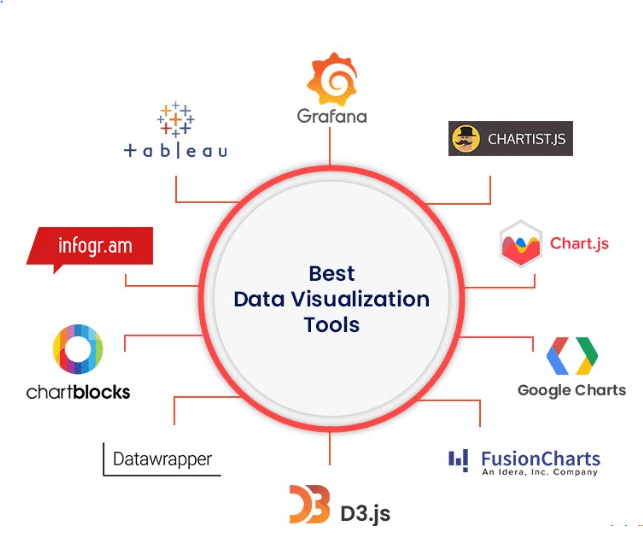
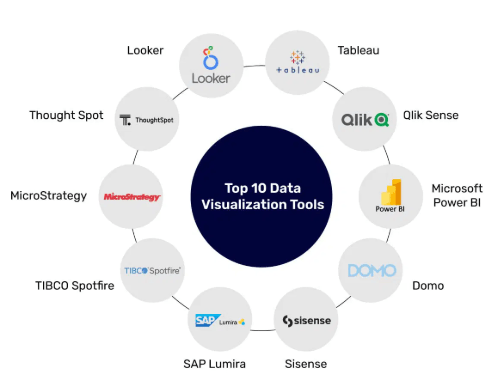
Top Big Data Visualization Tools
- Tableau:
Tableau has long been a leader in data visualization and continues to be one of the most popular tools available. It allows users to create various visualizations, including bar charts, heat maps, scatter plots, etc. Tableau’s intuitive interface makes it easy for beginners and advanced users to analyze and visualize big data.
Key Features: Drag-and-drop interface. Integration with cloud services like AWS and Google Cloud. Real-time data collaboration. Mobile access for on-the-go insights. Tableau is perfect for organizations presenting complex data interactively, making it an excellent choice for large enterprises and teams.
- Power BI :
Power BI by Microsoft has become a popular alternative to History and Evolution of Six Sigma. It offers seamless integration with Microsoft’s suite of business tools and excels at providing users with Interactive visualizations dashboards and reports that are easy to share across an organization.
Key Features:: Integration with Microsoft 365 and Azure. Real-time data analytics and alerts. Natural language queries for data exploration. Customizable dashboards. Power BI offers a familiar and efficient way to visualize and analyze big data for organizations already using Microsoft products.
- Qlik Sense :
Qlik Sense is known for its powerful associative data analytics engine and ease of use. It allows users to explore big data from multiple perspectives and create interactive dashboards and reports that adapt to their unique needs, making it a great tool for self-service analytics.
Key Features: Associative data model for better data exploration AI-driven insights and recommendations Multi-cloud data management Collaboration and sharing capabilities Qlik Sense’s combination of AI and self-service analytics makes it an excellent tool for organizations prioritizing flexible data exploration.
- D3.js:
D3.js is a JavaScript library for producing dynamic, Interactive visualizations in web browsers. Unlike traditional visualization tools, D3.js provides complete control over the final visualization, enabling users to create highly customized charts and graphs.
Key Features: Customizable, interactive visualizations Integration with other web-based technologies Powerful for large datasets and complex visualizations Open-source D3.js is ideal for developers who need to create complex, Cost of Quality CoQ visualizations and are comfortable with coding.
- Google Data Studio:
Google Data Studio is a free, cloud-based tool that allows users to create interactive dashboards and reports. It integrates well with other Google services like data analytics, BigQuery, and Google Sheets, making it an excellent option for businesses already using Google’s ecosystem.
Key Features: Easy-to-use interface Integration with Google products and third-party data sources Customizable templates for reports and dashboards Real-time data collaboration Google Data Studio is an accessible tool for businesses looking for an easy and affordable way to visualize big data, significantly if they’re already invested in the Google ecosystem.
- Looker:
Looker is a business intelligence platform that combines data analytics with powerful data visualization tools. It helps organizations create interactive dashboards and reports that drive business decision-making. Looker’s ability to integrate with various data sources makes it highly versatile.
Key Features: Data modeling layer for better data organization Real-time data visualization API integration for embedding visualizations in other platforms Collaboration and sharing options Looker is especially suitable for large enterprises that require high-level data exploration and detailed visual analytics.
- Sisense:
Sisense is a data analytics platform that allows users to transform complex data into interactive dashboards and visualizations. How to Use Control Chart Constants is particularly well-known for its ability to handle large datasets and integrate data from various sources.
Key Features: Integration with multiple data sources, including big data In-database analytics Customizable dashboards and visualizations AI-powered insights Sisense is perfect for businesses that deal with massive datasets and require robust, scalable solutions for data visualization.
- Zoho Analytics :
Zoho Analytics is a cloud-based data visualization and business intelligence platform for small to medium-sized businesses. Machine Learning allows users to create stunning visual reports and dashboards without requiring advanced technical skills.
Key Features: Drag-and-drop interface Integration with a wide range of data sources Real-time data collaboration AI-powered data insights Zoho Analytics is an excellent choice for SMBs that need powerful yet affordable visualization tools to understand their data.
- Understand Your Needs: Assess your team’s data requirements. Do you need real-time visualizations, advanced analytics, or simple dashboarding?
- Consider the Budget: While many tools offer free trials, pricing can vary widely. Choose a tool that fits within your budget.
- Evaluate Scalability: Make sure the tool can grow with your business, especially if you anticipate handling increasing data.
- Test the Tool: Use free trials to test different tools and determine which best suits your workflow.
- AI and Machine Learning Integration: Data visualization tools increasingly incorporate AI and machine learning capabilities to automate insights and recommendations.
- Augmented and Virtual Reality: Some tools explore AR and VR technologies to create immersive data visualization experiences.
- Increased Cloud Adoption: Cloud-based visualization tools are becoming more popular, allowing for better scalability, real-time collaboration, and easier access from anywhere.
Advance your Business Analyst career by joining this Business Analyst Training now.
Key Features to Look for in Big Data Visualization Tools
When evaluating big data visualization tools, it’s essential to consider certain features that make these tools effective for your business needs. Here are some key features to look for, Scalability The tool should handle large volumes of data efficiently. Customization Look for tools that offer Business Analytics With Excel Fundamentals in creating custom visualizations and personalized dashboards. Integration The tool should integrate seamlessly with other data sources, including cloud platforms, databases, and third-party apps. Real-Time Analytics and visualizing real-time data is crucial for decision-making. Ease of Use A user-friendly interface ensures that technical and non-technical users can create and interpret visualizations. Security Ensure the tool has robust security measures to protect sensitive data.

How to Choose the Right Big Data Visualization Tool
Selecting the right big data visualization tool depends on Business Analyst Training factors, including your business size, industry, data needs, and budget. Here are some tips for choosing the best tool:
Future Trends in Big Data Visualization
As we look ahead to 2025 and beyond, several trends are expected to shape the future of big data visualization:
Ready to excel in Business Analyst? Enroll in ACTE’s Business Intelligence Master Program Training Course and begin your journey today!
Real-World Applications of Big Data Visualization
Big data visualization isn’t just about creating charts it’s a critical tool that drives real-world impact across industries. In healthcare, it helps track disease outbreaks and patient outcomes in real time. Retail companies use it to analyze consumer behavior and optimize inventory based on demand trends. Financial institutions rely on visual analytics to detect fraud, manage risk, and forecast market movements. In manufacturing, it enables predictive maintenance by identifying equipment failure patterns. Governments and public sector organizations use big data dashboards for smart city planning, traffic control, and Exploring Different Types of Market Structures. By translating vast datasets into clear, actionable visuals, organizations gain the clarity needed to make timely, data-driven decisions that directly affect performance and strategy. Additionally, education sectors are adopting visualization tools to monitor student performance and improve learning strategies. Marketing teams leverage data visualizations to track campaign effectiveness and audience engagement. Energy companies use them to monitor usage patterns and predict equipment failures. In logistics and supply chain, real-time data visualization helps optimize routes and manage delivery times efficiently. These use cases illustrate how powerful visuals can transform complex data into insights that fuel innovation and operational excellence.
Are you getting ready for your Business Analyst interview? Check out our blog on Business Analyst Interview Questions and Answers!
Challenges in Big Data Visualization
While big data visualization tools offer numerous advantages, they also present several challenges that organizations must navigate. One of the primary concerns is data quality—inaccurate, incomplete, or inconsistent data can lead to misleading visualizations that hinder decision-making rather than support it. Another challenge is complexity; working with large and diverse datasets often requires advanced technical skills, making it difficult for non-technical users to build effective visual representations. Additionally, integration issues may arise, especially when visualization tools cannot seamlessly connect with various data sources or real-time streams, leading to analysis delays or data silos. Beyond these, performance limitations can occur when tools struggle to process or render vast amounts of data quickly, affecting user experience. Business Analyst Job Description and governance concerns also come into play, as visualizing sensitive or regulated data requires strict compliance protocols. Scalability is another issue—some tools may not scale efficiently as data volume grows. User adoption can be slow if the tools are not intuitive or aligned with business workflows. Finally, maintenance and cost of deploying and managing high-end visualization platforms can be substantial, especially for smaller organizations.
Conclusion
In 2025, the demand for big data visualization tools is expected to grow, driven by the increasing importance of data in decision-making and business operations. By selecting the Machine Learning that suits your specific needs and addressing common challenges, organizations can unlock the true potential of their data, gain valuable insights, and make more informed, timely decisions. Business Analyst Training a small business or a large enterprise, leveraging the best big data visualization tools will enable you to stay competitive, innovate, and drive success in the data-driven future.