
Last updated on 08th May 2025| 8870
- Introduction to Tableau
- Features of Tableau
- Tableau Editions and Deployment Options
- How Tableau Works
- Tableau vs Other BI Tools
- Getting Started with Tableau
- Tableau Roadmap: What’s Next?
- Conclusion
Introduction to Tableau
Tableau is a leading data visualization and business intelligence (BI) software that allows users to create interactive and shareable dashboards. It enables users to connect to various data sources, clean and transform data, perform analysis, and visualize it in the form of charts, graphs, and tables. Tableau’s user-friendly interface allows both technical and non-technical users to engage with complex datasets and derive insights from them. For those looking to enhance their data analysis skills, Business Analyst Training can be a valuable resource. Tableau has become immensely popular because of its intuitive design and powerful data visualization capabilities. Unlike traditional data analytics tools, Tableau provides a visual interface that makes it easy for users to explore their data and uncover patterns without requiring deep technical knowledge. Tableau’s drag-and-drop interface makes it simple for users to create visualizations without the need for coding. Tableau allows users to handle large datasets with high speed, thanks to its in-memory technology.
Features of Tableau
Data ConnectivityOne of Tableau’s standout features is its ability to connect to a wide range of data sources. Whether you’re working with Excel files, SQL databases, cloud platforms like Google Analytics, or big data tools such as Hadoop, Tableau can seamlessly integrate with these sources to provide a unified view of your data. This versatility makes it a vital tool in the evolving Business Intelligence Landscape Key connectivity features include:
- Live Connections: Tableau allows users to connect to databases in real-time, enabling live queries and up-to-date visualizations.
- Extracts: For faster performance, Tableau allows users to extract data into an optimized in-memory format, which can then be used for analysis. Visual Analytics
- Bar and Line Charts: Simple but effective ways to represent data trends.
- Heatmaps: Highlight data points with color gradients to show patterns.
- Geographical Maps: Tableau can map data using built-in geocoding features, making it easy to visualize location-based insights.
- Customizable Dashboards: Users can create dashboards that allow for multiple visualizations, filters, and interactivity all in one place.
Tableau’s visual analytics capabilities are unparalleled, allowing users to create stunning and interactive visualizations that help communicate data insights effectively. Some of the visualization features include:
Excited to Achieve Your Business Analyst Certification? View The Business Analyst Online course Offered By ACTE Right Now!
Dashboards and ReportsTableau’s ability to create dashboards is one of its most powerful features. Dashboards combine multiple visualizations into a single screen and allow users to analyze data from different perspectives. Additionally, Tableau supports reporting features that allow for detailed, scheduled reports that can be shared across teams.
Collaboration and SharingTableau makes it easy to share dashboards, visualizations, and reports with others. Users can publish their work to Tableau Server or Tableau Online, share via Tableau Public, or export dashboards as PDFs and images. For those managing performance and scalability, Master Tableau Server Performance Tuning Tips can help optimize how content is delivered. Interactive dashboards can also be shared via a URL, where others can view and interact with the data.
Tableau MobileTableau’s mobile app allows users to access dashboards and reports on the go. With the mobile version, you can explore visualizations, make annotations, and even interact with filters to get the insights you need, regardless of where you are.
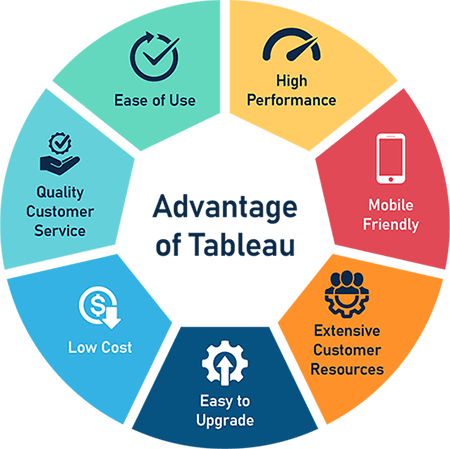
Tableau Editions and Deployment Options
Tableau offers different products and deployment options based on the needs of users and organizations.
Tableau DesktopTableau Desktop is the primary tool for creating visualizations, building dashboards, and performing data analysis. It is available in two versions: Personal and Professional, with Professional offering broader data connectivity options.
Tableau ServerTableau Server is used by organizations to share and collaborate on Tableau workbooks and dashboards. It provides secure, centralized access to dashboards and allows users to interact with them in real time. When combined with Big Data Visualization Tools, Tableau Server becomes even more powerful, enabling teams to explore and present large-scale data insights efficiently.
Tableau OnlineTableau Online is a cloud-based version of Tableau Server that allows users to share dashboards without the need for an on-premise server. It’s a good option for businesses that prefer a fully hosted solution.
Tableau PublicTableau Public is a free version of Tableau that allows users to create and publish visualizations publicly. While it has some limitations in terms of data security, it’s an excellent tool for personal or open-data projects.

How Tableau Works
Data Preparation and CleaningBefore creating visualizations in Tableau, users need to prepare and clean their data. Tableau provides several tools for data preparation, including:
- Data Interpreter: Helps clean up data by removing unnecessary formatting.
- Data Blending: Allows combining data from multiple sources, even when they don’t have a direct relationship.
- Calculated Fields: Lets users create custom calculations and transformations directly in Tableau. Data Visualization
- Pie Charts
- Bar Charts
- Scatter Plots
- Area Charts
- Histograms
- Trend Lines: Adding trend lines to visualizations to track data patterns over time.
- Forecasting: Predicting future trends based on historical data.
- Clustering: Grouping similar data points to identify patterns and anomalies.
- Connect to Your Data: Choose a data source and connect to it.
- Create Visualizations: Use drag-and-drop to create different visualizations.
- Build a Dashboard: Combine multiple visualizations into a single dashboard.
- Publish and Share: Share your dashboard with others via Tableau Server, Tableau Online, or Tableau Public. Tips for New Users
- Start simple: Focus on one visualization at a time and build your skills.
- Learn keyboard : shortcuts to speed up your workflow.
- Explore Tableau’s : extensive online resources, including tutorials and forums.
- AI-Powered Insights: Leveraging artificial intelligence to automatically generate insights from data.
- Improved Data Prep: Enhancements to data cleaning and preparation tools for faster and more accurate data handling. These improvements, when integrated with Data Warehouse Tools can significantly streamline workflows and boost overall data management efficiency. Strategic Vision for Tableau
- Focusing on self-service BI to empower users to create their own visualizations and insights.
- Improving collaboration features to foster teamwork and decision-making across organizations.
- Advancing integration with other analytics tools and platforms. Innovations in Data Visualization
Once the data is prepared, users can start visualizing it. Tableau offers a variety of charts and graphs, such as:
The visualizations are interactive, so users can filter data and drill down into details as needed.
Interactivity and FilteringTableau dashboards are highly interactive, allowing users to filter data, hover over elements to get more information, and drill down into specific details. Filters can be applied at various levels, including across the entire dashboard or within individual visualizations. For those looking to enhance their data interpretation and decision-making capabilities, SAS Analytics is Essential for Data-Driven offers valuable tools and insights that complement Tableau’s interactive features.
Advanced AnalyticsTableau provides advanced analytics capabilities, including:
Excited to Obtaining Your Business Analyst Certificate? View The Business Analyst Training Offered By ACTE Right Now!
Tableau vs Other BI Tools
While Tableau is a recognized leader in the business intelligence (BI) space, it’s essential to compare it with other popular tools to fully understand its strengths and limitations. When comparing Tableau vs Power BI, Tableau is known for its intuitive user interface, making it easier for users to navigate and create visualizations, whereas Power BI may present a steeper learning curve for non-technical users. In terms of data connectivity, Tableau supports a wider variety of data sources, offering more flexibility, while Power BI is more optimized for integration within the Microsoft ecosystem. For those exploring careers in analytics or wanting to deepen their tool knowledge, Business Analyst Training can be an excellent starting point. Pricing-wise, Power BI is generally more affordable, which makes it especially attractive to small businesses.
Comparing Tableau vs Qlik, Tableau emphasizes user-friendly visualization, whereas Qlik’s associative data model caters more to advanced users who require deep, complex data analysis. Performance-wise, Tableau is known for its speed and strong visualization capabilities, while Qlik stands out in managing and analyzing large datasets efficiently. In the case of Tableau vs Excel, Tableau offers more powerful, dynamic, and interactive visualization tools, which are ideal for modern BI needs. Excel, on the other hand, is centered around spreadsheet-based analysis and basic charting. When it comes to scalability, Tableau performs significantly better with large datasets, while Excel may slow down or become less effective as data size increases.
Interested in Pursuing Business Intelligence Master’s Program? Enroll For Business Intelligence Master Course Today!
Getting Started with Tableau
Setting Up TableauTo start using Tableau, you can download Tableau Desktop from the official website. For a more scalable solution, businesses can opt for Tableau Server or Tableau Online.
Basic Steps for Building Your First Dashboard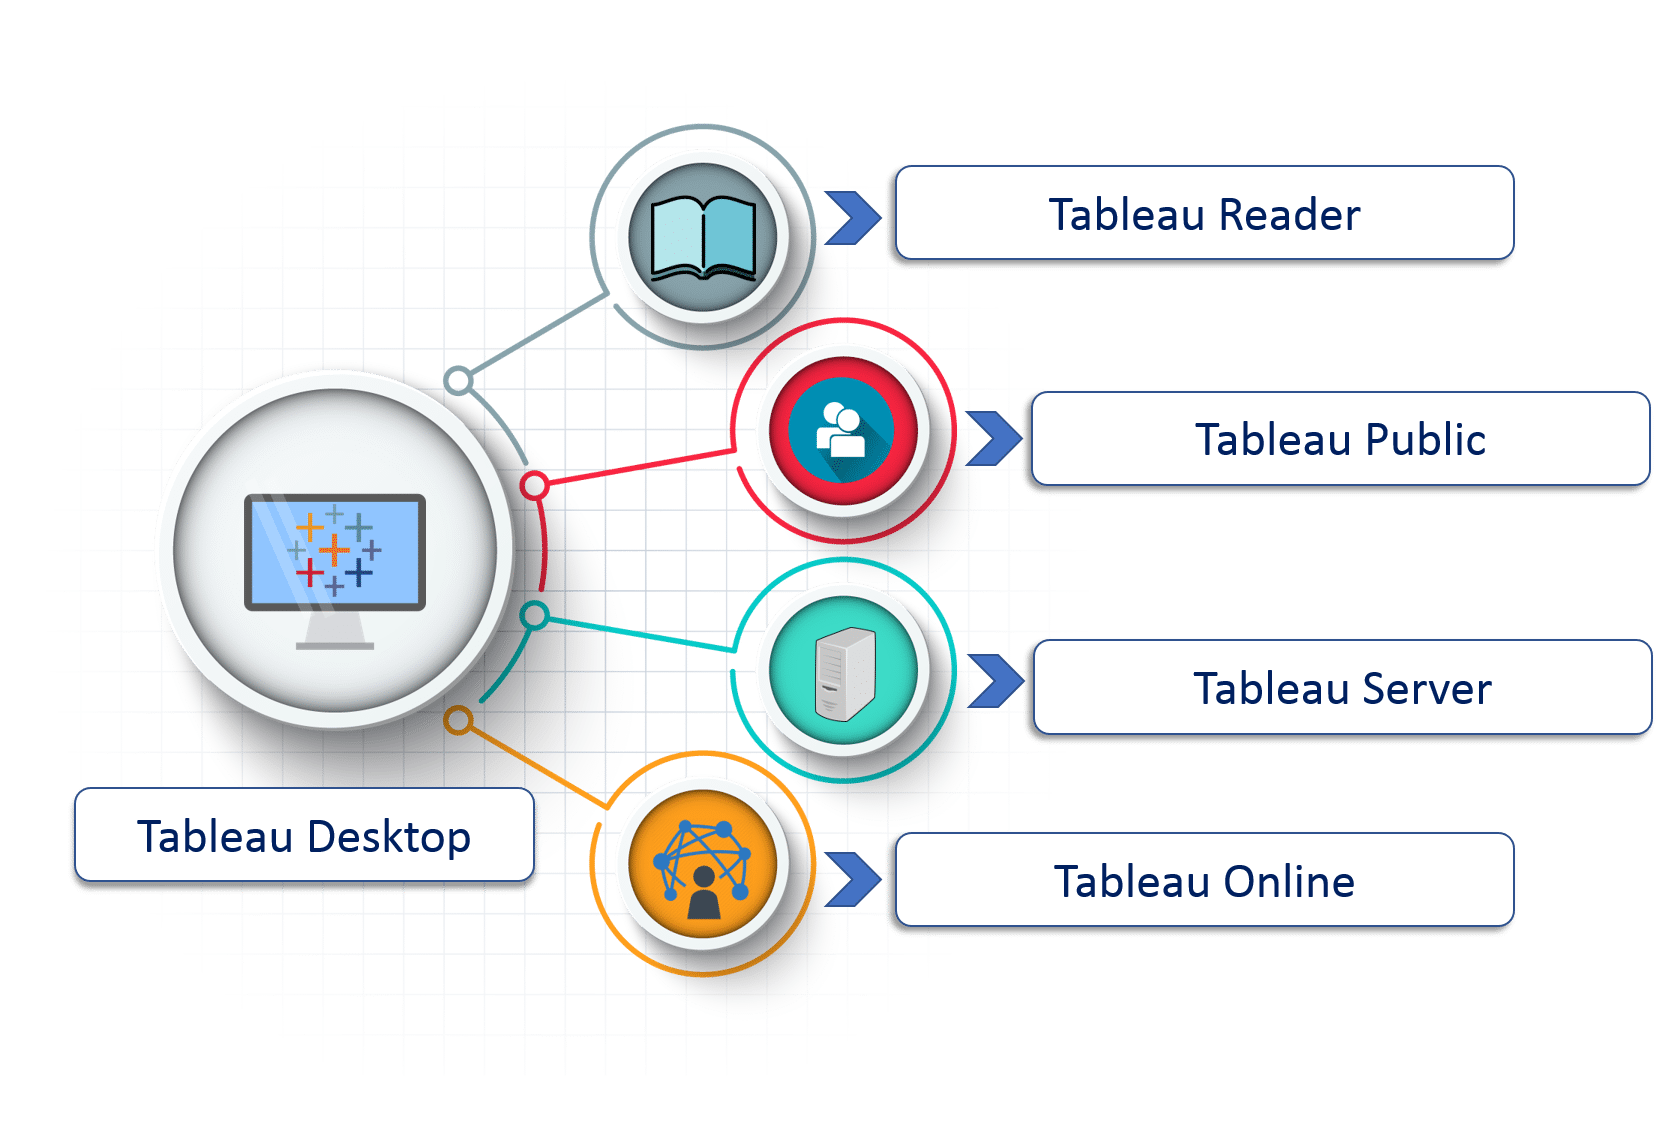
Tableau Roadmap: What’s Next?
Upcoming FeaturesTableau is continuously improving its offerings, with upcoming features such as:
Tableau’s vision is to continue empowering users to make data-driven decisions by:
Tableau is also working on innovations like augmented analytics and more immersive visualizations to take data storytelling to the next level.
Getting Ready for a Business Analyst Job Interview? Check Out Our Blog on Business Analyst Interview Questions & Answer
Conclusion: Future of Data Integration and Its Impact
Tableau is a highly powerful data visualization tool that has revolutionized the way businesses and individuals interact with and analyze data. Known for its user-friendly interface and advanced analytics capabilities, Tableau has become an invaluable asset for those looking to make data-driven decisions. Its drag-and-drop functionality allows even beginners to easily create visualizations, while more experienced users can leverage complex analytical features to uncover deeper insights. Tableau’s ability to handle large datasets and connect to various data sources makes it an essential tool for businesses across industries. For those aspiring to build a career in data analysis, Business Analyst Training can provide the foundational skills needed to master tools like Tableau. Looking ahead, Tableau is set to continue evolving with exciting new features and innovations on the horizon. As the demand for data-driven insights grows, Tableau is well-positioned to remain a leader in the field of data visualization. Whether you’re just starting out in data analysis or a seasoned professional, Tableau provides all the tools you need to explore your data, tell compelling stories through visualizations, and make more informed, impactful decisions. Its ongoing development ensures that Tableau will continue to be an indispensable tool for anyone seeking to gain valuable insights and drive business success through data.