Last updated on 12th Jun 2025| 10882
- Introduction
- What is Power BI?
- What is SSRS?
- Power BI vs SSRS: A Detailed Comparison
- Which Tool is Best for Your Organization?
- Pros and Cons of Power BI
- Pros and Cons of SSRS
- Conclusion
Introduction
In today’s data-driven business environment, organizations rely heavily on tools that enable them to analyze, report, and visualize data effectively. Among the many Business Intelligence (BI) tools available, Power BI and SQL Server Reporting Services (SSRS) are two of Microsoft’s most widely used solutions. While both serve the purpose of turning raw data into meaningful reports, they differ significantly in their capabilities, design, and target users. Power BI is a modern, cloud-based BI platform designed for interactive data visualization and self-service analytics. It allows users to connect to various data sources, create dynamic dashboards, and share reports in real time, skills emphasized in Business Analyst Training. With its intuitive drag-and-drop interface and integration with other Microsoft tools like Excel and Azure, Power BI is ideal for business users and analysts who need fast, visual insights and collaboration features. In contrast, SSRS is a more traditional, server-based reporting tool used primarily for creating paginated, static reports that are typically distributed on a scheduled basis. It is best suited for developers and IT teams who require pixel-perfect formatting and advanced control over data presentation. SSRS is commonly used in environments that require compliance-ready reports, such as in finance or healthcare. This blog will provide a detailed comparison of Power BI and SSRS, exploring their features, use cases, deployment options, and strengths. By understanding the differences between these tools, businesses can choose the solution that best aligns with their data strategy, reporting needs, and technical capabilities.
Are You Interested in Learning More About Business Analyst? Sign Up For Our Business Analyst Training Today!
What is Power BI?
Power BI is a powerful cloud-based business intelligence (BI) tool developed by Microsoft, designed to help organizations transform raw data into meaningful insights through interactive dashboards and reports. Unlike traditional reporting solutions that often require heavy IT involvement, Power BI empowers business users to perform their own analysis and visualizations with minimal technical expertise. This self-service capability makes it a popular choice for companies of all sizes looking to make data-driven decisions more quickly and efficiently, an important skill for the Business Analyst Career Path. One of the standout features of Power BI is its real-time data visualization, which allows users to monitor key metrics as they change. It supports integration with a wide variety of data sources, including Excel, SQL Server, Azure, SharePoint, and third-party platforms like Google Analytics, Salesforce, and more. This makes it easy to consolidate and analyze data from multiple systems in one unified view. Power BI’s architecture is built around several key components. Power BI Desktop is the development tool used by analysts and report creators to import data, create visualizations, and build data models.
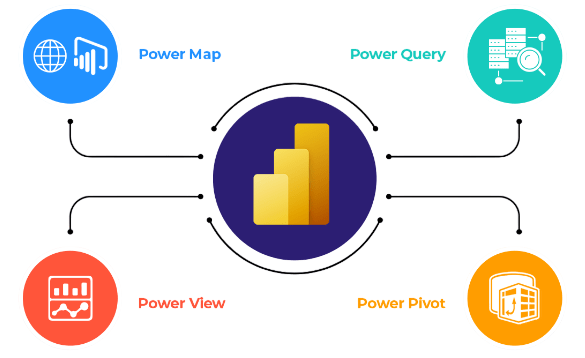
Once the reports are ready, they can be published to the Power BI Service, a cloud platform where users can share, collaborate, and schedule report refreshes. For users on the go, Power BI Mobile provides access to dashboards and reports via smartphones or tablets, ensuring that insights are available anytime, anywhere. Overall, Power BI offers a flexible, user-friendly, and scalable solution for modern business intelligence needs, helping organizations turn data into action.
What is SSRS?
- Definition: SSRS is a server-based reporting platform developed by Microsoft that allows users to create, manage, and deliver paginated reports.
- Report Types: It primarily generates formatted, pixel-perfect reports that are ideal for printing and sharing in fixed layouts, such as invoices, financial statements, and operational reports.
- Data Sources: SSRS connects to a wide range of data sources including SQL Server databases, Oracle, XML, and other ODBC-compliant sources through queries or stored procedures.
- Deployment: Reports created in SSRS are typically deployed on an on-premises report server but can also be accessed via web portals or integrated into applications.
- Report Design Tools: SSRS reports are designed using Visual Studio or the standalone Report Builder tool, which provide a range of design and layout capabilities relevant to discussions on SAS Vs R.
- Security and Management: SSRS includes robust security features allowing role-based access control, report scheduling, and subscription management for automated report delivery.
- Use Cases: It is widely used in enterprises for operational and financial reporting where precise formatting, regulatory compliance, and scheduled distribution are critical.
- Purpose and Usage: Power BI is designed for self-service business intelligence and interactive data visualization. SSRS is primarily used for generating pixel-perfect, paginated reports suited for printing and document-style formats.
- Report Interactivity: Power BI offers highly interactive dashboards with filters, slicers, and drill-down capabilities. SSRS reports are mostly static, though they can include basic interactivity like toggling visibility or drill-through actions.
- Data Modeling and Analysis: Power BI includes powerful in-memory data modeling capabilities using DAX and Power Query, essential topics in Business Analyst Training.
- Deployment and Accessibility: Power BI reports are hosted on the cloud or on-premises with Power BI Report Server. SSRS is strictly an on-premises solution unless integrated with Power BI Report Server for hybrid use.
- User Experience: Power BI is designed for business users and analysts, offering an easy-to-use interface. SSRS is more developer-centric, often requiring technical knowledge to build and manage reports using Visual Studio.
- Visualization and UI: Power BI offers a wide variety of modern, customizable visuals, including third-party visuals via its marketplace. SSRS visuals are more basic and primarily focused on tabular and chart-based outputs.
- Licensing and Cost: Power BI follows a subscription-based model (Free, Pro, Premium). SSRS is included with SQL Server licensing, making it more cost-effective for traditional reporting in SQL Server environments.
- Complex Licensing Structure: The tiered licensing (Free, Pro, Premium) can be confusing and expensive as organizational use scales up.
- User-Friendly Interface: Power BI has an intuitive drag-and-drop interface, making it easy for both beginners and professionals to create reports and dashboards without extensive coding knowledge.
- Wide Range of Data Connectors: It supports numerous data sources including Excel, SQL Server, SharePoint, Google Analytics, and cloud services, providing flexibility in data integration.
- Advanced Data Modeling: Power BI allows powerful data manipulation using Power Query and DAX, enabling users to create complex models and calculations with ease.
- Real-Time Dashboards: It supports real-time data streaming and scheduled refreshes, allowing users to monitor live data and KPIs effectively, a functionality often compared in discussions about Data Analyst VS Data Scientist roles.
- Performance Issues with Large Datasets: Power BI may experience performance slowdowns when handling massive datasets, requiring model optimization or use of Power BI Premium.
- Limited Customization in Visuals: While the visual options are strong, highly customized visualizations may need third-party tools or scripting with R/Python, adding complexity.
To Explore Business Analyst in Depth, Check Out Our Comprehensive Business Analyst Training To Gain Insights From Our Experts!
Power BI vs SSRS: A Detailed Comparison

Which Tool is Best for Your Organization?
Choosing the best business intelligence (BI) tool for your organization depends on a variety of factors, including the size of your business, technical expertise of your team, data complexity, reporting needs, and budget. Tools like Power BI, MSBI, and SSRS each offer distinct advantages and are designed to meet different organizational requirements. If your organization prioritizes real-time data visualization, user-friendly dashboards, and self-service analytics, Power BI is a strong choice. It’s particularly effective for businesses that want to empower non-technical users to explore data independently and collaborate on insights, which aligns with the goals of What is a Business Analysis. Power BI is also cost-effective and integrates seamlessly with other Microsoft products, making it ideal for organizations already in the Microsoft ecosystem. For businesses with complex data integration and warehousing needs, MSBI offers a comprehensive solution. It’s best suited for large enterprises that require robust back-end data processing, including ETL (Extract, Transform, Load), multidimensional analysis, and detailed reporting. MSBI’s modular structure with SSIS, SSAS, and SSRS provides flexibility and control over the entire data pipeline. SSRS, on the other hand, is ideal for organizations needing pixel-perfect, paginated reports for operational or compliance purposes. It’s especially useful for structured, highly formatted reports delivered on a schedule. Ultimately, the best tool depends on your specific BI goals. In many cases, combining tools like using MSBI for data preparation and Power BI for visualization can provide a comprehensive solution tailored to both technical and business user needs.
Want to Pursue a Business Intelligence Master’s Degree? Enroll For Business Intelligence Master Program Training Course Today!
Pros and Cons of Power BI
Pros and Cons of SSRS
SQL Server Reporting Services (SSRS) is a server-based reporting tool developed by Microsoft that enables users to create, manage, and deliver both traditional and interactive reports. It is widely used in enterprise environments for its robust capabilities in producing structured, paginated reports. Like any tool, SSRS comes with its own set of strengths and limitations. One of the main advantages of SSRS is its ability to generate highly formatted, pixel-perfect reports that are ideal for operational and regulatory reporting. It supports a variety of data sources and export formats, including Excel, PDF, Word, and HTML, making it versatile for different business needs, much like how data interpretation varies in Common Cause Vs Special Cause Variation. SSRS also allows for automated report generation and delivery, enabling scheduled report distribution via email or to file shares. Its tight integration with SQL Server and Active Directory enhances security, scalability, and performance, especially in enterprise environments. However, SSRS also has several limitations. It is less suitable for interactive or real-time data exploration, lacking the dynamic dashboards and self-service capabilities found in tools like Power BI. Its user interface is more complex and typically requires developer involvement to build and customize reports, making it less accessible for non-technical users. Additionally, SSRS is limited to on-premises deployment unless used with Power BI Report Server, which might not align with organizations moving toward cloud-based solutions. In summary, SSRS is a powerful reporting tool for generating formal, structured reports, but it may not be ideal for agile, interactive data analysis or modern BI needs.
Want to Learn About Business Analyst? Explore Our Business Analyst Interview Questions and Answers Featuring the Most Frequently Asked Questions in Job Interviews.
Conclusion
Both Power BI and SQL Server Reporting Services (SSRS) are powerful reporting tools from Microsoft, but they are designed to meet different business intelligence (BI) needs. Understanding their strengths and limitations is essential when choosing the right tool for your organization. Power BI is a modern, cloud-based BI platform that focuses on interactive data visualization, real-time dashboards, and self-service analytics. It enables users to explore data intuitively with minimal technical expertise and supports seamless integration with a wide variety of data sources. Power BI is ideal for organizations that value agility, collaboration, and the ability to access insights anytime, anywhere, especially through its mobile apps and cloud service, making it essential in Business Analyst Training. On the other hand, SSRS is a more traditional, server-based reporting tool built for generating highly formatted, paginated reports. It provides precise control over layout and formatting, making it well-suited for compliance reporting, financial documents, and other scenarios where printed reports are important. SSRS is typically used in environments where data security, scheduling, and on-premises deployment are critical. Ultimately, the decision between Power BI and SSRS depends on your organization’s reporting goals, infrastructure, and user base. If your focus is on interactive, visual storytelling with data, Power BI is likely the better fit. If your business needs revolve around detailed, formal reports that require controlled formatting and delivery, SSRS offers the reliability and control needed for enterprise reporting. In some cases, combining both tools provides a comprehensive reporting solution that leverages the strengths of each.


