
Last updated on 08th May 2025| 9268
- Introduction to Tableau
- What Is Spotfire?
- Key Features of Spotfire
- How Spotfire Works: An Overview
- Spotfire vs. Other Analytics Tools
- Benefits of Using Spotfire for Your Business
- How to Get Started with Spotfire
- Conclusion
Excited to Achieve Your Business Analyst Certification? View The Business Analyst Online course Offered By ACTE Right Now!
Introduction
In today’s data-driven world, businesses are constantly collecting vast amounts of data, making it crucial to have effective tools that can help them interpret and utilize this information. Spotfire is one such powerful analytics platform that allows organizations to turn complex data into actionable insights. It provides an intuitive interface for visualizing and analyzing a variety of data, including sales figures, customer feedback, and operational performance. To better understand how tools like Spotfire fit into broader data strategies, consider exploring our Business Analyst Training . Spotfire’s capabilities enable businesses to easily explore their data, uncover hidden patterns, and make more informed decisions. In this article, we will explore Spotfire’s features, how it works, and the advantages it offers to companies. For businesses looking to integrate data analytics into their operations, Spotfire stands out as a versatile and valuable tool, helping to elevate data-driven decision-making and drive better results.
What Is Spotfire?
Data ConnectivityTIBCO Spotfire is a powerful data analytics platform that specializes in data visualization and business intelligence (BI). Initially launched by Spotfire Inc. in 2000 and later acquired by TIBCO Software in 2007, Spotfire has evolved into a comprehensive platform for analyzing data and generating insights across industries. At its core, Spotfire allows users to perform interactive analytics and visualize data in a variety of formats, including graphs, charts, tables, and dashboards. It can connect to a wide range of data sources such as SQL databases, cloud-based data warehouses, spreadsheets, and even big data platforms. Spotfire’s capabilities are not limited to simple reporting but extend to predictive analytics, data wrangling, and real-time data visualization, making it a versatile tool for businesses in various sectors, including finance, healthcare, retail, and manufacturing. If you’re exploring roles in analytics, take a look at our Business Analyst Job Description to understand the key responsibilities and skills involved.
Key Features of Spotfire
Spotfire’s popularity in the business intelligence market is attributed to its diverse set of features. Some of the key features that set Spotfire apart include:
- Data Visualization: Spotfire allows users to create powerful visualizations, including heat maps, bar charts, pie charts, scatter plots, and trend lines. These visualizations help businesses gain insights quickly and make informed decisions.
- Data Connectivity: Spotfire supports connectivity with a variety of data sources, including relational databases (like MySQL and Oracle), cloud platforms (such as AWS and Google Cloud), and even big data platforms like Hadoop and Spark.
- Advanced Analytics and AI: With built-in analytics, Spotfire makes it possible to perform statistical analysis, predictive modeling, and machine learning directly within the platform. As one of the leading Big Data Visualization Tools, Spotfire allows you to create custom algorithms to forecast trends or detect anomalies.
- Data Wrangling and Transformation: Spotfire provides tools for data cleaning, manipulation, and transformation. This feature enables users to prepare and refine data before analysis, ensuring that the final insights are accurate.
- Real-Time Analytics: Spotfire can process data in real time, allowing businesses to monitor live performance metrics and make decisions instantly. This is especially beneficial for industries like finance, healthcare, and manufacturing, where real-time insights are critical.
- Dashboards and Reporting: Spotfire’s interactive dashboards let users display real-time analytics and performance data, making it easier to share insights across teams. Custom reports can also be generated and shared with stakeholders.
- Collaboration Features: Spotfire allows teams to collaborate on data analysis, share insights, and track progress. Users can annotate visualizations, leave comments, and even use data storytelling features to present results.

How Spotfire Works: An Overview
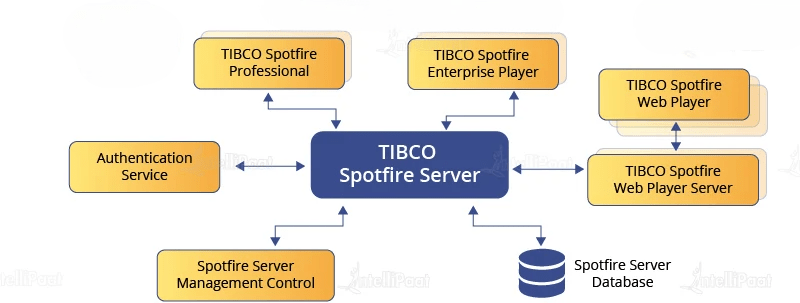
Spotfire’s intuitive interface enables users to perform sophisticated analytics without requiring deep technical knowledge. The process begins with importing data from various sources, including Excel, cloud databases, or big data environments, as Spotfire supports a wide range of formats and connections. After data is imported, users proceed with data wrangling and preparation, where tools are available to clean, transform, and format the data into a usable structure. Once the data is ready, users can begin the analysis process, applying filters, performing statistical operations, and creating visualizations, whether it’s basic aggregation or complex regression analysis. Spotfire’s visualization tools make it easy to generate interactive graphs and charts by dragging and dropping data fields or using predefined templates. After analysis, insights can be shared through collaborative dashboards, enabling teams to work together on reports and make informed decisions. To better understand how Spotfire fits into the broader Business Intelligence Landscape, consider exploring its integration and role in modern BI practices. With real-time analytics, Spotfire helps businesses quickly make decisions, which is crucial in fast-paced environments where timely action is essential.
Excited to Obtaining Your Business Analyst Certificate? View The Business Analyst Training Offered By ACTE Right Now!
Spotfire vs. Other Analytics Tools
When comparing Spotfire to other popular analytics platforms, it’s essential to consider the specific needs of your business. Some common alternatives to Spotfire include Tableau, Power BI, and QlikView. Here’s a brief comparison:
- Spotfire vs. Tableau: Tableau is another widely used data visualization tool, and it offers powerful data visualization features like Spotfire. However, Spotfire tends to be more suited for advanced analytics and predictive modeling, while Tableau excels in creating beautiful and intuitive visualizations. Spotfire also has more robust real-time analytics and data wrangling capabilities.
- Spotfire vs. Power BI: Power BI, Microsoft’s BI tool, is popular for its ease of use and integration with Microsoft products. While Power BI is great for simple reporting and dashboarding, Spotfire offers more advanced analytics and AI capabilities. Spotfire is also more suitable for businesses that require high-performance computing and complex data integrations.For those looking to optimize their analytics environments, explore our Master Tableau Server Performance Tuning Tips
- Spotfire vs. QlikView: QlikView is known for its associative data model, which allows users to explore data freely. Spotfire, however, stands out with its superior data visualization and predictive analytics features, making it more suited for businesses with more complex analytics needs.
Interested in Pursuing Business Intelligence Master’s Program? Enroll For Business Intelligence Master Course Today!
Benefits of Using Spotfire for Your Business
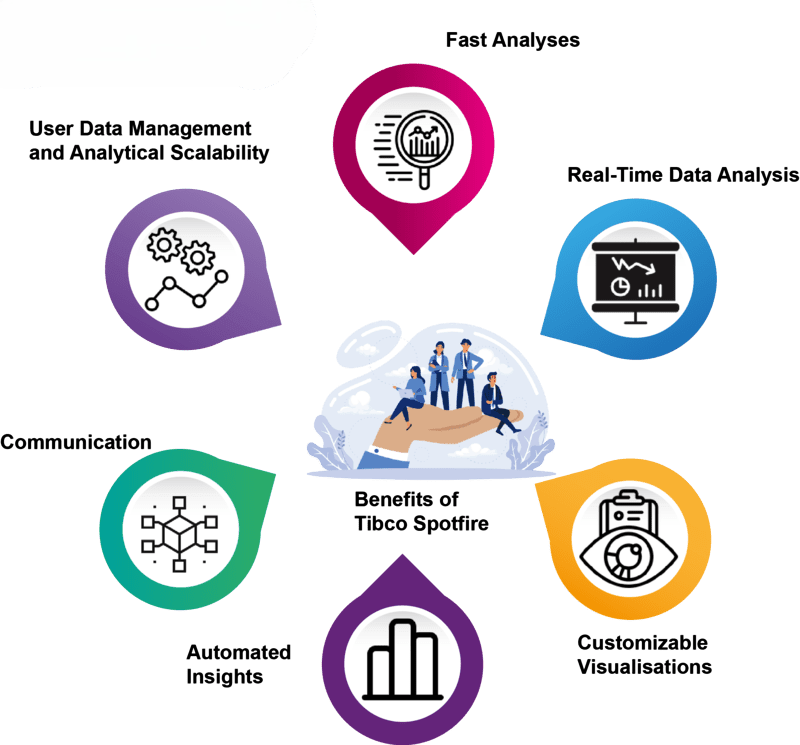
Incorporating Spotfire into your business processes offers a wide range of benefits that can significantly enhance decision-making and operational efficiency. One of the key advantages is informed decision-making. Spotfire’s advanced analytics and real-time data processing capabilities allow businesses to analyze data as it’s collected, enabling them to identify trends and adjust strategies promptly. It also promotes improved efficiency by automating tasks such as data wrangling, statistical analysis, and reporting. This automation frees up employees to focus more on interpreting data and making strategic decisions rather than spending excessive time on data preparation.
Excited to Achieve Your Business Analyst Certification? View The Business Analyst Online course Offered By ACTE Right Now!
Additionally, Spotfire is designed with scalability in mind, accommodating both small datasets and large volumes of big data, which makes it suitable for businesses of all sizes. To build a strong foundation in data analytics and decision-making, check out our Business Analyst Training Collaboration is another major benefit, as Spotfire allows teams to work together through interactive dashboards and shared data, ensuring all team members have access to the latest information. With its advanced analytics capabilities, including built-in machine learning and predictive analytics, Spotfire enables businesses to discover hidden patterns and trends, particularly valuable in sectors like finance, healthcare, and retail. Finally, Spotfire supports customizable reporting, allowing organizations to build tailored dashboards and reports that deliver actionable insights to stakeholders and enhance transparency throughout the organization.
How to Get Started with Spotfire
Getting started with Spotfire is simple, even if you have no prior experience with data analytics tools. Here’s a step-by-step guide:
- Sign Up for Spotfire: You can start by signing up for a trial version of Spotfire on the TIBCO website. The trial gives you access to most of the platform’s features, allowing you to explore its capabilities.
- Install and Set Up: After signing up, you’ll need to install the software on your machine or set up an online account, depending on the version you choose. Spotfire offers both desktop and cloud-based versions. To learn more about common obstacles during installation and setup, check out our Integration Challenges
- Import Your Data: Once set up, the next step is to import your data. Spotfire supports various data formats, including Excel, CSV, and SQL databases. Connect your data source and start exploring.
- Begin Creating Visualizations: Once your data is loaded, you can begin creating interactive visualizations. Spotfire offers a drag-and-drop interface, so you can quickly build charts, graphs, and dashboards.
- Collaborate and Share Insights: As you generate insights, you can share them with colleagues or stakeholders. Spotfire makes it easy to create reports and dashboards that can be shared within your organization.
Getting Ready for a Business Analyst Job Interview? Check Out Our Blog on Business Analyst Interview Questions & Answer
Conclusion: Future of Data Integration and Its Impact
In today’s fast-paced business world, having access to real-time, actionable insights is crucial for success. Spotfire offers businesses a comprehensive platform to analyze, visualize, and interpret data, making it a vital tool for any company looking to stay competitive. Whether you’re analyzing historical performance, predicting future trends, or making data-driven decisions on the fly, Spotfire provides the features and flexibility you need. To deepen your understanding of data analysis and business intelligence tools, explore our Business Analyst Training . With its powerful data visualization, advanced analytics capabilities, and easy integration with various data sources, Spotfire stands out as one of the top business intelligence platforms. By adopting Spotfire, businesses can enhance their decision-making processes, improve efficiency, and unlock valuable insights that drive growth and success.