
Last updated on 06th Jun 2025| 11058
- Overview of Tableau and Excel
- Data Visualization Capabilities Comparison
- Data Handling and Processing
- User Interface and Usability
- Integration with Other Tools and Data Sources
- Advanced Analytics and Business Intelligence
- Collaboration and Sharing Features
- Performance and Scalability
Overview of Tableau and Excel
Tableau and Excel are two powerful tools used for data analysis and visualization, each offering unique strengths. Excel, a widely used spreadsheet program, excels in organizing, analyzing, and presenting data through features like pivot tables, formulas, and charts. Its user-friendly interface makes it accessible to individuals across various industries, allowing for quick calculations and data manipulation. However, as datasets grow larger and more complex, Excel can become cumbersome and limited in its visualization capabilities. Tableau, on the other hand, is a specialized data visualization tool designed to handle large datasets and provide dynamic, interactive visualizations, making it an essential component of Business Analyst Training. It allows users to create a wide range of charts, graphs, and dashboards, enabling better data insights. Tableau’s ability to connect to different data sources in real-time and its powerful drag-and-drop interface make it ideal for users looking to explore data trends and patterns visually. While Excel is more suited for individual analysis and smaller datasets, Tableau is preferred for advanced, interactive visualizations and business intelligence tasks. Both tools complement each other. Excel is excellent for detailed data analysis, while Tableau enhances the storytelling aspect of data with its interactive and visually appealing presentations.
Are You Interested in Learning More About Business Analyst? Sign Up For Our Business Analyst Training Today!
Data Visualization Capabilities Comparison
- Ease of Use: Excel offers a basic set of charts and graphs (e.g., bar charts, line graphs, pie charts), which are easy to create but lack advanced interactivity. Tableau, however, provides an intuitive drag-and-drop interface that allows users to create complex visualizations with minimal effort.
- Interactive Dashboards: Tableau shines in creating interactive dashboards that allow users to explore data dynamically by filtering or drilling down on specific elements. Excel, while offering basic interactivity through slicers and pivot tables, does not match Tableau’s level of interactivity, which aligns with the principles taught in the Science of Data Visualization.
- Data Integration: Tableau excels in connecting to a wide range of data sources, including live data connections from databases, cloud services, and spreadsheets. Excel, on the other hand, is limited to importing data from files or manual entry, making it less flexible for real-time data integration.
Data visualization is crucial in transforming complex data into understandable insights. Both Tableau and Excel provide powerful data visualization capabilities, but they differ in terms of functionality, scalability, and flexibility. Here’s a comparison of their visualization strengths:
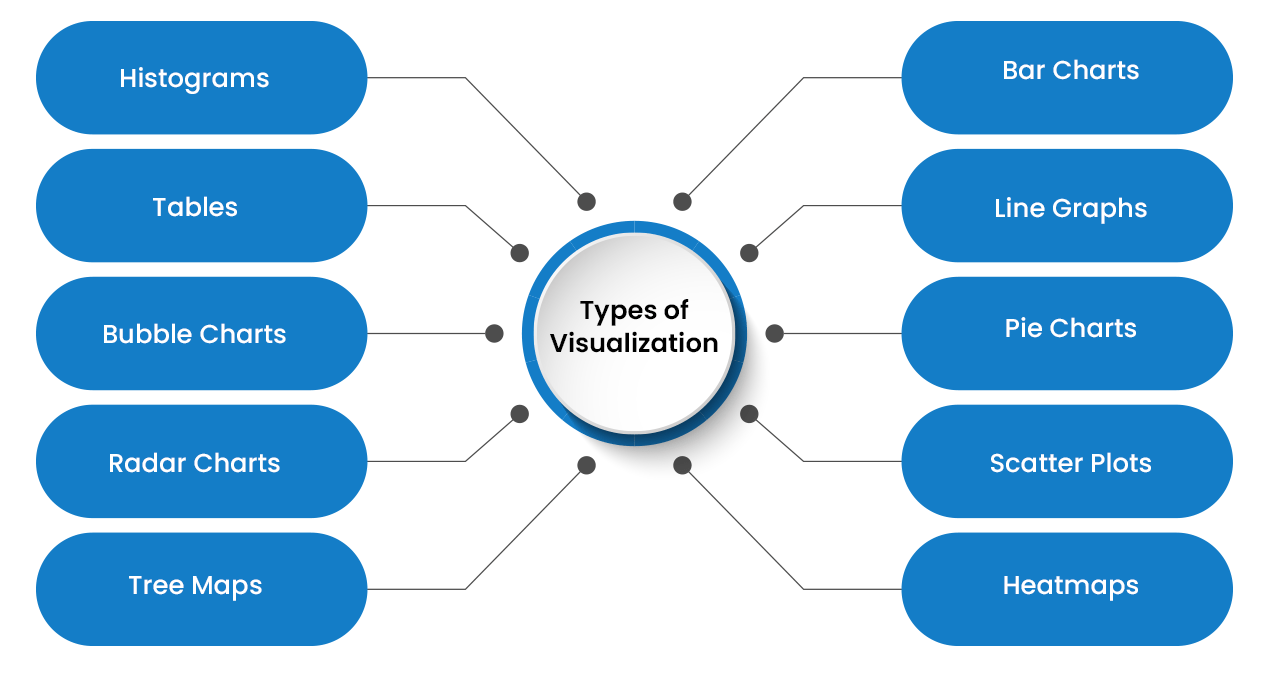
- Customization and Advanced Visuals: Tableau supports a broader range of advanced visualizations (e.g., heat maps, geographic maps, waterfall charts) with high customization options. Excel provides basic customization but lacks the variety of visuals that Tableau can offer.
- Scalability: Tableau is designed to handle large datasets efficiently, providing fast, responsive visualizations even with millions of data points. Excel can struggle with large datasets and may slow down when managing extensive data, making Tableau a better option for big data analysis.
- Collaboration and Sharing: Tableau offers robust features for collaboration, allowing users to share interactive dashboards online or through Tableau Server. While Excel allows sharing via file formats, it lacks the interactive features necessary for real-time collaboration.
Data Handling and Processing
Data handling and processing are essential steps in any data analysis workflow, ensuring that raw data is transformed into meaningful insights. Excel is widely used for handling and processing smaller datasets, with features like sorting, filtering, and using pivot tables to organize and summarize data. It allows users to apply formulas and functions to clean and manipulate data quickly, making it ideal for straightforward analysis. However, Excel’s capacity to handle large datasets is limited, and performance can degrade with complex processing tasks or massive volumes of data. On the other hand, Tableau is designed to manage larger datasets efficiently, with robust data handling capabilities that enable users to work with millions of rows of data without compromising performance. It allows seamless integration from various sources, including databases, cloud platforms, and live data feeds, making it a better choice for dynamic and real-time data processing in Business Intelligence Architecture solutions. Tableau’s data prep features, such as Tableau Prep, provide additional tools for cleaning, transforming, and reshaping data before analysis. While Excel relies heavily on manual data manipulation, Tableau automates many of these processes, reducing the chance for errors and providing more scalability for complex analytical tasks. Both tools complement each other, with Excel being great for quick, smaller-scale data handling, and Tableau excelling in more sophisticated data processing and visualization.
To Explore Business Analyst in Depth, Check Out Our Comprehensive Business Analyst Training To Gain Insights From Our Experts!
User Interface and Usability
- Ease of Learning: Excel’s interface is familiar to many users, especially those with experience using Microsoft Office products. Its spreadsheet-based design is intuitive, making it easy for beginners to get started. Tableau, on the other hand, has a steeper learning curve due to its more complex features, though it provides a user-friendly drag-and-drop interface once the basics are understood.
- Workspace Design: Excel’s workspace consists of rows and columns, and users work directly in cells to input, manipulate, and organize data. Tableau’s workspace is more visually oriented, allowing users to drag fields into a canvas to create charts, dashboards, and other visual elements, which can be more intuitive for users focused on data visualization. Understanding tools like How to Convert JSON to Excel can further enhance data preparation before importing into either platform.
- Customization Options: Tableau offers a high degree of customization in terms of both visualizations and dashboards. Users can modify almost every aspect of the presentation layer. Excel’s customization is more limited, though it provides several formatting and charting options for data presentation.
The user interface (UI) and usability of a tool play a crucial role in determining how effectively users can navigate and utilize its features. Excel and Tableau each offer distinct interfaces that cater to different needs, making their usability highly dependent on the user’s experience and requirements. Here’s a comparison of the two tools in terms of UI and usability:
- Real-Time Interactivity: Tableau’s interface is designed for interactivity, allowing users to filter, drill down, and interact with the data dynamically. Excel provides interactivity through basic features like pivot tables and slicers but lacks the fluid, real-time experience Tableau offers.
- Tool Accessibility: Excel’s tools are embedded directly within the ribbon interface, and users can easily access a wide range of functions and features. Tableau organizes its tools into well-defined menus, but it also offers context-sensitive options that adapt based on the user’s actions, streamlining the process of data visualization and analysis.
- Help and Support: Excel’s vast user base and extensive documentation make troubleshooting and learning easy, with numerous online forums and resources. Tableau also offers extensive support and a comprehensive knowledge base, with a more specialized focus on advanced data visualization, providing in-depth resources for users who need help mastering complex features.
- Real-Time Collaboration: Tableau offers real-time collaboration through Tableau Server and Tableau Online, enabling multiple users to access and interact with dashboards simultaneously. In contrast, Excel’s real-time collaboration is limited, but it has improved with cloud-based solutions like Excel for Office 365, which allows for simultaneous editing.
- Sharing Dashboards and Reports: Tableau excels in sharing interactive dashboards and reports via Tableau Online or Tableau Server, which allows recipients to explore the data themselves. Excel, while sharing workbooks via OneDrive or SharePoint, often results in static versions of the reports unless the users manually update or refresh the data.
- Access Control: Tableau provides granular access control, allowing administrators to manage who can view or edit dashboards and datasets. Excel offers some access controls via file permissions, but managing detailed permissions and security is more challenging in Excel compared to Tableau, especially when implementing Data Analytics Solutions for Strategic Growth.
- Commenting and Annotations: Tableau allows users to add comments, annotations, and feedback directly on dashboards, which is beneficial for collaboration and review. Excel also supports comments, but the feedback process is less integrated, requiring users to add comments to cells or use external communication methods.
- Version Control: Tableau includes version control features when used with Tableau Server, allowing users to track changes and revert to previous versions. Excel’s version control is available through OneDrive or SharePoint, but it’s not as seamless or integrated as Tableau’s.
- Exporting and Sharing Options: Tableau provides multiple export options, including exporting visualizations to PDF, images, or PowerPoint, ensuring easy sharing with stakeholders. Excel allows exporting to formats like PDF and CSV, but its interactive capabilities are lost in the process, limiting its flexibility compared to Tableau’s richer export options.

Integration with Other Tools and Data Sources
Integration with other tools and data sources is a crucial factor in data analysis, as it ensures seamless workflows and enables users to access and analyze data from various platforms. Excel offers basic integration capabilities, allowing users to import data from external sources like text files, CSVs, and databases through connectors such as ODBC and Power Query. It can also link to Microsoft tools like Access, Power BI, and SharePoint, making it versatile for those working within the Microsoft ecosystem, especially in Business Analyst Training programs. However, Excel’s integration is limited when dealing with complex, real-time data connections or large datasets. Tableau, on the other hand, excels in this area, offering robust integration with a wide range of data sources, including databases (e.g., MySQL, SQL Server, Oracle), cloud platforms (e.g., Google BigQuery, Amazon Redshift), and even web-based APIs. Tableau allows for live data connections, enabling real-time updates and dynamic analysis. Additionally, Tableau’s ability to blend data from multiple sources into a single visualization is one of its standout features, making it ideal for users who need to combine disparate data points into cohesive insights. Overall, while Excel works well for static data or smaller datasets, Tableau’s advanced integration capabilities are better suited for handling complex and dynamic data environments.
Advanced Analytics and Business Intelligence
Advanced analytics and business intelligence (BI) are essential for organizations to make data-driven decisions and uncover valuable insights. Excel, while primarily a spreadsheet tool, offers some advanced analytics features through its array of formulas, pivot tables, and data analysis add-ins like Power Pivot and Power Query. Users can perform basic statistical analysis, trend forecasting, and create simple models using built-in functions. However, Excel’s analytical capabilities can be limited when dealing with large datasets or more sophisticated BI needs. Tableau, on the other hand, is specifically designed for advanced analytics and BI. It allows users to perform in-depth data analysis through interactive visualizations, predictive analytics, and trend forecasting, aligning with how spotfire explained benefits business by enabling smarter, data-driven decisions. Tableau’s integration with R and Python also enables users to leverage advanced statistical models and machine learning algorithms directly within the platform. The ability to create complex dashboards, blend data from multiple sources, and perform real-time data analysis makes Tableau an excellent tool for business intelligence. Additionally, Tableau offers features like data clustering, forecasting, and correlation analysis, which can help businesses identify patterns, trends, and outliers within their data. Overall, while Excel can support basic analytics, Tableau is a more powerful and flexible tool for advanced analytics and comprehensive business intelligence, making it the go-to choice for data-driven decision-making in complex environments.
Preparing for Business Analyst Job? Have a Look at Our Blog on Business Analyst Interview Questions and Answers To Ace Your Interview!
Collaboration and Sharing Features
Collaboration and sharing features are vital for teams working together on data analysis projects. Both Excel and Tableau provide ways for users to share and collaborate on data, but each tool offers different capabilities and options.
Performance and Scalability
Performance and scalability are critical factors when choosing data analysis tools, particularly for handling large datasets and ensuring efficient processing. Excel is widely known for its ease of use, but its performance can degrade as the volume of data grows. When working with large datasets or complex calculations, Excel can become slow, with file sizes increasing significantly, making it challenging to manage and process data effectively. It’s best suited for smaller to medium-sized datasets and tasks requiring basic data manipulation. Tableau, on the other hand, is specifically designed for high performance and scalability. It can handle millions of rows of data without significant lag, thanks to its optimized in-memory technology and ability to connect directly to large data sources, which is a key skill covered in Business Analyst Training. Tableau’s data engine allows for fast and efficient processing, making it ideal for real-time analytics and complex data visualizations. It also supports incremental data refreshes, reducing the load and improving performance when working with continuously updated datasets. Additionally, Tableau’s ability to scale with cloud infrastructure, such as Tableau Online or Tableau Server, means that organizations can scale their usage to accommodate growing data needs without compromising speed or performance. Overall, while Excel is effective for smaller tasks, Tableau is far superior for large-scale, high-performance data analytics.