Last updated on 06th Jun 2025| 10827
- Introduction to Power BI and Excel
- Data Visualization and Reporting
- Data Modeling and Transformation
- Real-Time Data Analysis Capabilities
- Collaboration and Sharing Options
- Integration with Other Microsoft Services
- Customization and Extensibility
- Performance with Large Datasets
Introduction to Power BI and Excel
Power BI and Excel are powerful tools developed by Microsoft for data analysis, visualization, and business intelligence, each serving unique yet complementary purposes. Excel, a longstanding staple in data management, is widely used for spreadsheets, calculations, pivot tables, and simple dashboards. It provides robust tools like Power Query and Power Pivot for advanced data manipulation and modeling. Power BI, on the other hand, is a more recent and dynamic platform for Business Analyst Training, designed specifically for transforming raw data into interactive visual insights and real-time dashboards. It enables users to connect to various data sources, create complex data models, and share insights seamlessly across organizations via the cloud. While Excel excels in individual data analysis and reporting tasks, Power BI is better suited for scalable, collaborative data visualization and story-telling. Both tools use DAX (Data Analysis Expressions) for custom calculations and support Power Query for data transformation, fostering a smooth learning curve for users transitioning between them. Together, Excel and Power BI empower users to unlock the full potential of their data Excel offers familiarity and flexibility and Power BI delivers powerful, enterprise-level data analytics capabilities. Understanding both tools is essential for anyone aiming to drive informed decision-making in today’s data-driven business environment.
Are You Interested in Learning More About Business Analyst? Sign Up For Our Business Analyst Training Today!
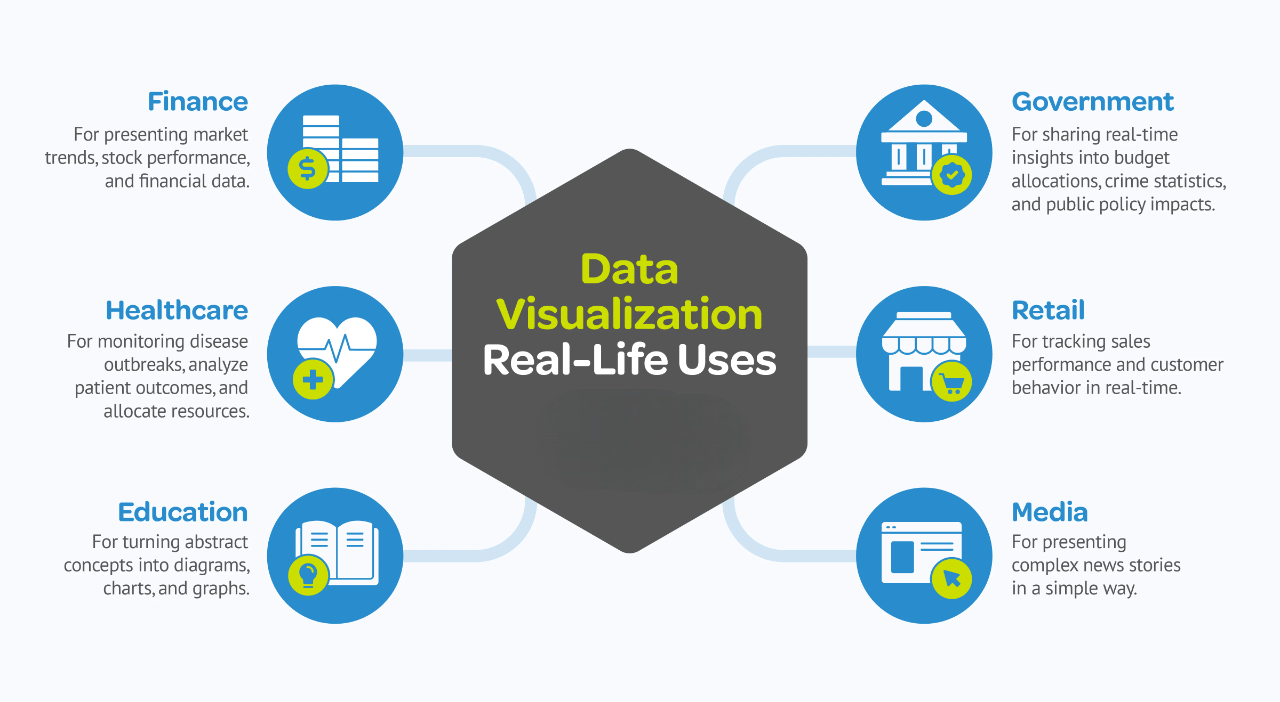
Data Visualization and Reporting
- Clarity and Simplicity: Visuals make data easier to understand by summarizing large datasets into clear, concise formats that highlight key insights.
- Interactive Dashboards: Tools like Power BI allow users to create interactive dashboards that let viewers filter, drill down, and explore data in real time, making it a key component of Business Intelligence Architecture solutions for effective data visualization and analysis.
- Real-Time Reporting: With live data connections, reports can reflect real-time updates, ensuring that decisions are made based on the most current information.
Data Visualization and Reporting are essential components of modern data analysis, helping organizations make sense of complex information quickly and effectively. They involve presenting data in graphical or visual formats such as charts, graphs, and dashboards to uncover patterns, trends, and insights. These techniques not only simplify data interpretation but also enhance communication and decision-making across all levels of an organization.
- Customization and Branding: Visualizations can be tailored to match organizational branding and reporting requirements, creating a consistent and professional look.
- Comparative Analysis: Charts and graphs help compare metrics over time, across departments, or between products, enabling deeper performance evaluation.
- Data Storytelling: Good visualizations guide the audience through a narrative, making complex data relatable and actionable for stakeholders.
Data Modeling and Transformation
Data modeling and transformation are foundational steps in the data analysis process, enabling users to organize, clean, and shape raw data into meaningful structures for accurate and efficient reporting. Data modeling involves designing the relationships between different data sources and defining how data elements interact within a system. This includes creating tables, setting up relationships, defining calculated columns, and building measures using languages like DAX (Data Analysis Expressions). A well-structured data model ensures consistency, reduces redundancy, and enhances performance across reports and dashboards. Data transformation, often done through Power Query in tools like Excel and Power BI, focuses on cleaning and preparing data before it is loaded into the model, making it an essential skill and explore our How to Become a Master Excel Guide for efficient data manipulation and analysis. This includes removing duplicates, filtering rows, splitting columns, and merging datasets from multiple sources. Transformation makes raw data analysis-ready and aligns it with business requirements. Together, data modeling and transformation create a solid foundation for any analytics solution, enabling users to draw accurate insights and build reliable visualizations. Mastering these skills ensures data integrity, improves report responsiveness, and allows for more advanced analytical capabilities. As businesses increasingly rely on data-driven decisions, understanding how to model and transform data effectively becomes a critical skill for analysts and decision-makers alike.
To Explore Business Analyst in Depth, Check Out Our Comprehensive Business Analyst Training To Gain Insights From Our Experts!
Real-Time Data Analysis Capabilities
- Instant Decision-Making: Enables immediate insights and reactions, reducing delays in critical business decisions.
- Enhanced Operational Efficiency: Continuously monitors systems and processes to detect inefficiencies or anomalies as they occur.
- Improved Customer Experience: Provides personalized, timely responses based on live data, enhancing user satisfaction and engagement, which is one of the Smart Ways to Learn how to leverage real-time information for improved decision-making.
In today’s fast-paced digital environment, the ability to analyze data as it’s generated provides organizations with a significant competitive edge. Real-time data analysis empowers businesses to make informed decisions instantly, respond to market changes swiftly, and optimize operations continuously.
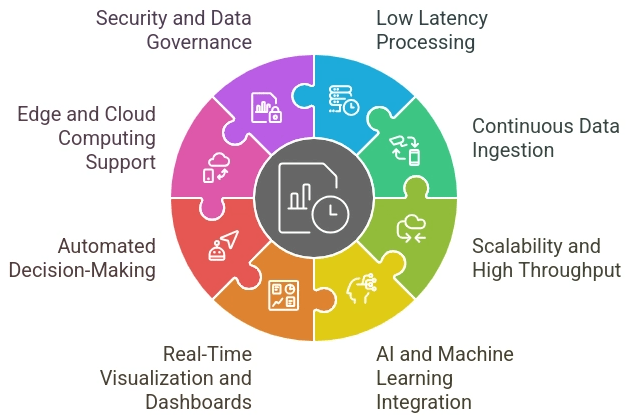
- Proactive Issue Resolution: Identifies and addresses problems before they escalate, minimizing downtime and service disruption.
- Data-Driven Automation: Supports intelligent automation by triggering real-time actions based on dynamic data inputs.
- Competitive Advantage: Offers faster market adaptation and trend responsiveness, helping businesses stay ahead of competitors.
- Seamless Office 365 Compatibility: Easily connects with Word, Excel, PowerPoint, and Outlook, allowing data to flow smoothly between apps for reporting, documentation, and communication.
- Power Platform Integration: Works effortlessly with Power BI, Power Apps, and Power Automate to build dashboards, custom applications, and automated workflows using shared data sources.
- Microsoft Teams Collaboration: Embeds analytics, files, and task updates directly within Teams, supporting real-time discussions and coordinated actions without switching platforms, making it a powerful feature of Business Intelligence Architecture solutions for seamless collaboration and data-driven decision-making.
- Azure Cloud Connectivity: Integrates with Azure services for enhanced scalability, data storage, machine learning, and secure identity management.
- SharePoint and OneDrive Access: Enables centralized document management and file sharing through SharePoint and OneDrive, ensuring version control and easy access across teams.
- Active Directory Integration: Uses Microsoft Active Directory for streamlined user authentication, role-based access control, and enhanced data security across all connected services.

Collaboration and Sharing Options
Effective collaboration and seamless data sharing are essential features of any modern analytical or productivity platform. With robust collaboration and sharing options, teams can work together in real time regardless of location, breaking down silos and enhancing productivity. These tools typically allow multiple users to access, view, and edit documents or dashboards simultaneously, with changes reflected instantly across all devices. Permission-based access control ensures that sensitive information is protected, allowing administrators to define who can view, comment on, or edit content, making it an essential concept in Business Analyst Training for managing data security and access within organizations. Integration with communication tools like email, chat platforms, and video conferencing enables users to discuss insights and updates directly within the workflow. Additionally, sharing options often include the ability to export data in various formats or generate secure, shareable links for external stakeholders. Some platforms also support version control, enabling users to track changes, revert to previous versions, and maintain a clear audit trail. Whether it’s through cloud-based solutions or internal networks, efficient collaboration and sharing features significantly streamline team efforts, improve transparency, and accelerate decision-making. In fast-paced environments, these capabilities foster alignment across departments and empower teams to collectively act on data-driven insights without delay.
Integration with Other Microsoft Services
One of the major strengths of Microsoft’s ecosystem is the seamless integration between its various tools and platforms. Leveraging this interoperability enhances productivity, improves collaboration, and creates a more unified user experience across departments and workflows.
Preparing for Business Analyst Job? Have a Look at Our Blog on Business Analyst Interview Questions and Answers To Ace Your Interview!
Customization and Extensibility
Customization and extensibility are key features that empower organizations to tailor software solutions to meet their unique business needs. A platform with strong customization capabilities allows users to modify interfaces, workflows, and features to align with specific processes, branding, or user preferences. This includes configurable dashboards, user-defined fields, personalized reports, and adaptable UI elements. Extensibility takes this a step further by enabling integration with external tools, APIs, and third-party applications, allowing businesses to expand functionality beyond the out-of-the-box features, making it a key aspect of Big Data Visualization Tools for enhanced data exploration and analysis. Developers can build custom plugins, extensions, or connectors that integrate seamlessly into existing systems, ensuring the platform evolves alongside business requirements. Support for scripting languages, SDKs, and developer frameworks also enables the creation of complex logic and automation tailored to niche use cases. Moreover, many platforms offer marketplaces or app stores where users can access prebuilt integrations and templates, further speeding up deployment and innovation. With customization and extensibility, businesses gain flexibility, avoid one-size-fits-all limitations, and create a more efficient and personalized user experience. This adaptability not only improves productivity but also ensures long-term value and scalability as the organization grows and changes over time.
Performance with Large Datasets
Handling large datasets efficiently is critical for any data-driven platform, especially as organizations increasingly rely on big data to gain insights and drive decision-making. High-performance systems are designed to process, query, and visualize millions or even billions of records without significant delays. This is achieved through optimized data storage structures, in-memory computing, parallel processing, and intelligent caching mechanisms. Advanced indexing and data compression techniques also play a vital role in minimizing load times and ensuring smooth interaction with complex datasets. Moreover, platforms that support incremental data loading and dynamic querying help users analyze data in real time without having to reload entire datasets. Scalability is another crucial factor, allowing the system to maintain high performance as data volume grows, whether on-premises or in the cloud. Checkout and Enroll our Business Analyst Training Integration with high-performance databases, data warehouses like Azure Synapse or SQL Server, and big data platforms such as Hadoop or Spark further enhances the ability to manage and analyze massive datasets. User experience remains a priority, with responsive dashboards and visualizations that remain interactive and intuitive, even with large volumes of data. Ultimately, robust performance with large datasets ensures that users can trust the system to deliver fast, reliable insights at scale crucial for timely and informed decision-making.