
Last updated on 08th Jul 2025| 10298
- Introduction to Business Analytics
- Evolution and Scope of Analytics
- Types of Business Analytics
- Key Tools and Technologies
- Data Collection and Cleaning
- Exploratory Data Analysis
- Predictive Modeling Techniques
- Visualization and Dashboarding
Introduction to Business Analytics
Business analytics is the practice of using data, statistical analysis, and quantitative methods to identify trends, predict future outcomes, and support informed decision-making within organizations. It serves as a critical bridge between raw data and strategic business action, enabling companies to enhance performance, optimize internal processes, and drive innovation. Unlike traditional business intelligence, which primarily focuses on descriptive analysis, summarizing what has already happened, business analytics goes further by providing diagnostic, predictive, and prescriptive insights. Diagnostic analytics helps explain why certain events occurred, predictive analytics forecasts what might happen next, and prescriptive analytics recommends the best course of action to achieve desired outcomes. The scope of business analytics is broad and vital across multiple industries, making Business Analyst Training essential. In retail, it is used for customer segmentation, helping businesses tailor marketing strategies to different customer groups. In finance, business analytics supports fraud detection and risk management, improving security and regulatory compliance. The healthcare sector leverages analytics to optimize patient care, resource allocation, and treatment outcomes. Manufacturing companies use business analytics to streamline supply chains, reduce downtime, and increase operational efficiency. Other applications include personalized marketing campaigns that boost customer engagement and financial forecasting that aids budgeting and investment decisions. By combining advanced statistical techniques with business knowledge, business analytics empowers organizations to move beyond intuition and gut feeling. It provides a data-driven foundation for strategic planning, allowing businesses to respond proactively to market changes and competitive pressures. As technology advances and data volumes grow, business analytics continues to be an indispensable tool for companies seeking to gain a competitive edge and foster sustainable growth.
Do You Want to Learn More About Business Analyst? Get Info From Our Business Analyst Training Today!
Evolution and Scope of Analytics
The field of business analytics has evolved significantly over the past several decades, reflecting advancements in technology and growing organizational needs. In the early days before the 2000s, the focus was primarily on reporting and descriptive analytics. During this period, businesses relied on simple spreadsheet tools and basic reporting software to summarize past performance. As data volumes grew, the business intelligence era emerged. This phase introduced data warehouses, ETL processes, which stand for extract, transform, load, and interactive dashboards designed to monitor key performance indicators and support decision-making at various levels of the organization. With continued technological progress, the advanced analytics era arrived, bringing What Are The Benefits of Measurement & Constrained Optimization Methods. This period saw the rise of data mining, machine learning, and predictive modeling, enabling organizations to forecast trends and uncover hidden patterns within large data sets. These techniques provided deeper insights beyond what traditional reporting could offer. Today, business analytics operates in what is often called the big data and artificial intelligence era. The explosion of unstructured data from social media, Internet of Things devices, and mobile applications has challenged organizations to handle diverse and massive data sources. The integration of AI and deep learning methods now allows for more complex and automated decision-making. Currently, business analytics covers a wide range of activities.
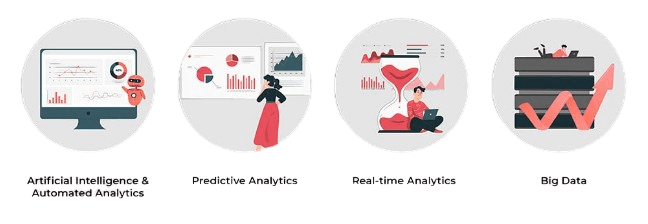
These include data management and governance to ensure data quality and compliance, statistical and mathematical modeling for analysis, machine learning and AI applications for advanced insights, real-time analytics and streaming data for immediate responses, cloud-based analytics platforms for scalable computing, and the integration of domain knowledge with analytical techniques. This expanding scope provides organizations with the opportunity to leverage data not only for everyday tactical decisions but also for long-term strategic transformation.
Types of Business Analytics
- Descriptive Analytics: Answers “What happened?” by summarizing historical data using reports, dashboards, and tools like SQL, Excel, and Power BI (e.g., sales trends).
- Diagnostic Analytics: Answers “Why did it happen?” by exploring data relationships with techniques like drill-down analysis, correlations, and data mining (e.g., reasons for increased customer churn).
- Predictive Analytics: Answers “What might happen?” using statistical models and machine learning such as regression and forecasting to predict future outcomes (e.g., forecasting next month’s sales).
- Prescriptive Analytics: Answers “What should we do?” by providing recommendations through optimization, simulation, and decision analysis methods like linear programming (e.g., optimizing inventory levels).
- Increasing Value and Complexity: Each type adds more value and complexity, moving from basic insights to actionable recommendations, similar to concepts in What Is Time Management In SAP HR.
- Adoption Depends on Maturity: Organizations adopt one or more types depending on their data maturity and business needs.
- Strategic Impact: These analytics help organizations understand data better, make informed decisions, and enhance operational efficiency.
- Data Storage and Management: Structured data is stored using databases like SQL Server, Oracle, and MySQL. For integrated historical data, organizations use data warehouses such as Amazon Redshift, Snowflake, and Google BigQuery.
- Data Integration and ETL: ETL tools such as Informatica, Talend, and Microsoft SSIS automate the process of extracting data from sources and transforming it for analysis.
- Analytics and Statistical Tools: Programming languages like Python and R are widely used for data manipulation, modeling, and advanced analysis, which are key components of Business Analyst Training.
- Visualization and Dashboarding: Popular visualization tools include Tableau, Power BI, and QlikView, which create interactive dashboards and reports.
- Machine Learning and AI Platforms: Frameworks like TensorFlow, PyTorch, and Scikit-learn are essential for building machine learning models. Cloud-based AI services, including AWS SageMaker, Azure ML, facilitate model deployment and management.
- Collaboration and Workflow Tools: Interactive notebooks such as Jupyter and Zeppelin combine code, visualizations, and documentation in one environment.
- Integrated Ecosystem: These tools collectively support the end-to-end business analytics lifecycle, from data storage and integration to analysis, visualization, and deployment, enabling data-driven decision-making across organizations.
- Purpose of EDA: Exploratory Data Analysis is performed before modeling to understand the data’s core characteristics, enabling analysts to uncover insights and guide further analysis.
- Summary Statistics: Calculating key metrics like mean, median, and variance provides an overview of data distribution, central tendency, and variability, helping identify basic patterns.
- Data Distribution Analysis: Histograms and box plots visually display how data points are spread, highlighting skewness, outliers, and the overall shape of the distribution, which are analytical skills reinforced by the Reasons to Get a Six Sigma Certification.
- Relationship Exploration: Scatter plots and correlation matrices reveal relationships and dependencies between variables, essential for selecting features and building predictive models.
- Segmentation and Group Comparisons: Analyzing data by different groups or segments uncovers variations within subsets, such as differences in customer behavior or product performance.
- Data Visualization: Using charts and graphs, analysts visually detect trends, anomalies, and patterns that may not be apparent in raw data, improving understanding and communication.
- Benefits of EDA: Through EDA, analysts identify data quality issues like missing values or inconsistencies, detect patterns, and refine hypotheses, which together improve the accuracy and relevance of subsequent modeling efforts.
Would You Like to Know More About Business Analyst? Sign Up For Our Business Analyst Training Now!
Key Tools and Technologies

Develop Your Skills with Business Analyst Online Training
Weekday / Weekend BatchesSee Batch DetailsData Collection and Cleaning
Accurate and relevant data is the foundation of effective business analytics. The data collection process involves gathering raw information from a variety of sources, both internal and external. Internal systems such as ERP platforms, CRM tools, and sales databases provide structured data related to operations, customer interactions, and revenue. External data sources include social media platforms, market research reports, and publicly available government databases. Additionally, the rise of IoT devices and sensors has contributed to an influx of real-time, unstructured data across industries. Despite the abundance of data, real-world datasets are often messy, incomplete, or inconsistent. This makes data cleaning a crucial step before any analysis can take place. Without proper cleaning, analytical results can be misleading or entirely inaccurate, affecting processes related to What is Strategic Enterprise Management & its Components. Data cleaning involves several key tasks aimed at improving the quality and reliability of data. One common task is handling missing values, which may involve removing incomplete records or imputing missing entries using statistical methods. Another important step is removing duplicates to ensure that each record in the dataset is unique and does not distort the results. Correcting errors, such as typos or inconsistent naming conventions, is also necessary to maintain consistency. Normalization helps standardize data formats, such as dates, currencies, or measurement units, across all records. Outlier detection is used to identify data points that deviate significantly from others and may skew the analysis. Popular tools for data cleaning include Python’s pandas library, which offers a wide range of functions for data manipulation, as well as Excel and OpenRefine. Effective data collection and cleaning ensure that business analytics is built on a solid, trustworthy foundation, leading to more accurate insights and better decision-making.
Looking to Master Business Analyst? Discover the Business Analyst Master Program Training Course Available at ACTE Now!
Exploratory Data Analysis
Predictive Modeling Techniques
Predictive analytics is a key component of business analytics, focused on using historical data to forecast future outcomes. It enables organizations to anticipate trends, optimize operations, and make proactive decisions. Several modeling techniques are commonly used, each suited to specific types of data and business problems. Regression analysis is one of the most widely used techniques. Linear regression is applied when predicting continuous outcomes, such as sales or revenue, based on one or more input variables. Logistic regression, on the other hand, is used for binary classification problems, such as determining whether a customer will churn or not. Decision trees and random forests are intuitive models that split data into branches based on the most important features. These models are used for both classification and regression tasks and are known for their interpretability and robustness, aligning with principles found in What is Cost of Quality COQ. Support Vector Machines, or SVM, are especially effective in high-dimensional spaces and are often used in classification problems with complex decision boundaries. Time series forecasting methods, such as ARIMA and exponential smoothing, are used for sequential data where patterns evolve over time. These models are essential in industries like finance and supply chain, where accurate forecasting is critical. Neural networks and deep learning models are used to analyze large volumes of unstructured data, including images, text, and audio. These models are capable of capturing complex patterns but require significant computational power and data. Clustering techniques, such as K-Means and hierarchical clustering, are used for unsupervised learning tasks like customer segmentation. The choice of model depends on factors such as data type, problem complexity, and business goals. Evaluation metrics like accuracy, precision, recall, and root mean square error help validate model performance and ensure reliable outcomes.
Preparing for a Business Analyst Job? Have a Look at Our Blog on Business Analyst Interview Questions and Answers To Ace Your Interview!
Visualization and Dashboarding
Communicating insights effectively is just as important as conducting the analysis itself. Even the most accurate and complex analytics can fall short if the results are not presented in a clear and compelling way. Visualization and dashboards play a vital role in this process by transforming raw data into interactive, real-time views of key business metrics. Well-designed visuals help stakeholders quickly understand trends, identify anomalies, and make informed decisions without needing to dive into the underlying data. To ensure clarity and impact, certain best practices in data visualization should be followed. Choosing the appropriate chart type based on the data being presented is essential. Bar charts, line graphs, pie charts, and scatter plots each serve different purposes and must be selected carefully, a topic covered in Business Analyst Training. Visuals should be kept simple and focused, avoiding unnecessary complexity that may confuse the viewer. Emphasizing trends, comparisons, and outliers helps draw attention to meaningful insights. The effective use of color and annotations can enhance understanding, but overuse should be avoided to maintain readability. Where needed, providing drill-down options allows users to explore more detailed layers of data from a high-level overview. Dashboards bring multiple visualizations together in one interface, offering a consolidated view of performance indicators. Executives often use dashboards to monitor KPIs and track progress toward goals, while analysts use them to explore data more dynamically. Popular tools such as Power BI and Tableau support integration with various data sources and offer powerful interactive features. These tools not only make data accessible but also support data storytelling by enabling users to explore insights visually and intuitively. Clear visual communication bridges the gap between data analysis and business action, ensuring insights lead to meaningful results.