- Introduction to Business Intelligence Tools
- Overview of Power BI
- Tableau: Features and Capabilities
- Qlik Sense: An Alternative Approach
- Looker: Data Exploration and Discovery
- SAP Analytics Cloud: Integration and Analysis
- Google Data Studio: Free BI Solution
- Domo: Cloud-based Business Intelligence
Introduction to Business Intelligence Tools
Business Intelligence (BI) tools are essential for organizations seeking to transform raw data into actionable insights. These tools enable businesses to analyze historical data, track performance, and make data-driven decisions that can enhance operational efficiency and drive growth.BI tools typically include data visualization, reporting, Business Analyst Training, analytics, and dashboards, allowing users to access, interpret, and present information in a meaningful way. With BI tools, businesses can uncover trends, identify opportunities, and address potential issues in real-time, ensuring they remain competitive in a rapidly evolving market. Popular BI tools such as Tableau, Power BI, and QlikView offer a range of features, including interactive dashboards, data blending, and predictive analytics, making it easier for non-technical users to engage with data. These tools also support integration with various data sources like databases, cloud services, and spreadsheets, ensuring seamless access to diverse datasets. By leveraging BI tools, companies can enhance decision-making, improve performance, and optimize business processes across various departments, including marketing, sales, finance, and operations. Ultimately, Business Intelligence tools provide the framework for businesses to unlock the full potential of their data, turning insights into strategic advantages that drive success.
Are You Interested in Learning More About Business Analyst? Sign Up For Our Business Analyst Training Today!
Overview of Power BI
- User-Friendly Interface: Power BI offers an intuitive interface with drag-and-drop functionality, allowing users to easily create interactive reports and dashboards without needing extensive technical knowledge.
- Data Integration: Power BI supports integration with a wide range of data sources, including Excel, SQL Server, cloud-based services, and How To Measure The Effectiveness Of Corporate Training third-party applications, enabling seamless data analysis across platforms.
- Real-Time Analytics: With Power BI, users can access real-time data and perform up-to-the-minute analysis, ensuring that business decisions are based on the most current information.
- Advanced Data Visualizations: Power BI offers a rich set of visualization tools, including charts, graphs, and maps, to present data in a clear, impactful manner that enhances decision-making.
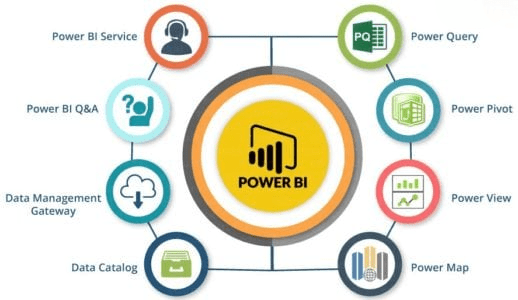
Power BI is a powerful business intelligence tool developed by Microsoft, designed to help organizations analyze and visualize data for better decision-making. It provides interactive dashboards, detailed reports, and robust data analytics capabilities, making it accessible for both technical and non-technical users. Power BI is widely recognized for its user-friendly interface and integration with various data sources, ensuring that businesses can unlock valuable insights quickly and efficiently.
Key Features of Power BI:
- Cloud-Based and On-Premise Access: Power BI can be deployed both in the cloud (Power BI Service) and on-premises (Power BI Report Server), providing flexible options based on an organization’s needs.
- Collaboration and Sharing: Power BI makes it easy to share reports and dashboards with team members, allowing for real-time collaboration and fostering a data-driven culture across the organization.
Tableau: Features and Capabilities
Tableau is a leading data visualization tool known for its powerful features and capabilities that enable users to transform raw data into visually compelling insights. One of its standout features is its intuitive drag-and-drop interface, allowing users to easily create interactive and dynamic visualizations without the need for advanced technical skills. Tableau connects to a wide variety of data sources, including databases, spreadsheets, cloud services, and even big data platforms, enabling seamless integration and analysis across different datasets. Its ability to handle large volumes of data and provide real-time analytics makes it a valuable tool for businesses looking to make informed, data-driven decisions. Tableau offers a wide range of visualizations, such as bar charts, line graphs, scatter plots, maps, and heatmaps, giving users the flexibility to present data in a manner that best suits their needs. Additionally, the tool includes advanced features like calculated fields, How to Create Pivot Table in Excel guide trend lines, and forecasting, allowing for deeper analysis. Tableau’s dashboard functionality also allows users to combine multiple visualizations into a single, interactive view, enabling easier exploration of data. Furthermore, with Tableau’s cloud-based and on-premises deployment options, businesses can access and share insights securely, making it a versatile and comprehensive solution for data visualization and analytics.
To Explore Business Analyst in Depth, Check Out Our Comprehensive Business Analyst Training To Gain Insights From Our Experts!
Qlik Sense: An Alternative Approach
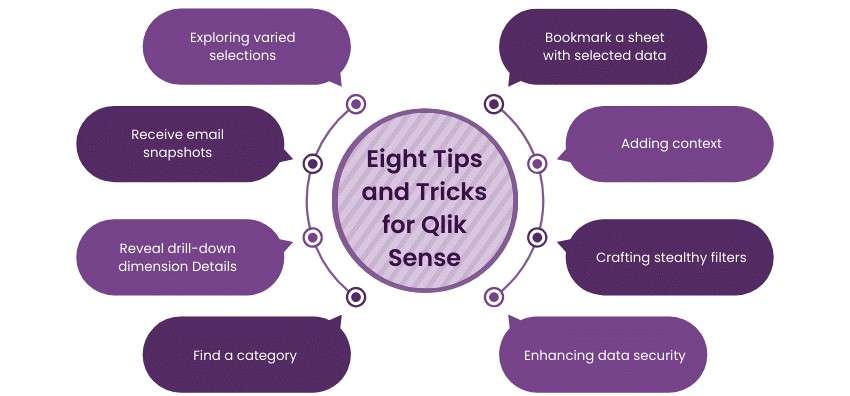
- Associative Data Model: Qlik Sense’s unique associative model enables users to explore data from any angle, uncovering relationships and insights that might be overlooked in traditional query-based systems.
- Self-Service Data Exploration: Qlik Sense empowers users to create their own reports, visualizations, and How to Create Dashboard in Power BI Quickly dashboards without relying on IT, enabling faster decision-making and fostering a data-driven culture.
- Advanced Analytics: The platform supports advanced features like predictive analytics, data modeling, and machine learning integrations, allowing users to perform sophisticated analyses and forecast trends.
Qlik Sense is a modern data analytics platform that offers a unique, associative approach to business intelligence. Unlike traditional BI tools that rely on query-based analysis, Qlik Sense allows users to explore data freely by making associations across multiple data sources. This approach empowers users to uncover insights and patterns that might otherwise remain hidden, providing a more flexible and interactive way to analyze data. With its self-service capabilities, Qlik Sense is designed for both business users and data professionals, making data analytics accessible and efficient for organizations of all sizes.
Key Features of Qlik Sense:
- Data Storytelling: Qlik Sense includes a storytelling feature that enables users to create interactive presentations by combining visualizations and text, making it easier to share insights with stakeholders.
- Cloud and On-Premises Deployment: Qlik Sense offers flexible deployment options, with both cloud-based and on-premises solutions, ensuring that organizations can choose the best fit for their infrastructure and security needs.
- Collaborative Features: With Qlik Sense, teams can collaborate in real time, sharing insights and working together on data exploration, ensuring that all stakeholders are aligned in their decision-making processes.
- Seamless Integration with SAP Systems: SAC integrates effortlessly with various SAP solutions, such as SAP S/4HANA, SAP BW, and SAP Business One, ensuring smooth data flow and consistency across the enterprise ecosystem.
- Advanced Predictive Analytics: The platform includes built-in machine learning and predictive analytics features, allowing users to forecast future trends and make proactive decisions based on data-driven insights.
- Data Visualization and Dashboards: SAP Analytics Cloud provides rich visualization options, including customizable dashboards and Mastering VLOOKUP in Excel interactive charts, which help users easily interpret complex data and track key performance indicators (KPIs).
- Collaborative Planning and Analysis: SAC’s collaborative features enable real-time sharing and discussion of reports, forecasts, and data models, enhancing teamwork and supporting more effective decision-making across departments.
- Cloud-Based Solution: As a cloud-native platform, SAC ensures scalability, flexibility, and secure access to data from anywhere, reducing the need for on-premises infrastructure while providing easy access to real-time analytics.
- Mobile Accessibility: SAC offers mobile compatibility, allowing users to access analytics, reports, and dashboards from smartphones and tablets, making it easier to stay informed and make timely decisions on the go.
Looker: Data Exploration and Discovery
Looker is a powerful business intelligence and data exploration platform that focuses on enabling users to explore, analyze, and visualize data in real-time. It is known for its unique data modeling layer, which allows organizations to define metrics, dimensions, and business logic in a central place, ensuring consistent and accurate reporting across the entire organization. Looker offers an intuitive, web-based interface that enables both technical and non-technical users to perform complex data queries without needing to write SQL code. The platform supports seamless integration with various data sources, including cloud-based databases like Google BigQuery and Amazon Redshift, ensuring that businesses can access and analyze data stored across different systems. One of Looker’s standout features is its ability to provide deep, interactive data exploration, empowering users through Business Analyst Training to drill down into data, explore relationships, and uncover hidden insights. With Looker’s robust dashboard and visualization capabilities, teams can easily share reports and insights across the organization, fostering collaboration and data-driven decision-making. Additionally, Looker supports embedded analytics, enabling businesses to integrate data insights directly into their applications or websites. By providing a scalable and customizable approach to data analysis, Looker helps businesses unlock the full potential of their data, driving more informed, strategic decisions.
Gain Your Master’s Certification in Business Intelligence by Enrolling in Our Business Intelligence Master Program Training Course.
SAP Analytics Cloud: Integration and Analysis
SAP Analytics Cloud (SAC) is a comprehensive analytics platform that combines business intelligence, planning, and predictive analytics in one unified solution. Designed to help organizations make data-driven decisions, SAC enables seamless integration with various SAP and third-party data sources, providing a central hub for data exploration, visualization, and collaboration. With its advanced analytics capabilities, SAC empowers users to gain deep insights, forecast trends, and streamline business processes through a cloud-based solution. Its integration and analytical tools are particularly beneficial for companies looking to align their data with strategic goals, improve decision-making, and optimize performance.
Key Features of SAP Analytics Cloud:Google Data Studio: Free BI Solution
Google Data Studio is a free business intelligence (BI) tool that allows users to create customizable reports and dashboards to visualize and analyze data. This cloud-based platform is designed to help individuals and businesses turn raw data into meaningful insights without the need for expensive software or extensive technical expertise. One of the standout features of Google Data Studio is its integration with various Google services such as Google Analytics, Google Ads, and Google Sheets, as well as third-party data sources, making it a versatile tool for users working with different types of data. Its user-friendly, drag-and-drop interface allows users to easily create interactive reports and dashboards, providing a clear and visually appealing presentation of key metrics. Google Data Studio supports real-time data updates, ensuring that reports reflect the most current information, and How to Convert JSON to Excel which is especially useful for businesses that require up-to-date analytics. Furthermore, the platform offers collaboration features, enabling teams to work together on the same report and share insights with stakeholders seamlessly. As a free solution, Google Data Studio offers tremendous value, providing powerful BI capabilities without the financial burden, making it an excellent choice for small businesses, startups, and organizations looking to leverage data for decision-making.
Preparing for Business Analyst Job? Have a Look at Our Blog on Business Analyst Interview Questions and Answers To Ace Your Interview!
Domo: Cloud-based Business Intelligence
Domo is a cloud-based business intelligence (BI) platform designed to help organizations integrate, analyze, and visualize data from various sources in one central location. With its scalable, cloud-native architecture, Domo allows businesses of all sizes to access real-time data and make informed, data-driven decisions. The platform supports integration with a wide range of data sources, including cloud applications, databases, spreadsheets, and social media, providing a comprehensive view of business performance. Domo’s user-friendly interface features drag-and-drop capabilities, enabling users to create custom dashboards and reports without requiring technical expertise. You can enhance your skills further with Business Analyst Training. The platform is built for collaboration, allowing teams to share insights, track KPIs, and discuss data in real-time, fostering a data-driven culture across the organization. Domo also includes advanced features like predictive analytics, data blending, and machine learning, allowing for deeper analysis and forecasting. Additionally, Domo’s mobile-friendly interface ensures that users can access critical data and insights on the go, making it easier to stay connected and make decisions anytime, anywhere. With its robust integration, real-time analytics, and user-centric design, Domo stands out as a powerful cloud-based BI solution, helping businesses optimize performance, streamline operations, and unlock the full potential of their data.


