- Introduction
- What is Power BI Architecture?
- Key Components of Power BI Architecture
- How Power BI Architecture Works
- Advantages of Power BI Architecture
- Challenges in Power BI Architecture
- Power BI Architecture Best Practices
- Conclusion
Introduction
Power BI is a leading business intelligence (BI) and data visualization tool that enables organizations to turn raw data into meaningful insights. A significant factor behind its success lies in its robust and flexible architecture, which consists of several key components that operate in unison to deliver powerful analytical capabilities. At the core of Power BI is its three-tier architecture: the data layer, the modeling layer, and the visualization layer. The data layer allows users to connect to a wide range of data sources, including cloud-based, on-premises, and streaming data. This is made possible through Power BI’s robust connectors and Power Query engine, which facilitates data extraction, transformation, and loading (ETL) — a core skill emphasized in Business Analyst Training. The modeling layer is where data relationships, measures, and calculated columns are created using DAX (Data Analysis Expressions). This layer is responsible for building the data model that supports analysis and reporting. The visualization layer offers intuitive drag-and-drop features to create interactive dashboards and reports. These can be published to the Power BI Service, where users can share and collaborate in real time. Supporting components like the Power BI Gateway, Power BI Report Server, and Power BI Mobile ensure seamless data refresh, secure on-premises data access, and mobile-friendly experiences. Together, these components make Power BI a comprehensive platform that empowers users to analyze and visualize data effectively, making data-driven decisions easier than ever.
Interested in Obtaining Your Business Analyst Certificate? View The Business Analyst Training Offered By ACTE Right Now!
What is Power BI Architecture?
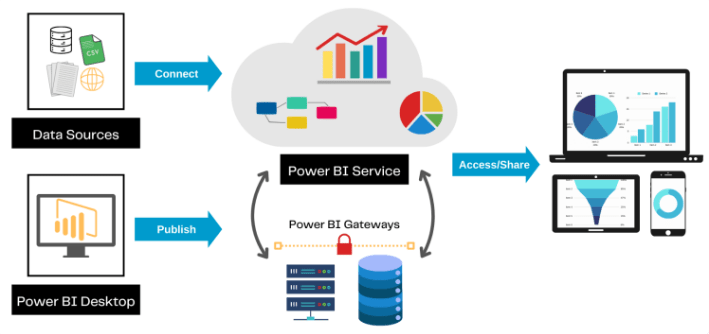
Power BI architecture refers to the structural foundation that supports the entire Power BI ecosystem. It consists of a collection of integrated components and services that work together to enable users to extract, transform, analyze, and visualize data efficiently. Designed for scalability, flexibility, and ease of use, Power BI architecture caters to businesses of all sizes, from small startups to large enterprises. The architecture can be broken down into eight main components, each contributing to a specific part of the Power BI workflow similar to how processes are analyzed in Common Cause Vs Special Cause Variation. The first is Data Sources, which allow Power BI to connect to a wide variety of platforms, including databases, cloud services, Excel files, and APIs. Next is Power Query, which handles the data extraction and transformation process through an intuitive interface and scripting using the M language. The Data Model component, built using Power BI Desktop, enables the creation of relationships, measures, and calculated columns using DAX (Data Analysis Expressions). The Power BI Service provides a cloud-based environment for publishing, sharing, and collaborating on dashboards and reports. To ensure secure and real-time data access, the Power BI Gateway connects on-premises data sources with the cloud service, enabling scheduled refreshes.

For organizations requiring an on-premises solution, the Power BI Report Server offers a secure way to host and manage reports. The Power BI Mobile app allows users to view and interact with reports on the go. Lastly, Embedded Analytics lets developers integrate Power BI visuals into custom applications using APIs and SDKs. Together, these components form a powerful and cohesive architecture that enables organizations to transform raw data into meaningful insights and share them securely across teams.
Key Components of Power BI Architecture
- Power BI Desktop: This is the primary tool where users connect to various data sources, clean and transform data, build data models, and create interactive reports and dashboards. It is a free Windows application that serves as the foundation for report development.
- Power BI Service: A cloud-based platform where reports and dashboards created in Power BI Desktop are published. It allows users to share insights across teams, collaborate in real-time, and schedule data refreshes to keep reports up-to-date.
- Power BI Mobile: Provides mobile applications for iOS and Android devices, enabling users to access reports and dashboards anytime and anywhere. This enhances decision-making by providing insights on the go a feature considered when comparing tools like SAS Vs R.
- Power BI Gateway: Acts as a secure bridge that connects on-premises data sources to the Power BI Service. It facilitates scheduled and live data refreshes without requiring data to be moved permanently to the cloud, ensuring data security and freshness.
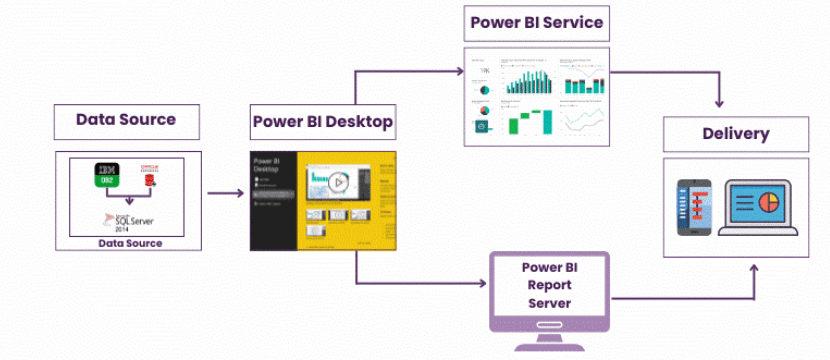
- Power BI Report Server: An on-premises server solution that allows organizations to host, manage, and distribute Power BI reports within their own infrastructure. This is ideal for companies with strict compliance or data governance requirements.
- Power BI Embedded: Enables developers to embed Power BI visuals and reports into custom applications, websites, or portals. This allows businesses to deliver rich analytics experiences within their own software environments.
- Power BI Visuals Marketplace: An online store offering a wide range of custom visuals created by Microsoft and third parties. It allows users to enhance their reports with specialized charts and visualizations tailored to specific needs.
- Data Connection: Power BI connects to various data sources including databases, cloud services, Excel files, and APIs. Users can import data directly or use live connections depending on their needs.
- Data Preparation: Using Power BI Desktop, users clean, transform, and shape the imported data with Power Query. This step, often covered in Business Analyst Training, ensures data quality and consistency before building visualizations.
- Data Modeling: Users create relationships between different data tables, define calculated columns and measures using DAX (Data Analysis Expressions), and design a semantic data model that supports dynamic reporting.
- Report Creation: Interactive reports and dashboards are built in Power BI Desktop using the prepared data model. Visual elements like charts, graphs, and slicers allow users to explore data intuitively.
- Publishing to Power BI Service: Once reports are ready, they are published to the Power BI Service, a cloud platform that enables sharing, collaboration, and centralized report management across the organization.
- Data Refresh and Gateway: For on-premises data sources, the Power BI Gateway securely facilitates data refreshes, ensuring reports in the cloud always reflect the most current data without compromising security.
- Consumption and Interaction: End users access reports via Power BI Service or Power BI Mobile apps. They can interact with dashboards, apply filters, and drill down into data to derive actionable insights on demand.
- Data Volume and Performance: Handling large datasets can lead to slower report loading and refresh times. Optimizing data models and using aggregations are necessary to maintain performance.
- Data Security and Governance: Ensuring secure data access while maintaining compliance with organizational policies can be complex, especially when integrating cloud and on-premises data sources.
- Complex Data Modeling: Building efficient and accurate data models with multiple relationships and calculated measures requires advanced skills and can be time-consuming highlighting one of the Essential Skills Need to Master in Data Analyst.
- Managing Data Refresh: Scheduling and maintaining timely data refreshes, especially from on-premises sources through the Power BI Gateway, can be challenging due to network or gateway issues.
- Version Control and Collaboration: Coordinating report development among multiple team members and managing version history is difficult since Power BI lacks built-in advanced version control.
- Customization Limits: While Power BI offers many visuals, highly customized or niche visualizations may require third-party visuals or embedding, which can add complexity and costs.
- Licensing and Cost Management: Understanding and managing the various Power BI licensing options (Pro, Premium, Embedded) to align with organizational needs while controlling costs is often a challenge.
To Earn Your Business Analyst Certification, Gain Insights From Leading Data Science Experts And Advance Your Career With ACTE’s Business Analyst Training Today!
How Power BI Architecture Works

Advantages of Power BI Architecture
The architecture of Power BI offers several advantages that make it a preferred business intelligence platform for organizations of all sizes. One of the key benefits is its scalability, allowing businesses to start small and expand their data analytics capabilities as needed, without overhauling the existing setup. Its modular and flexible design enables users to connect to a wide range of data sources both on-premises and cloud-based making data integration seamless and efficient. Another significant advantage is real-time data access and automatic refresh, which ensures that decision-makers are always working with the most current information. The use of Power BI Gateway bridges the gap between on-premises systems and the cloud, enabling secure and scheduled data updates an important distinction often discussed in the context of Data Analyst VS Data Scientist roles. Additionally, Power BI architecture supports self-service BI, empowering non-technical users to prepare data, build reports, and gain insights without relying heavily on IT departments. The use of DAX and Power Query further enhances data modeling and transformation capabilities. Power BI’s cloud service and mobile access make it easy to collaborate and access reports from anywhere, at any time. For organizations with strict data governance policies, Power BI offers on-premises options through the Power BI Report Server. Furthermore, the ability to embed analytics into custom applications allows businesses to integrate powerful visuals directly into their platforms. Overall, the robust architecture of Power BI combines performance, security, ease of use, and integration flexibility, making it a comprehensive and adaptable solution for modern business intelligence needs.
Want to Pursue a Business Intelligence Master’s Degree? Enroll For Business Intelligence Master Program Training Course Today!
Challenges in Power BI Architecture
Power BI Architecture Best Practices
Implementing Power BI effectively requires not just understanding its architecture, but also following best practices to ensure optimal performance, scalability, and maintainability. One key best practice is to establish a clear data strategy before building reports this includes identifying reliable data sources, setting data quality standards, and defining access policies. Using star schema models in the data layer is another recommended practice, as it enhances performance and simplifies DAX calculations. It’s important to minimize complex transformations in Power BI by doing heavy data preparation in the source system or using Power Query efficiently to handle ETL operations. Additionally, optimizing the data model by removing unnecessary columns and tables, and using appropriate data types, significantly improves report performance a practice aligned with the principles of What is Six Sigma. Implementing row-level security (RLS) helps enforce access control and ensures that users only see data relevant to them. When working with large datasets, it’s best to leverage aggregations and incremental data refresh to reduce load times and resource usage. Establishing a centralized workspace strategy promotes consistency, version control, and collaboration among teams. Utilizing Power BI Gateway effectively ensures secure and scheduled data refreshes from on-premises systems. It is also advisable to monitor and audit usage through Power BI’s admin tools to manage capacity and identify performance bottlenecks. Finally, encouraging self-service BI responsibly by providing training and governance helps maintain data integrity while empowering business users. By following these best practices, organizations can maximize the value and reliability of their Power BI architecture.
Preparing for a Business Analyst Job Interview? Check Out Our Blog on Business Analyst Interview Questions and Answers
Conclusion
The architecture of Power BI is a well-designed ecosystem that enables businesses to transform raw data into actionable insights effectively. At the heart of this architecture are eight core components that work seamlessly together to provide a scalable, flexible, and secure data analytics solution. Power BI Desktop is where data analysts and developers create robust data models and interactive reports. Once developed, these reports can be published and shared through the Power BI Service, a cloud-based platform that supports collaboration, real-time dashboards, and scheduled data refreshes. For users on the go, Power BI Mobile offers the ability to access reports and dashboards anytime, anywhere, ensuring critical insights are always within reach a feature highlighted in Business Analyst Training. To securely connect on-premises data sources with the cloud, organizations use Power BI Gateway, which facilitates safe and automated data refreshes. For businesses that require on-premises report hosting due to compliance or governance needs, Power BI Report Server provides a reliable solution. Developers looking to embed rich analytics into custom applications can leverage Power BI Embedded, allowing seamless integration of visuals and reports. The Power BI Visuals Marketplace expands customization options by offering a vast library of custom visuals to enhance storytelling. Finally, the Power BI API enables developers to automate and extend Power BI capabilities, integrating it with other systems. Understanding how these components interact helps users, whether analysts, developers, or executives maximize Power BI’s potential, making data-driven decisions more accessible, actionable, and impactful across the organization.


