- Reasons for Exporting Data from Power BI to Excel
- Exporting Data from Visuals
- Exporting Underlying Data vs Summarized Data
- Limitations and Considerations When Exporting
- Using Power BI Service for Data Export
- Automating Data Exports with Power Automate
- Maintaining Data Refresh and Sync Between Power BI and Excel
- Analyzing Exported Data in Excel
Reasons for Exporting Data from Power BI to Excel
Exporting data from Power BI to Excel offers several advantages for users seeking enhanced data analysis and reporting flexibility. Firstly, Excel provides a familiar environment with advanced features such as complex calculations, pivot tables, and customizable charts, which are often easier to use for in-depth data manipulation than Power BI’s native interface. Additionally, exporting allows users to perform offline analysis or share data with others who may not have access to Power BI. Excel’s ability to integrate with other tools and systems, including legacy applications, further boosts its utility. Moreover, exporting data from Power BI can facilitate the creation of detailed reports, financial models, or forecasts that are not easily achievable within Power BI’s dashboard setup a skill often emphasized during Business Analyst Training For team collaboration, Excel files can be shared across organizations, enabling stakeholders to work with the data in their preferred format. Another key reason is the need for users to customize or aggregate data in ways that Power BI may not directly support. Finally, exporting data ensures compatibility with other reporting systems or business processes, making it an essential practice for data teams aiming to enhance accessibility and usability. Overall, exporting data from Power BI to Excel enables greater flexibility, customization, and collaboration for comprehensive decision-making.
Are You Interested in Learning More About Business Analyst? Sign Up For Our Business Analyst Training Today!
Exporting Data from Visuals
- Easy Access to Raw Data: Exporting data from visuals provides users with direct access to the underlying dataset, enabling a deeper dive into specific metrics and data points.
- Offline Analysis: Once the data is exported to Excel or CSV, users can perform offline analysis, making it possible to work without an internet connection or when Power BI is not available a scenario that often arises when users compare Power BI vs Excel for flexibility and offline capabilities.
- Customization Flexibility: Users can modify the exported data to suit their needs, performing additional calculations, filtering, or transformations in Excel or other tools that are not easily accomplished within Power BI.
Exporting data from visuals in Power BI is a powerful feature that allows users to leverage data outside of the platform. By exporting data directly from reports or dashboards, users can perform further analysis, create custom reports, or share insights with stakeholders who may not have access to Power BI.

- Enhanced Sharing Capabilities: Exporting allows users to share specific data insights with colleagues or clients who may not have access to Power BI, ensuring collaboration and communication are seamless.
- Integration with Other Tools: Data exported from visuals can be integrated with other reporting tools, external databases, or systems, improving cross-platform data compatibility.
- Quick Reporting: By exporting data from visuals, users can rapidly generate custom reports and presentations, enhancing decision-making and enabling real-time insight sharing with key stakeholders.
Exporting Underlying Data vs Summarized Data
When exporting data from Power BI, users have the option to export either underlying data or summarized data, each serving different purposes depending on the need. Exporting underlying data refers to pulling the raw, detailed dataset used in a report, including all individual rows and columns of information without aggregation. This is beneficial when users require a granular view of the data for in-depth analysis. performing complex calculations or verifying the accuracy of report details. It allows for a comprehensive examination of the data, including any filters or slicers applied within the report. On the other hand, summarized data exports provide aggregated information, typically showing data in the form of averages, totals, or other summary statistics, which are useful for quick reporting or high-level analysis. Summarized exports are ideal when the goal is to share overall trends, avoid overwhelming stakeholders with excessive details, or present key performance indicators (KPIs) at a glance an approach often considered when evaluating Tableau vs Excel for business intelligence in terms of data visualization and reporting clarity. The choice between the two depends on the user’s objectives, whether they need full data for detailed analysis or summarized data for concise reporting. Understanding the distinction helps users select the most appropriate data export option for their specific business needs and analytical goals.
To Explore Business Analyst in Depth, Check Out Our Comprehensive Business Analyst Training To Gain Insights From Our Experts!
Limitations and Considerations When Exporting
- Row Export Limits: Power BI restricts the number of rows that can be exported, typically up to 150,000 rows for summarized data and 30,000 for underlying data, which may limit access to full datasets.
- Permission Controls: Exporting is governed by user permissions and report settings. If the report creator disables exporting, users won’t be able to download the data a concept that complements foundational topics covered in a Datastage Tutorial for Beginners where data access and control are also key considerations.
- Loss of Formatting: Visual elements such as colors, conditional formatting, and custom tooltips are not preserved during export, which can reduce the clarity of the data.
Exporting data from Power BI is a useful feature, but it comes with certain limitations and considerations that users should keep in mind to ensure accurate and secure data handling. Being aware of these factors helps avoid unexpected issues and supports better decision-making. Here are six key points to consider:

- Unsupported Visuals: Some visuals, especially custom or R/Python visuals, do not support exporting, limiting the ability to extract data from them.
- Data Privacy Risks: Exported files can be shared freely, increasing the risk of exposing sensitive or confidential information if not handled properly.
- Time Zone Differences: Exported date and time values may reflect the server’s time zone instead of the user’s, potentially causing confusion in reports.
- Scheduled Exports: Power Automate can be configured to export data from Power BI at set intervals (daily, weekly, etc.), ensuring timely delivery of reports or datasets.
- Trigger-Based Workflows: Exports can be triggered by specific events, such as data refresh completion, allowing real-time sharing of updated insights.
- Email Integration: Exported files can be automatically sent via email to selected recipients, reducing the need for manual distribution.
- File Storage Automation: Power Automate can save exported data directly to cloud storage platforms like OneDrive, SharePoint, or Azure Blob Storage for centralized access a process that supports principles from the Science of Data Visualization, ensuring data is both accessible and effectively organized for analytical clarity.
- Multi-Step Processes: Flows can include additional steps like renaming files, logging export history, or notifying users, creating comprehensive data delivery pipelines.
- Improved Efficiency: Automating exports reduces repetitive tasks, ensures consistency, and minimizes the risk of human error in manual data handling.
Using Power BI Service for Data Export
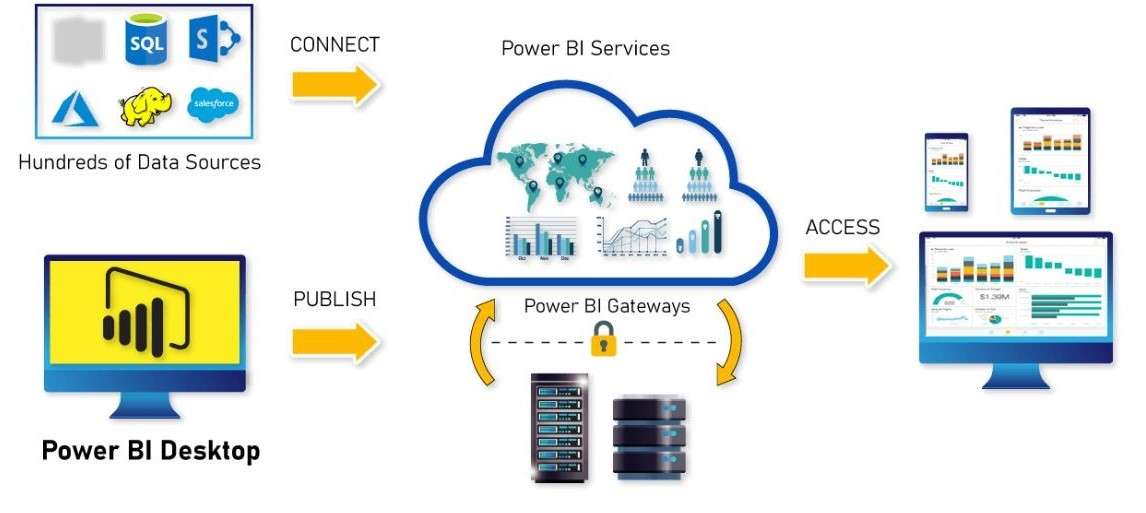
Using the Power BI Service for data export provides a convenient way for users to extract insights from reports and dashboards directly through a web browser, without needing the Power BI Desktop application. This cloud-based platform enables users to export both summarized and, when permitted, underlying data from report visuals to Excel or CSV formats. Exporting via the Power BI Service is especially useful for business users who need quick access to data for offline analysis, presentations, or further processing in Excel. The interface is user-friendly, allowing exports with just a few clicks, provided the report author has enabled the feature a functionality commonly covered in Business Analyst Training. Additionally, Power BI Service respects all applied filters, slicers, and user-level security settings, ensuring that users only export data they are authorized to view. However, some limitations exist, such as row count restrictions, potential formatting loss, and unsupported custom visuals, which users should consider. Exported data can then be used for creating pivot tables, additional calculations, or integrating with other business tools. Overall, the Power BI Service simplifies the data export process and enhances accessibility for users across different roles, promoting greater flexibility and collaboration in data-driven decision-making without requiring advanced technical knowledge.
Automating Data Exports with Power Automate
Automating data exports from Power BI using Power Automate streamlines the process of delivering data to stakeholders without manual intervention. This integration helps schedule regular exports, trigger actions based on specific conditions, and ensures data is always up to date when shared across teams or systems. Here are the key points on using Power Automate for data export:
Preparing for Business Analyst Job? Have a Look at Our Blog on Business Analyst Interview Questions and Answers To Ace Your Interview!
Maintaining Data Refresh and Sync Between Power BI and Excel
Maintaining data refresh and synchronization between Power BI and Excel is essential for ensuring data accuracy and consistency across reporting tools. When data is exported from Power BI to Excel, it becomes a static snapshot unless connected through a live data source or refreshed regularly. To keep Excel files up to date with Power BI datasets, users can leverage features like Analyze in Excel, which allows them to create pivot tables and charts in Excel that are connected directly to the Power BI Service. Additionally, Excel files can be stored in SharePoint or OneDrive, allowing for seamless updates and collaboration among users while ensuring version control a practice that aligns with the workflow of an Informatica ETL developer who often relies on versioned data sources for efficient data integration and transformation. It’s crucial to maintain data model integrity and manage user permissions effectively, as access to updated data depends on Power BI workspace roles and dataset permissions. Additionally, Excel files can be stored in SharePoint or OneDrive, allowing for seamless updates and collaboration among users while ensuring version control. For more advanced synchronization, Power Automate workflows can be configured to notify users or take action when data refreshes occur. Overall, maintaining sync between Power BI and Excel enhances real-time reporting, reduces manual effort, and ensures all users are working with the most current and accurate data.
Analyzing Exported Data in Excel
Analyzing exported data in Excel allows users to dive deeper into Power BI insights using Excel’s robust analytical tools. Once data is exported, whether as summarized data or underlying raw records, Excel provides a flexible environment to perform advanced analysis that may go beyond Power BI’s visual capabilities. Users can leverage pivot tables, charts, conditional formatting, and complex formulas to uncover patterns, trends, and anomalies in the data all of which are key competencies developed through Business Analyst Training Excel also supports data transformation tools like Power Query, enabling further data cleaning, merging, and reshaping as needed. This is particularly useful when combining exported Power BI data with other external data sources for a more comprehensive analysis. Additionally, Excel’s filtering, sorting, and grouping functions make it easy to segment and explore data in ways that suit specific business questions or stakeholder needs. For financial modeling, forecasting, or statistical analysis, Excel remains a preferred tool due to its versatility and familiarity among business users. Furthermore, users can create dashboards within Excel using slicers and charts to present the exported data interactively. Overall, analyzing Power BI-exported data in Excel enhances flexibility, supports detailed decision-making, and enables users to extract maximum value from their business intelligence efforts outside the Power BI environment.


