Last updated on 08th May 2025| 8651
- Introduction to QlikView
- Why Choose QlikView
- Key Features of QlikView
- Understanding QlikView Architecture
- Getting Started with QlikView
- Creating Your First QlikView App
- Advanced Techniques in QlikView
- QlikView Best Practices and Tips
- Conclusion
Excited to Achieve Your Business Analyst Certification? View The Business Analyst Online course Offered By ACTE Right Now!
Introduction to QlikView
QlikView is a powerful Business Intelligence (BI) tool that empowers organizations to analyze their data, generate insights, and make informed decisions. Developed by Qlik, this software enables users to create interactive dashboards, reports, and data visualizations without requiring complex programming skills. Since its launch, QlikView has been widely adopted across various industries from finance and healthcare to retail and manufacturing—and has become a key tool in Business Analyst Training. The main strength of QlikView lies in its associative data model, which allows users to explore their data freely, without being limited by predefined queries or reports. In this guide, we will take you through the essential aspects of QlikView, including its features, architecture, and the basics of getting started. Whether you’re a beginner or someone who wants to get more out of your QlikView experience, this guide will provide valuable insights.
Why Choose QlikView
Before diving into the specifics of using QlikView, it’s important to understand why businesses choose this tool over others. Here are some reasons why QlikView is a popular choice for BI and analytics:
- Associative Data Model Unlike traditional BI tools that rely on queries and predefined reports, QlikView’s associative model allows users to explore their data from multiple angles. By simply clicking on a data point, users can instantly see how it relates to other elements in their dataset, offering a more intuitive and powerful way of analyzing data.
- In-Memory Technology QlikView stores all data in memory, which significantly speeds up the analysis process. With this in-memory processing, QlikView can quickly respond to user queries, even when dealing with large datasets.
- Data Visualization QlikView offers a variety of charts, graphs, and visualization tools that help users understand complex data. The ability to create interactive visualizations ensures that users can explore their data dynamically, making it easier to spot trends and insights.
- Self-Service BI One of the standout features of QlikView is its support for self-service BI. With an easy-to-use interface, even non-technical users can build their dashboards and perform complex data analysis independently, reducing dependency on IT.
- Scalability and Flexibility QlikView can scale to meet the needs of organizations of any size. Whether you’re running a small department or an enterprise-wide deployment, QlikView can accommodate your data and users. Additionally, it can integrate with a wide variety of data sources, from Excel spreadsheets to complex SQL Database.
Key Features of QlikView
QlikView’s dashboards provide users with a real-time, interactive view of their data. Users can click on any element within the dashboard to drill down, filter, and analyze specific parts of the data. QlikView uses a scripting language that allows users to create complex data models. With its powerful scripting engine, users can load data from different sources, clean, and transform it to meet their analytical needs. The associative model in QlikView automatically links data from different sources. This association ensures that users can make comparisons across datasets without needing to manually join tables or create complex queries. QlikView offers robust security controls, allowing users to define who can access specific data and features. You can set up security based on user roles, ensuring that sensitive data is protected. QlikView supports collaboration by allowing users to share reports, charts, and dashboards with others. This is ideal for teams that need to work together to make data-driven decisions.

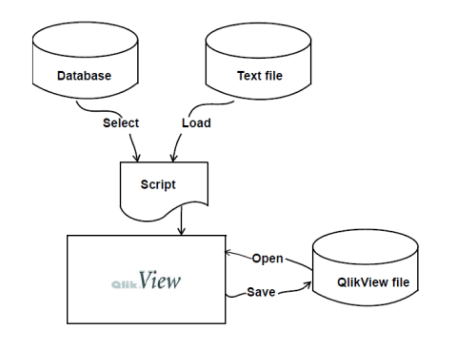
Understanding QlikView Architecture
To fully understand how QlikView works, it’s crucial to have an understanding of its architecture. This is the client-side application where users create and develop QlikView applications. It allows users to load, model, and visualize data, as well as create interactive dashboards. QlikView Server is responsible for hosting QlikView applications and enabling collaboration across teams. It handles tasks like managing user access, scheduling data reloads, and distributing reports. QlikView Publisher complements the server by managing the distribution of QlikView Big Data Applications. It automates the process of data reloads and manages the distribution of files to various users. This web-based interface allows users to access their QlikView applications remotely. It provides a central portal where users can find, open, and interact with their apps. QlikView also supports mobile devices, allowing users to access and interact with their dashboards and reports from smartphones and tablets.
Excited to Obtaining Your Business Analyst Certificate? View The Business Analyst Training Offered By ACTE Right Now!
Getting Started with QlikView
Now that you have an understanding of why QlikView is so powerful and its key features, let’s walk through how to get started with the tool.
- Installation and Setup To get started, you first need to install QlikView on your computer. QlikView offers a free desktop version that can be used for personal or educational purposes. Simply download the installer from the Qlik website and follow the instructions to set it up.
- Connecting to Data Sources Once installed, you can start connecting QlikView to your sources of Data Analysis. QlikView supports a wide range of connectors, including databases (like SQL Server), Excel files, and even cloud services. You’ll use QlikView’s scripting language to load data into the app.
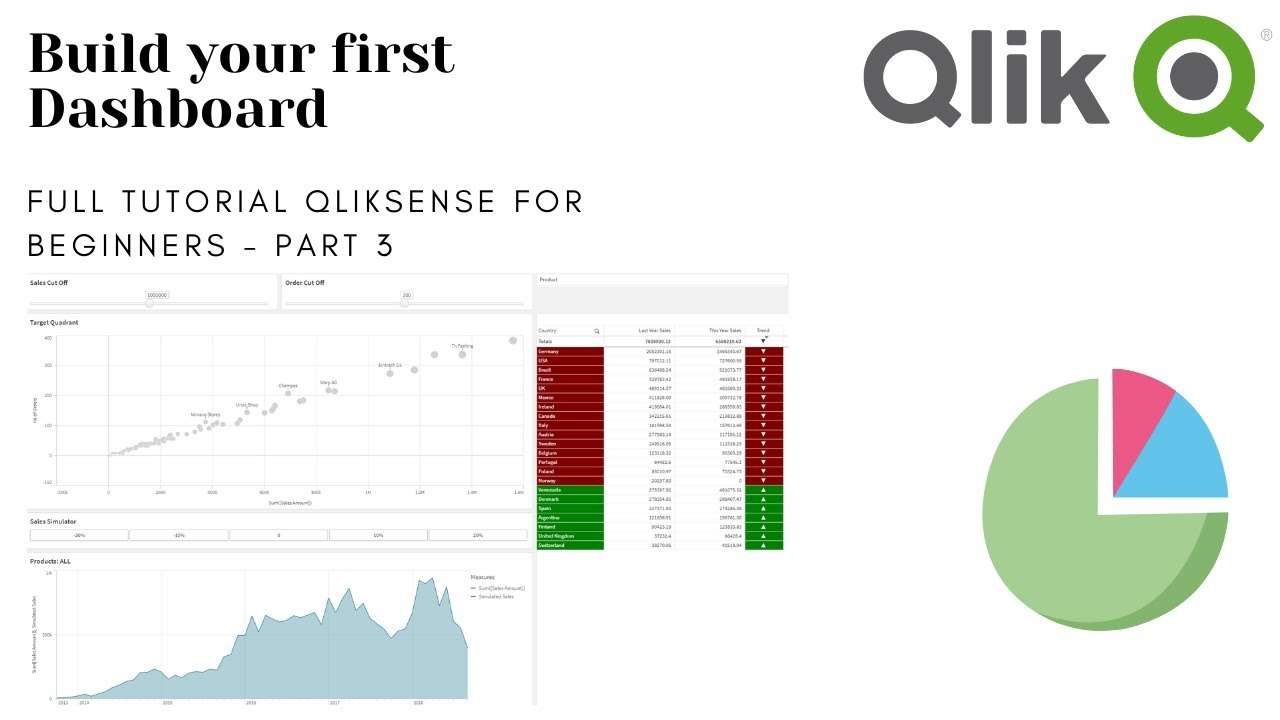
- Creating Your First Dashboard After loading your data, you can start creating visualizations. QlikView offers a drag-and-drop interface that makes it easy to add charts, tables, and other objects to your dashboard. You can also apply filters and set up interactivity to make the dashboard more dynamic.
- Exploring Data Once you have your dashboard set up, you can begin exploring the data. Use the associative model to click on different data points and explore their relationships. This is where QlikView’s true power shines—giving you the ability to easily discover hidden patterns in your data.
Interested in Pursuing Business Intelligence Master’s Program? Enroll For Business Intelligence Master Course Today!
Creating Your First QlikView App
Creating your first QlikView app is straightforward. Begin by loading some sample data—such as a sales dataset containing product names, sales dates, and sales figures into QlikView. Once the data is loaded, you can start building visualizations. Basic charts like bar charts and pie charts can be created to display sales by region or product; simply drag the relevant fields into the workspace to generate these visuals. To enhance user experience, add interactivity through filters. For instance, include options that allow users to select different time periods, regions, or products. As users interact with these filters, the visualizations on the dashboard will automatically update to reflect their selections, making the app dynamic and user-friendly—an ideal feature for Business Analyst Training.
Advanced Techniques in QlikView
- Once you’re comfortable with the basics, you can explore some advanced techniques in QlikView. Learn how to work with complex data structures and build advanced data models that combine data from multiple sources.
- This can include using QlikView’s scripting capabilities to transform data into useful formats for analysis. Set analysis is a powerful feature in QlikView that allows you to define complex filters and perform calculations over specific subsets of data, making it easier to do comparative analysis.
- Create custom calculations using expressions and variables. This allows you to tailor your analysis and Data Visualizations to meet your specific business requirements. As you work with larger datasets, performance becomes critical.
- Learn best practices for optimizing the performance of your QlikView applications, including data model optimization, script optimization, and proper memory usage.
Getting Ready for a Business Analyst Job Interview? Check Out Our Blog on Business Analyst Interview Questions & Answer
QlikView Best Practices and Tips
When starting with QlikView, begin with a simple data model and dashboard. Avoid overcomplicating things in the beginning. As you gain more experience, you can gradually introduce more complex features. The Qlik community is vast and full of helpful resources, from forums to tutorials. Leverage this community to learn new techniques and troubleshoot issues. Always keep the end-user experience in mind when designing dashboards. Make your visualizations clear, concise, and interactive. Avoid cluttering your dashboard with too many elements. As your QlikView applications grow, ensure that you document your data models, scripts, and any custom expressions. This will help when you need to troubleshoot or update your application in the future. Make sure to schedule regular data reloads to keep your reports and dashboards up to date. Use QlikView’s publisher feature to automate these reloads.
Conclusion
QlikView is a powerful tool that enables organizations to tap into the full potential of their data, create insightful visualizations, and make data-driven decisions. By understanding QlikView’s key features, architecture, and best practices, you can unlock its capabilities and improve your organization’s data analysis processes. This guide provides the essential steps to help you become proficient in QlikView, ensuring you can use it effectively for optimal results. Whether you’re just beginning with QlikView or looking to enhance your skills, the platform offers a range of features that support Business Analyst Training and can benefit businesses of all sizes. From data extraction to visualization, QlikView’s intuitive design allows users to interact with and explore their data in a way that fosters informed decision-making. By following the best practices outlined in this guide, you’ll be well-equipped to navigate the tool and use it to its fullest potential. Whether you’re aiming to create dynamic dashboards or optimize data analysis workflows, QlikView provides the resources you need to elevate your organization’s data capabilities and drive meaningful insights.