
Last updated on 22nd Apr 2025| 9002
- Introduction to Data Analysis
- Types of Data Analysis
- Importance of Data Analysis
- Key Steps in Data Analysis
- Descriptive vs. Inferential Analysis
- Statistical Techniques Used in Data Analysis
- Data Visualization Techniques
- Tools Used for Data Analysis
- Challenges in Data Analysis
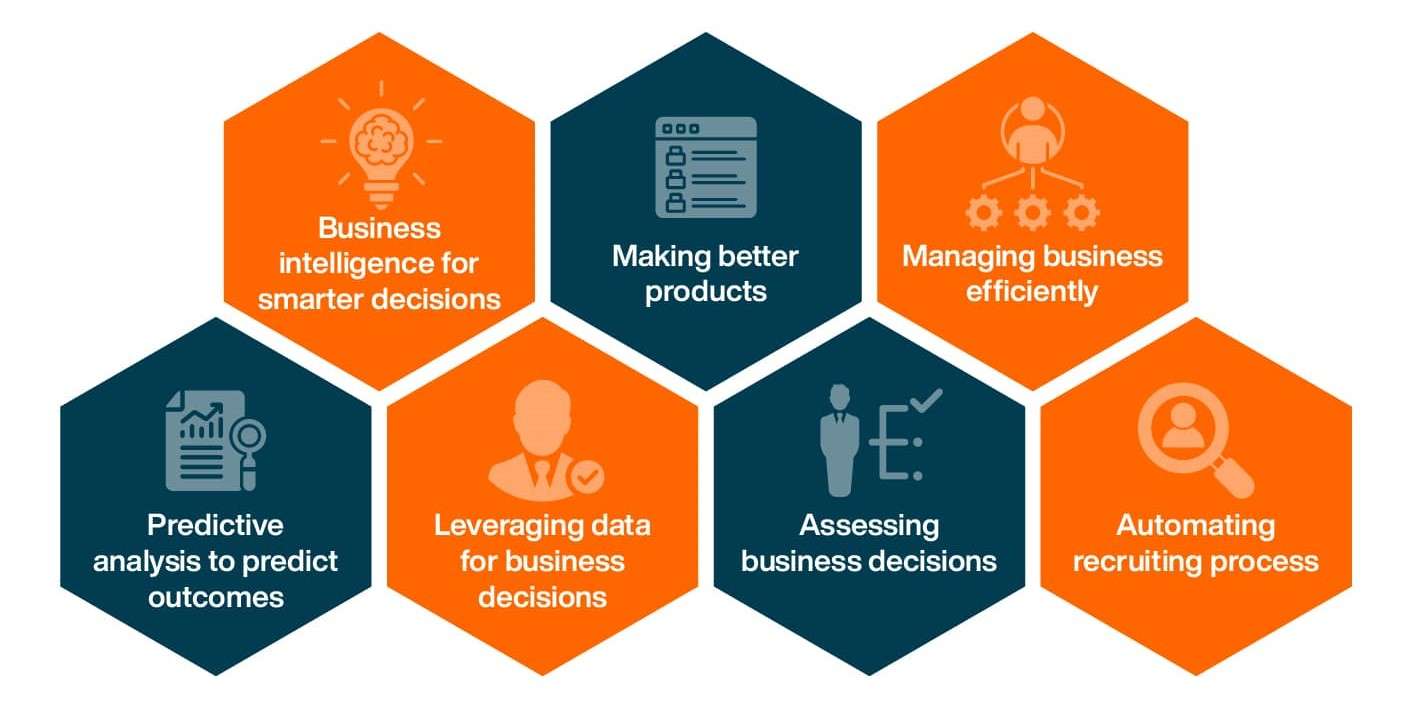
- Applications of Data Analysis in Business
- Role of AI in Data Analysis
- Future Trends in Data Analysis
Introduction to Data Analysis
Data analysis inspects, cleans, transforms, and models data to uncover valuable information, draw conclusions, and support decision-making. Organizations and individuals rely heavily on data analysis to make informed decisions in today’s data-driven world. Data science training can enhance the application of data analysis in various fields, including business, healthcare, and social sciences. It provides critical insights that help identify trends, patterns, and correlations, ultimately improving strategies, processes, and outcomes.
Types of Data Analysis
Data analysis can be classified into different types depending on the goals and techniques used. Below are the most common types of data analysis:
1. Descriptive AnalysisDescriptive analysis is used to summarize and describe a dataset’s features. It involves calculating basic statistical metrics like averages, medians, and standard deviations. Descriptive analysis provides insights into the “what” of the data, helping to identify trends or patterns that emerge from it.
- Example: A company analyzing customer purchase behavior to identify the average spending per customer. 2. Diagnostic Analysis
- Example: A retail business analyzing why certain products are not selling well. 3. Predictive Analysis
- Example: Using past sales data to forecast future sales and inventory needs. 4. Prescriptive Analysis
- Example: A transportation company analyzes traffic patterns and delivery schedules to suggest the most efficient routes. 5. Exploratory Data Analysis (EDA)
- Example: Visualizing the distribution of customer ages in a dataset using histograms or box plots.
Diagnostic analysis investigates the “why” behind trends observed in descriptive analysis. It seeks to identify causes or reasons for particular patterns, helping to uncover relationships and causal links in the data.
Predictive analysis uses statistical models and machine learning algorithms to predict future trends or outcomes based on historical data. It is helpful in forecasting, risk management, and decision-making.
Prescriptive analysis focuses on providing recommendations for optimal actions. It uses algorithms and simulations to suggest the best action for a particular situation, often involving optimization techniques and decision-making models.
EDA is an approach that uses statistical graphics, plots, and other data visualization methods to understand the main characteristics of the data. It helps discover patterns, relationships, or anomalies that were not initially apparent.
Importance of Data Analysis
Data analysis is crucial for several reasons, particularly in decision-making, business operations, and problem-solving.Learn more about What Does a Data Analyst Do?
1. Improved Decision MakingData analysis provides the insights necessary to make informed decisions. Businesses can identify the most successful strategies and predict future outcomes by analyzing past and current data.
2. Enhanced Business PerformanceData analysis helps businesses identify inefficiencies and opportunities for improvement, leading to optimized operations, better resource allocation, and increased profitability.
3. Identifying Trends and PatternsThrough data analysis, trends and patterns that are otherwise hidden in large datasets can be revealed. This can help businesses anticipate customer needs, market changes, and potential risks.
4. Personalized Customer ExperienceData analysis allows businesses to understand customer behavior and preferences, leading to more personalized marketing strategies and improved customer satisfaction.
5. Risk MitigationBy analyzing data, businesses can identify potential risks, make predictions, and develop strategies to mitigate those risks, whether financial, operational, or market-based.
Key Steps in Data Analysis
The data analysis process generally follows these key steps:
1. Data CollectionThe first step in data analysis is gathering data from various sources, such as surveys, sensors, databases, or external APIs. The quality of the data collected greatly influences the quality of the analysis.
2. Data CleaningThis step involves removing errors, inconsistencies, and missing values from the data. Data cleaning is essential for ensuring the reliability and accuracy of the analysis.
3. Data TransformationData transformation involves converting the raw data into a usable format. This might include normalizing data, aggregating values, or converting categorical data into numerical values for analysis.
4. Exploratory Data Analysis (EDA)EDA involves using visualization techniques and summary statistics to explore the data, identify relationships, and detect outliers. It also helps formulate hypotheses for further analysis.
5. Data ModelingThis step involves applying statistical models or machine learning algorithms to the data to test hypotheses, predict outcomes, or identify trends. It can include regression analysis, classification, clustering, and other techniques.
6. Interpretation and ReportingAfter the analysis, the results must be interpreted in the business problem context. The insights are then communicated to stakeholders through reports, dashboards, or visualizations for decision-making.

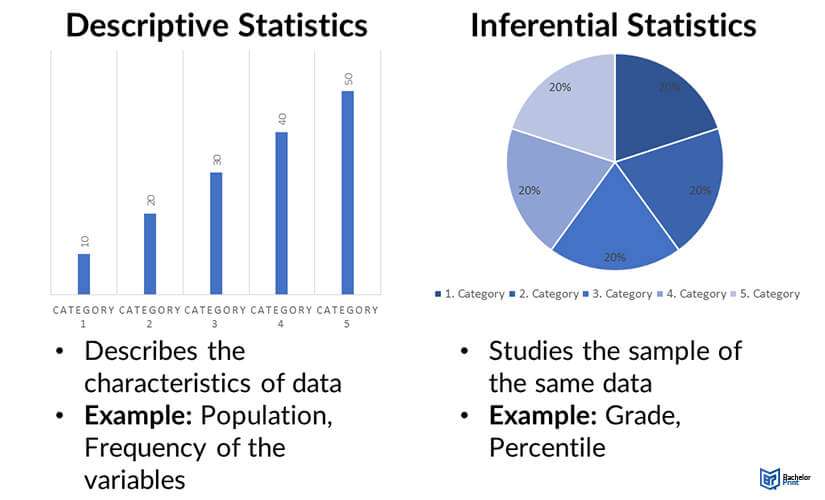
Descriptive vs. Inferential Analysis
Descriptive Analysis:Descriptive analysis focuses on summarizing and describing the data. It answers questions about “what” has happened in the data by providing metrics such as averages, frequencies, and distributions.
- Example: Calculating the average score of students in a class. Inferential Analysis:
- Example: Using a sample of customers to predict the purchasing behavior of all customers.
Inferential analysis goes beyond summarization and attempts to make predictions or generalizations about a population based on a sample. It uses statistical tests and models to infer patterns or relationships and to test hypotheses.
Statistical Techniques Used in Data Analysis
Statistical techniques are fundamental in data analysis, as they help uncover relationships and patterns in the data. Some commonly used statistical methods include:
- Regression Analysis: Used to examine relationships between variables, regression helps predict the value of a dependent variable based on one or more independent variables.
- Hypothesis Testing: Statistical tests, such as t-tests or chi-square tests, evaluate hypotheses and determine the likelihood that an observed result is due to chance.
- ANOVA (Analysis of Variance): ANOVA is used to compare the means of different groups to see if there are any statistically significant differences between them.
- Correlation Analysis: Measures the strength and direction of the relationship between two variables.
- Time Series Analysis involves analyzing data points collected or recorded at specific intervals, which helps forecast trends or patterns over time.
- Cluster Analysis groups similar data points into clusters based on particular features and helps identify patterns or segments in the data.
Data Visualization Techniques
Data visualization is an essential part of data analysis, as it helps communicate complex data insights clearly and visually appealingly. Some of the most common data visualization techniques include
- Bar Charts: These are useful for comparing categorical data or displaying frequencies across different categories.
- Line Charts are ideal for showing trends over time or continuous data, such as stock prices or sales over several months.
- Histograms: These show the distribution of numerical data, helping to visualize the frequency of data points within specific ranges.
- Pie Charts are good for showing the proportion of categories relative to the whole, such as market share distribution.
- Scatter Plots: Help visualize the relationship between two numerical variables and detect correlations or trends.
- Heatmaps: Provide a color-coded representation of data values in a matrix format, often used for correlation analysis or geographical data.
Tools Used for Data Analysis
Several tools are available for data analysis, ranging from simple software to advanced analytics platforms. Some of the most commonly used tools include Learn more through Data science training
- Excel: A widely used spreadsheet tool that provides fundamental data analysis and visualization features, including pivot tables, charts, and data manipulation tools.
- R: An open-source programming language and software environment for statistical computing and graphics, widely used for data analysis, statistical modeling, and machine learning.
- Python: A general-purpose programming language with powerful libraries for data analysis, such as Pandas, NumPy, and Matplotlib. Python is widely used for data science and machine learning.
- Tableau: A data visualization tool that allows users to create interactive and shareable dashboards for data analysis.
- SQL is a language used to query and manage data in relational databases. It is a crucial tool for extracting and analyzing large datasets stored in databases.
- Power BI: A business analytics service from Microsoft that provides interactive data visualizations and business intelligence capabilities. Learn more about Data Analytics Tools
Challenges in Data Analysis
Despite its advantages, data analysis presents several challenges:
- Data Quality: Poor data quality (inaccurate, incomplete, or inconsistent) can lead to misleading conclusions. Cleaning and preparing data is a time-consuming but essential step.
- Data Volume: Large datasets can be challenging to manage, analyze, and interpret. This requires robust infrastructure and tools capable of handling big data.
- Complexity: Analyzing complex data and drawing meaningful insights often requires advanced statistical techniques and expertise, making it challenging for non-experts.
- Data Privacy and Security: Handling sensitive data requires strict compliance with regulations and measures to ensure privacy and security.
Applications of Data Analysis in Business
Data analysis has a wide range of applications in business, including:
- Market Research: Understanding consumer behavior, preferences, and trends to tailor products and services.
- Customer Segmentation: Analyzing customer data to group customers based on common characteristics and behaviors for targeted marketing.
- Financial Analysis: Evaluating financial data to make investment decisions, assess risks, and forecast future performance.
- Operations Optimization: Identifying inefficiencies in business processes and improving operational effectiveness.
- Sales Forecasting: Using historical sales data to predict future sales and manage inventory levels.
Role of AI in Data Analysis
Artificial intelligence (AI) is increasingly important in data analysis, particularly in automating complex tasks and uncovering deeper insights. Machine learning algorithms can identify patterns, classify data, and make predictions without explicit programming. AI-driven tools can analyze massive datasets more quickly and accurately, improving decision-making processes. Learn more through Data science training.
Future Trends in Data Analysis
The following trends shape the future of data analysis:
- Automation and AI Integration: AI and machine learning will continue to automate complex data analysis tasks, allowing businesses to gain real-time insights.
- Big Data Analytics: As data volume grows, advanced tools and platforms enable businesses to efficiently process and analyze larger datasets.
- Predictive and Prescriptive Analytics: The focus will shift from analyzing past data to making predictions and prescribing actions for better decision-making.
- Augmented Analytics: Leveraging AI and machine learning to enhance real-time data preparation, discovery, and insight generation.
In conclusion, data analysis remains a powerful tool for businesses to gain insights and make informed decisions. As technology advances, data analysis capabilities and applications will continue to grow, enabling organizations to thrive in an increasingly data-driven world.