
Last updated on 22nd May 2025| 10112
- What is Dimensionality Reduction?
- Curse of Dimensionality: Challenges and Solutions
- Principal Component Analysis (PCA) Explained
- Linear Discriminant Analysis (LDA) Overview
- t-Distributed Stochastic Neighbor Embedding (t-SNE)
- Autoencoders for Dimensionality Reduction
- Implementing PCA in Python
- Applications of Dimensionality Reduction in AI
What is Dimensionality Reduction?
Dimensionality reduction is a technique used in data science and machine learning to reduce the number of input variables in a dataset while preserving its essential features. The goal is to simplify complex data, making it easier to analyze and visualize without sacrificing key information. In many real-world datasets, especially in high-dimensional spaces, there are often redundant or irrelevant features that can be eliminated without losing significant patterns. By reducing the dimensionality, we improve computational efficiency and mitigate issues like overfitting, which is a key concept in Data Science Training. There are two main approaches to dimensionality reduction: feature selection and feature extraction. Feature selection involves choosing a subset of the original features based on their importance, while feature extraction creates new, synthetic features by combining or transforming the original ones. Popular techniques for dimensionality reduction include Principal Component Analysis (PCA), which identifies the directions (principal components) in which the data varies the most, and t-SNE, which is commonly used for visualizing high-dimensional data in lower dimensions. Dimensionality reduction is essential in various applications, such as data visualization, noise reduction, and improving the performance of machine learning algorithms, especially when dealing with large and complex datasets.
Do You Want to Learn More About Data Science? Get Info From Our Data Science Course Training Today!
Curse of Dimensionality: Challenges and Solutions
The “Curse of Dimensionality” refers to the challenges that arise when working with high-dimensional data. As the number of features (or dimensions) in a dataset increases, the volume of the space grows exponentially, causing data points to become sparse. This sparsity makes it difficult to identify meaningful patterns, as the data becomes increasingly scattered, leading to overfitting in machine learning models, which can be addressed in What is Interpolation. With more dimensions, the data also requires significantly more computational resources to process, making analysis and model training slower and less efficient. One of the primary challenges is that traditional algorithms, such as k-nearest neighbors (k-NN) and clustering, struggle to perform well in high-dimensional spaces, as distances between points become less distinguishable. This reduces the effectiveness of many models.
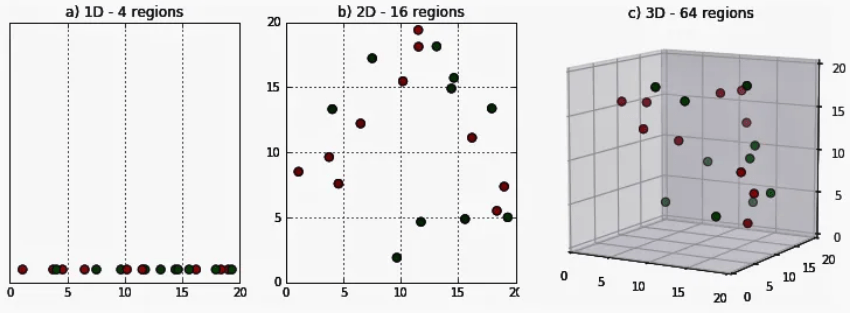
Additionally, as dimensionality increases, the risk of overfitting also rises, as models might pick up on noise rather than true underlying patterns. To tackle the curse of dimensionality, dimensionality reduction techniques like Principal Component Analysis (PCA) and t-SNE can be applied to lower the number of dimensions while preserving important information. Feature selection methods, regularization techniques, and ensemble learning also offer solutions to manage high-dimensional data and mitigate the challenges posed by this phenomenon.
Principal Component Analysis (PCA) Explained
- Benefits: PCA helps reduce computational complexity, improve model performance, and mitigate overfitting, especially in high-dimensional datasets.
- Applications: PCA is widely used in fields like image processing, finance, and machine learning for tasks such as feature extraction, noise reduction, and data visualization.
- Purpose of PCA: Principal Component Analysis (PCA) is a dimensionality reduction technique used to reduce the number of features in a dataset while preserving its most important information.
- How PCA Works: PCA transforms the original features into a new set of orthogonal components, called principal components, which can also be applied in Discover the Best AI Tools for 2025 Writing and Editing.
- Data Standardization: Before applying PCA, data is often standardized to ensure each feature has a mean of 0 and a standard deviation of 1. This ensures that features with larger scales do not dominate the analysis.
- Eigenvectors and Eigenvalues: PCA computes the eigenvectors (directions) and eigenvalues (magnitude) of the data’s covariance matrix. The eigenvectors define the directions of maximum variance, while eigenvalues measure how much variance is captured by each component.
- Selecting Components: The number of principal components chosen for the reduced dataset is based on the cumulative explained variance. Typically, enough components are chosen to capture most of the data’s variance.
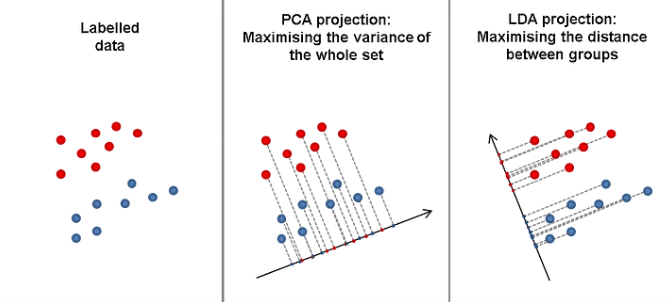
- Purpose of LDA: Linear Discriminant Analysis (LDA) is a supervised dimensionality reduction technique used to maximize the separation between multiple classes in a dataset.
- How LDA Works: LDA projects data onto a lower-dimensional space using linear combinations of features, with the goal of maximizing class separability while minimizing intra-class variance.
- Class Separation: LDA computes the between-class variance and within-class variance. The key idea is to find directions where the ratio of between-class variance to within-class variance is maximized, a fundamental concept in Data Science Training.
- Assumptions of LDA: LDA assumes that the data from each class follows a Gaussian distribution with the same covariance matrix (homoscedasticity), which allows the algorithm to model the decision boundaries as linear.
- Feature Transformation: LDA transforms the original features into a new set of features, called discriminants, which are optimized for class separability. Typically, the number of dimensions after LDA is equal to the number of classes minus one.
- Benefits: LDA reduces dimensionality while improving classification performance, especially in tasks with well-defined class boundaries, such as face recognition or speech analysis.
- Applications: LDA is widely used in classification problems in fields like finance, biology, and marketing, particularly in situations where the goal is to distinguish between different classes or categories effectively.
- Introduction to Autoencoders: Autoencoders are a type of neural network designed for unsupervised learning tasks, specifically used for dimensionality reduction.
- Applications: Autoencoders are used for anomaly detection, denoising, and dimensionality reduction, helping to make large datasets more manageable and interpretable.
- Advantages: Autoencoders can capture nonlinear relationships between features, unlike traditional linear methods like PCA, making them more powerful for complex data.
- Encoder Network: The encoder transforms the high-dimensional input data into a lower-dimensional latent space representation, an important concept in Data Analytics Careers Skills, Types, and Outlook.
- Latent Space Representation: The lower-dimensional code or latent space is the compressed version of the input data. It aims to retain the most relevant information while discarding unnecessary details.
- Decoder Network: The decoder reconstructs the data from the latent space back to its original dimension. The goal is to minimize the difference between the original input and the reconstructed output.
- Reconstruction Loss: During training, the autoencoder minimizes a loss function (such as mean squared error) between the original and reconstructed data, ensuring that the network learns a compact yet informative representation.
Would You Like to Know More About Data Science? Sign Up For Our Data Science Course Training Now!
Linear Discriminant Analysis (LDA) Overview

t-Distributed Stochastic Neighbor Embedding (t-SNE)
t-Distributed Stochastic Neighbor Embedding (t-SNE) is a powerful dimensionality reduction technique primarily used for visualizing high-dimensional data in two or three dimensions. Unlike other methods such as Principal Component Analysis (PCA), which project data along axes that maximize variance, t-SNE focuses on preserving the local structure of the data. It converts pairwise similarities between data points into probabilities, ensuring that points that are close in the high-dimensional space remain close in the lower-dimensional space, while distant points are spread apart. The process of t-SNE involves two main steps: first, it calculates the probability distributions of distances between data points in the original high-dimensional space, and then, it aims to replicate these distributions in a lower-dimensional space, making it a key technique in Data Analytics Tools. t-SNE minimizes the difference between these probability distributions using a cost function, typically measured by Kullback-Leibler divergence. One of the strengths of t-SNE is its ability to reveal clusters and patterns in data that may not be apparent in high-dimensional spaces. However, t-SNE can be computationally expensive and sensitive to hyperparameters like perplexity, learning rate, and the number of iterations. Despite these challenges, t-SNE remains one of the most popular techniques for visualizing complex data in machine learning and data analysis.
Want to Pursue a Data Science Master’s Degree? Enroll For Data Science Masters Course Today!
Autoencoders for Dimensionality Reduction
Implementing PCA in Python
Implementing Principal Component Analysis (PCA) in Python involves using libraries like Scikit-learn and NumPy for efficient data processing and dimensionality reduction. First, the dataset is standardized using StandardScaler to ensure that each feature has a mean of 0 and a standard deviation of 1. This step is crucial since PCA is sensitive to the scale of the data. After standardization, PCA is applied using PCA() from Scikit-learn, specifying the number of components to retain (e.g., 2 for 2D visualization), a key technique in Data Science Applications. Once PCA is fitted to the data, it transforms the high-dimensional data into a lower-dimensional space while retaining as much variance as possible. The reduced data can be visualized using a scatter plot, where each point represents an observation, and axes correspond to the principal components. Additionally, explained variance is calculated to show how much variance each principal component accounts for, helping assess the effectiveness of the dimensionality reduction. Here’s a simplified process: standardize the data, apply PCA, reduce dimensions, and visualize the results. PCA is widely used for feature extraction, data visualization, and noise reduction in machine learning and data science applications.
Are You Preparing for Data Science Jobs? Check Out ACTE’s Data Science Interview Questions & Answer to Boost Your Preparation!
Applications of Dimensionality Reduction in AI
Dimensionality reduction plays a crucial role in Artificial Intelligence (AI) by simplifying complex data and improving the performance of machine learning models. One of its key applications is in data visualization, where high-dimensional data, such as images or text, can be reduced to two or three dimensions for easier analysis and interpretation. Techniques like PCA and t-SNE are commonly used to visualize patterns and clusters in data, aiding in tasks like exploratory data analysis and anomaly detection. In machine learning, dimensionality reduction helps mitigate the “curse of dimensionality,” which can lead to overfitting and slower model training, a crucial technique covered in Data Science Training. By reducing the number of features, models become more efficient, requiring less computational power and memory. This is particularly important in applications like natural language processing (NLP), where text data is often high-dimensional, and image processing, where pixel data can be vast. Another key application is in noise reduction. By eliminating irrelevant or redundant features, dimensionality reduction enhances the signal-to-noise ratio, improving the model’s ability to focus on important patterns. In fields like healthcare, where data is often large and complex, dimensionality reduction can streamline analysis and improve predictive accuracy, making it an essential tool in AI development.