Last updated on 22nd May 2025| 9551
- Introduction to Statistical Modeling
- Types of Statistical Models
- Regression Models
- Probability Distributions and Their Role in Modeling
- Hypothesis Testing in Statistical Models
- Bayesian Statistics in Modeling
- Machine Learning vs Statistical Modeling
- Tools for Statistical Modeling
Introduction to Statistical Modeling
Statistical modeling is a powerful mathematical framework used to analyze and interpret data. It involves building models that define relationships between variables, allowing for predictions, pattern recognition, and data-driven decision-making. By using techniques such as regression analysis, time series analysis, and hypothesis testing, statistical modeling helps in understanding complex datasets and making informed conclusions. In various industries, statistical modeling plays a critical role. In finance, it aids in risk assessment, portfolio management, and predicting market trends. In healthcare, Data Science Training is used for disease forecasting, patient outcome predictions, and optimizing treatment plans. Similarly, in economics, statistical models help analyze economic indicators and forecast future trends. Machine learning, a subset of artificial intelligence, relies heavily on statistical modeling techniques to develop algorithms that can learn from data and improve over time. This intersection of statistics and machine learning has led to the development of powerful predictive models used in everything from recommendation systems to autonomous vehicles. As the importance of data-driven decisions continues to rise, statistical modeling remains a foundational tool, enabling organizations to optimize strategies, predict future outcomes, and improve overall efficiency.
Do You Want to Learn More About Data Science? Get Info From Our Data Science Course Training Today!
Types of Statistical Models
Statistical models come in various types, each designed for different purposes and types of data. One of the most common is linear regression, used to model the relationship between a dependent variable and one or more independent variables. It assumes a straight-line relationship and is widely applied in predicting outcomes, such as sales or prices. Logistic regression is another popular model, particularly for binary outcomes, while U-Net Architecture is widely used for image segmentation tasks. It is used when the dependent variable is categorical (e.g., yes/no, success/failure), and it estimates the probability of one of the outcomes occurring. Time series models, such as ARIMA (AutoRegressive Integrated Moving Average), are used to analyze data points collected or recorded at specific time intervals. These models are vital for forecasting future values based on historical trends, such as predicting stock prices or demand for products.
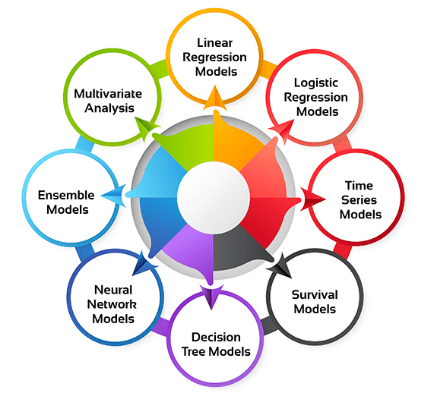
Bayesian models incorporate prior knowledge or beliefs into the analysis, updating them as new data is observed. They are particularly useful in situations where uncertainty plays a significant role. Multivariate models analyze the relationship between multiple variables simultaneously, helping to understand how different factors interact and influence each other. Each type of statistical model serves a distinct purpose, helping to draw meaningful insights and make predictions based on data.
Regression Models
- Lasso Regression: Similar to ridge regression but capable of shrinking some coefficients to zero, effectively performing variable selection along with regularization.
- Stepwise Regression: An automatic method for selecting important variables by adding or removing predictors based on statistical criteria, improving model efficiency.
- Polynomial Regression: Data Mining Architecture extends linear regression by including polynomial terms to model nonlinear relationships between variables.
- Ridge Regression: A regularization technique that adds a penalty term to the linear regression model to reduce overfitting, especially when multicollinearity exists among predictors.
- Linear Regression: This is the most basic form of regression, used to model the relationship between a dependent variable and one or more independent variables by fitting a straight line.
- Multiple Linear Regression: An extension of linear regression that includes two or more independent variables. It helps analyze how several factors together influence a single outcome, making it useful in more complex real-world scenarios.
- Logistic Regression: Used when the dependent variable is categorical, especially binary. It estimates the probability that an event will occur and is common in classification tasks such as fraud detection or customer churn.
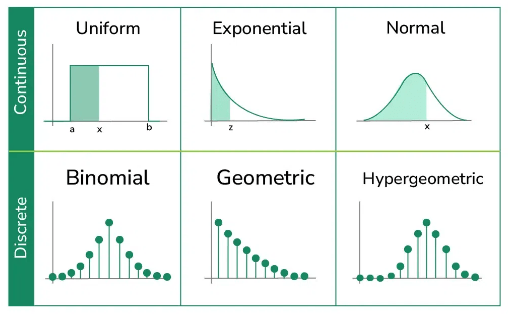
- Definition: A probability distribution describes how the values of a random variable are distributed. It shows the likelihood of different outcomes occurring and serves as a foundation for statistical inference.
- Exponential Distribution: Models the time between events in a Poisson process. Commonly used in reliability analysis and queuing theory.
- Uniform Distribution: Data Science Training uses scenarios where all outcomes have equal probability, often in simulations and modeling situations with no preference among outcomes.
- Role in Modeling: Probability distributions help model uncertainty, estimate parameters, and form the basis of hypothesis testing, regression, and risk analysis in data-driven decision-making.
- Normal Distribution: Also known as the Gaussian distribution, it is symmetrical and bell-shaped, often used to model natural phenomena like heights, test scores, or measurement errors.
- Binomial Distribution: This discrete distribution models the number of successes in a fixed number of independent yes/no trials, such as flipping a coin. It’s widely used in quality control and survey analysis.
- Poisson Distribution: Used for modeling the number of events occurring in a fixed interval of time or space. It’s ideal for rare event modeling, such as system failures or arrival rates.
- Computational Tools: Bayesian modeling often relies on simulation techniques like Markov Chain Monte Carlo (MCMC), implemented in tools such as Stan, PyMC, and BUGS.
- Definition: Bayesian statistics is a framework that applies probability to statistical problems by incorporating prior knowledge or beliefs along with observed data to update the probability of a hypothesis.
- Bayes’ Theorem: Bayes’ Theorem, central to Bayesian statistics, is increasingly used in Emerging Tech in Civil to Software Engineering.
- Prior and Posterior: The prior represents the initial assumptions about a parameter before observing data. The posterior is the updated belief after analyzing the data.
- Flexibility: Bayesian models are highly flexible and can handle complex data structures, hierarchical models, and small sample sizes more effectively than traditional methods.
- Uncertainty Quantification: Bayesian methods naturally provide probability distributions for model parameters, offering a more complete view of uncertainty compared to single-point estimates.
Would You Like to Know More About Data Science? Sign Up For Our Data Science Course Training Now!
Probability Distributions and Their Role in Modeling

Hypothesis Testing in Statistical Models
Hypothesis testing is a fundamental concept in statistical modeling, used to make inferences or draw conclusions about a population based on sample data. It involves two competing hypotheses: the null hypothesis (H₀), which suggests no effect or no difference, and the alternative hypothesis (H₁), which suggests the presence of an effect or a difference. The goal is to evaluate the evidence against the null hypothesis and decide whether to reject it in favor of the alternative hypothesis. The process begins by formulating the hypotheses and selecting a significance level (α), commonly set at 0.05, which is also crucial in Fine-Tuning AI models for statistical validity. A test statistic is then calculated based on the sample data, and this statistic is compared to a critical value or used to determine a p-value. The p-value indicates the probability of obtaining the observed data if the null hypothesis were true. If the p-value is smaller than the significance level, the null hypothesis is rejected. Common methods for hypothesis testing include t-tests, chi-square tests, and ANOVA. These tests vary depending on the type of data and the research question. Hypothesis testing plays a crucial role in validating assumptions, guiding decisions, and ensuring the robustness of statistical models in real-world applications.
Looking to Master Data Science? Discover the Data Science Masters Course Available at ACTE Now!
Bayesian Statistics in Modeling
Machine Learning vs Statistical Modeling
Machine learning and statistical modeling are both powerful approaches for analyzing data, but they differ in methodology, application, and objectives. Statistical modeling is a traditional approach that focuses on understanding and explaining relationships between variables. It typically involves the use of well-defined mathematical models, such as linear regression or hypothesis testing, to make inferences or predictions. The goal is often to identify causality, estimate parameters, and test specific hypotheses. Statistical models are generally based on assumptions about the data’s distribution and structure. On the other hand, machine learning is more concerned with prediction and pattern recognition rather than explanation. Boost Your SEO Strategy with AI Automation using machine learning models, such as decision trees, support vector machines, or neural networks, which are designed to learn from large amounts of data and improve performance over time without explicit programming. While machine learning can make accurate predictions, it often operates as a “black box,” where understanding the exact relationship between variables is secondary to the accuracy of the predictions. While statistical modeling requires prior knowledge of the underlying data structure and assumptions, machine learning emphasizes flexibility and can handle large, complex datasets with less reliance on assumptions. In practice, both approaches are complementary statistical modeling helps with interpretation, while machine learning excels in predictive power.
Want to Learn About Data Science? Explore Our Data Science Interview Questions & Answer Featuring the Most Frequently Asked Questions in Job Interviews.
Tools for Statistical Modeling
There are several powerful tools and software available for statistical modeling, each offering unique features and capabilities for analyzing data. R is one of the most widely used tools for statistical analysis and modeling. With its extensive library of packages like ggplot2, dplyr, and caret, R provides a flexible and comprehensive environment for statistical modeling, data visualization, and machine learning. Python is another popular choice, especially for its rich ecosystem of libraries such as NumPy, SciPy, Pandas, StatsModels, and Scikit-learn. In Data Science Training, these libraries support a wide range of statistical techniques, from simple linear regression to complex machine learning algorithms, making Python highly versatile for data science tasks. SAS (Statistical Analysis System) is a robust, enterprise-level tool used extensively in industries such as healthcare and finance for advanced statistical modeling. Its powerful analytics capabilities are used for predictive modeling, time series analysis, and complex data manipulations. SPSS (Statistical Package for the Social Sciences) is another widely used software, particularly in social sciences, for data analysis and statistical modeling. It provides a user-friendly interface for performing a variety of statistical tests and generating reports. Each of these tools offers unique strengths, depending on the complexity of the data and the specific goals of the analysis.