
Last updated on 26th May 2025| 9808
- Introduction to Data Analyst Skills
- Technical Skills: SQL, Python, Excel
- Data Cleaning and Preprocessing Skills
- Data Visualization Skills
- Statistical and Analytical Skills
- Data Interpretation and Reporting
- Machine Learning Basics for Data Analysts
- Tools and Technologies Used in Data Analysis
Introduction to Data Analyst Skills
A data analyst plays a crucial role in enabling businesses to make well-informed decisions by analyzing and interpreting complex data sets. Their primary responsibility is to convert raw data into meaningful, actionable insights that help guide strategic planning and improve business outcomes. As organizations increasingly rely on data-driven approaches, the demand for skilled data analysts has surged across diverse industries, from finance and healthcare to marketing and technology. To excel in this role, a data analyst must possess a combination of technical, analytical, communication, and interpersonal skills. Data Science Training covers technical skills including proficiency in programming languages like Python or R, expertise in SQL for database management, and familiarity with data visualization tools such as Tableau or Power BI. Strong analytical skills enable analysts to identify trends, patterns, and anomalies within data, which are essential for accurate forecasting and problem-solving. Equally important are communication skills, as data analysts must clearly present complex findings to both technical teams and non-technical stakeholders. Soft skills such as critical thinking, attention to detail, and adaptability further enhance their ability to collaborate across departments and respond to evolving business needs. Together, these skills empower data analysts to transform data into strategic assets that drive organizational success.
Interested in Obtaining Your Data Science Certificate? View The Data Science Course Training Offered By ACTE Right Now!
Technical Skills: SQL, Python, Excel
The foundation of a data analyst’s role is built on strong technical proficiency, which is essential for efficiently handling, manipulating, and analyzing data. Among the many technical skills required, SQL (Structured Query Language) stands out as one of the most critical. Python Career Opportunities often require knowledge of SQL, the standard language used to interact with databases, enabling analysts to query, extract, and manage data from large datasets stored across various platforms. A data analyst must be proficient in writing SQL queries to filter, sort, aggregate, and join data tables, which forms the backbone of data retrieval and preparation for analysis. Mastering SQL allows analysts to work directly with databases, making it easier to access precise data needed for generating reports, dashboards, or further statistical analysis.
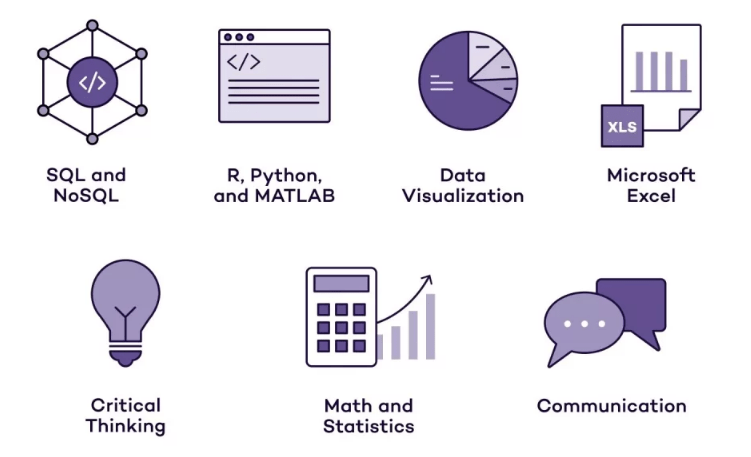
Beyond simple queries, experienced data analysts use SQL to perform complex data operations, optimize query performance, and ensure data accuracy. Additionally, SQL skills are often combined with knowledge of other tools like Excel, Python, or R to create comprehensive data workflows. In summary, SQL proficiency is indispensable for data analysts, as it empowers them to efficiently extract actionable insights from raw data, supporting informed decision-making within organizations.
Data Cleaning and Preprocessing Skills
- Handling Missing Data: Identifying and managing missing or incomplete data through techniques like imputation or removal to maintain data quality.
- Data Transformation: What is Data Science? It involves converting data into appropriate formats and normalizing or scaling values to prepare for accurate analysis.
- Removing Duplicates: Detecting and eliminating duplicate records that could skew results and lead to inaccurate insights.
- Outlier Detection: Identifying and addressing outliers that may distort statistical analyses or predictive models.
- Data Integration: Combining data from multiple sources, ensuring consistency and accuracy across datasets.
- Data Validation: Verifying data accuracy, completeness, and integrity to ensure reliable analysis outcomes.
- Automating Cleaning Processes: Using scripting languages like Python or R to automate repetitive cleaning tasks, improving efficiency and reproducibility.
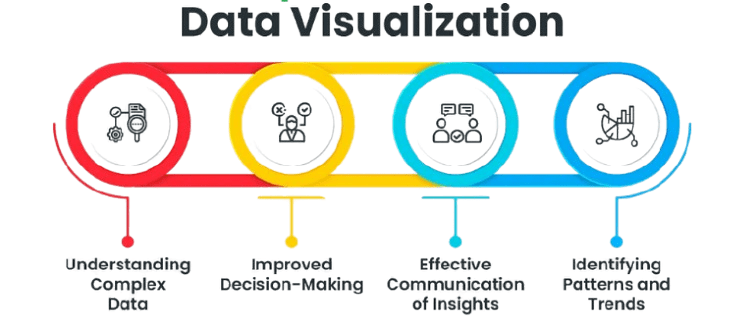
- Understanding Data: A strong grasp of the underlying data is essential to choose the most effective visualization techniques that accurately represent insights.
- Choosing the Right Chart Type: Selecting appropriate visuals such as bar charts, line graphs, scatter plots, or heatmaps depends on the data and the story being told.
- Using Visualization Tools: Proficiency in tools like Tableau, Power BI, Excel, and Python libraries (Matplotlib, Seaborn) allows analysts to create clear and interactive visuals, highlighting the differences in focus between Big Data vs Data Science.
- Simplifying Complexity: Effective visualization distills complex data into simple, digestible graphics that stakeholders can quickly understand.
- Emphasizing Key Insights: Highlighting important trends, outliers, or comparisons helps guide viewers toward the most relevant conclusions.
- Design Principles: Applying good design practices like appropriate color use, labeling, and avoiding clutter improves clarity and impact.
- Storytelling with Data: Combining visuals with narratives creates compelling stories that connect data insights to business decisions.
- Understanding Data Context: Before interpreting data, analysts must understand the business context and objectives to ensure insights are relevant and actionable.
- Analyzing Trends and Patterns: Identifying trends, patterns, and anomalies in data helps uncover underlying factors affecting business outcomes.
- Drawing Meaningful Conclusions: Interpreting statistical results requires connecting data findings to real-world implications and business goals.
- Effective Visualization: Data Science Training emphasizes using charts, graphs, and dashboards to make complex data easier to comprehend for diverse audiences.
- Clear Communication: Reports should present insights clearly and concisely, avoiding jargon and tailoring language for both technical and non-technical stakeholders.
- Providing Recommendations: Beyond presenting data, analysts should suggest actionable steps based on their findings to guide decision-making.
- Continuous Feedback and Improvement: Reporting is an iterative process where feedback from stakeholders helps refine analysis and improve future reports.
To Earn Your Data Science Certification, Gain Insights From Leading Data Science Experts And Advance Your Career With ACTE’s Data Science Course Training Today!
Data Visualization Skills

Statistical and Analytical Skills
Statistical and analytical skills are at the core of a data analyst’s ability to extract meaningful insights from complex datasets. A strong understanding of statistics enables analysts to interpret data accurately, identify trends, and make predictions that drive business decisions. Key statistical concepts such as probability, hypothesis testing, regression analysis, and correlation are essential tools that help analysts assess the significance of their findings and validate results. Beyond just understanding statistics, analytical skills involve critical thinking and problem-solving abilities. Data analysts must be able to break down complex problems into manageable components, explore data patterns using tools like Python Generators, and draw logical conclusions. This involves not only recognizing trends but also detecting anomalies or outliers that could impact decision-making. Proficiency in statistical software like R, Python (with libraries such as Pandas and NumPy), or specialized tools like SPSS and SAS further enhances an analyst’s capability to manipulate data and perform advanced analyses. Combining these skills with data visualization tools helps analysts present their findings in a clear and impactful way, making it easier for stakeholders to understand the story behind the numbers. Ultimately, strong statistical and analytical skills empower data analysts to turn raw data into actionable insights, enabling organizations to make informed, data-driven decisions.
Want to Pursue a Data Science Master’s Degree? Enroll For Data Science Masters Course Today!
Data Interpretation and Reporting
Machine Learning Basics for Data Analysts
Machine learning (ML) is an increasingly important skill for data analysts, enabling them to uncover deeper insights and build predictive models from data. While traditionally associated with data scientists, having a foundational understanding of machine learning concepts empowers data analysts to enhance their analyses and contribute to more advanced projects. At its core, machine learning involves teaching computers to recognize patterns in data and make decisions or predictions without being explicitly programmed for every task. For data analysts, understanding Python Keywords is essential when learning the basics of machine learning, including algorithms like supervised learning, where models are trained on labeled data to predict outcomes, and unsupervised learning, which identifies hidden patterns within unlabeled data. Common algorithms include linear regression, decision trees, clustering, and classification techniques. Familiarity with programming languages like Python or R, along with libraries such as scikit-learn or TensorFlow, allows data analysts to implement simple machine learning models. This skill set helps them move beyond descriptive analytics to predictive and prescriptive analytics, enabling businesses to forecast trends, identify risks, and optimize operations. By integrating machine learning basics into their toolkit, data analysts can add significant value, driving smarter decisions and fostering innovation within their organizations.
Are You Preparing for Data Science Jobs? Check Out ACTE’s Data Science Interview Questions & Answer to Boost Your Preparation!
Tools and Technologies Used in Data Analysis
Data analysts rely on a variety of tools and technologies to collect, process, analyze, and visualize data effectively. These tools help streamline workflows and enable analysts to derive actionable insights that drive business decisions. One of the foundational tools is SQL, which is essential for querying and managing large datasets stored in relational databases. For data manipulation and statistical analysis, programming languages like Python and R are widely used due to their extensive libraries and flexibility. Data Science Training includes learning data visualization tools such as Tableau, Power BI, and Excel to create interactive dashboards and reports that present complex data in an easily understandable format for stakeholders. Spreadsheet software like Excel remains popular for quick calculations, pivot tables, and simple visualizations. In addition to these, analysts often use specialized statistical software such as SPSS or SAS for advanced data modeling and hypothesis testing. Cloud-based platforms like Google BigQuery and Amazon Redshift are increasingly popular for handling large-scale data analytics projects. The combination of these tools enables data analysts to efficiently transform raw data into meaningful insights, helping organizations make informed, data-driven decisions. Staying updated with the latest tools and technologies is crucial for analysts to maintain their effectiveness in an evolving data landscape.