Last updated on 18th Jun 2025| 12127
- Introduction to SAS
- Evolution of SAS Software
- SAS in the Analytics World
- Core Components (Base SAS, Enterprise Miner, etc.)
- Data Preparation in SAS
- Predictive Modeling Capabilities
- Statistical Analysis with SAS
- Visualization and Reporting Tools
- Industries Using SAS
- SAS vs Other Tools (R, Python, etc.)
- Certification and Learning Resources
- Future Outlook for SAS Analytics
Introduction to SAS
What Is SAS Analytics (Statistical Analysis System) is a powerful software suite developed by SAS Institute for advanced analytics, business intelligence, data management, and predictive analytics. Used globally in a variety of industries, SAS enables users to perform sophisticated data analysis and produce meaningful reports and insights. With more than four decades of market presence, SAS remains one of the most trusted platforms for data-driven decision-making. Initially developed at North Carolina State University in the 1960s, SAS has evolved into a comprehensive suite of software applications that support everything from basic statistics to complex machine learning models.
Do You Want to Learn More About Web Developer? Get Info From Our Web Developer Courses Today!
Evolution of SAS Software
SAS began as a statistical package for agricultural researchers, but it quickly expanded into a full-featured platform capable of handling large-scale enterprise needs. Major milestones in SAS Analytics evolution include:
- 1976: SAS Institute was officially founded.
- 1980s–1990s: Introduction of Base SAS, statistical procedures, and graphics.
- 2000s: Emergence of SAS BI (Business Intelligence) and Enterprise Miner.
- 2010s: Expansion into AI, cloud computing, and integration with open-source tools like R and Python.
- 2020s: SAS Viya introduced, offering a modern, cloud-native, and AI-driven analytics platform.
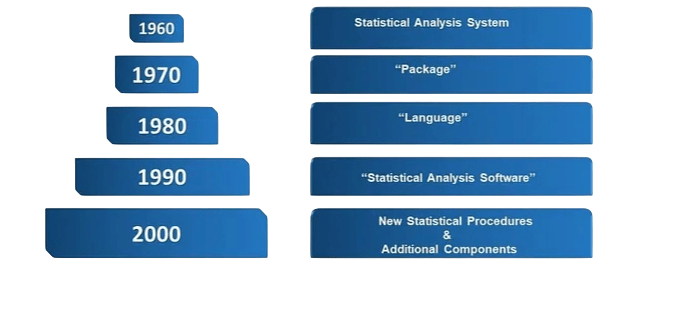
SAS continues to evolve, adapting to the changing data landscape and integrating with modern technologies.
SAS in the Analytics World
In today’s data-centric world, analytics is central to strategic planning, risk management, and customer engagement. SAS Analytics holds a prominent place in this ecosystem thanks to its:Organizations in sectors such as healthcare, banking, pharmaceuticals, and government rely on SAS to make data-informed decisions. The platform’s ability to handle large volumes of data with speed and precision sets it apart from many alternatives.Organizations in sectors such as healthcare, banking, pharmaceuticals, and government rely on SAS to make data-informed decisions. The platform’s ability to handle large volumes of data with speed and precision sets it apart from many alternatives.
- Robust data management capabilities
- Comprehensive statistical and predictive analytics
- Enterprise-grade scalability and security
- Widespread industry adoption
Organizations in sectors such as healthcare, banking, pharmaceuticals, and government rely on SAS to make data-informed decisions. The platform’s ability to handle large volumes of data with speed and precision sets it apart from many alternatives.
To Earn Your Web Developer Certification, Gain Insights From Leading Data Science Experts And Advance Your Career With ACTE’s Web Developer Courses Today!
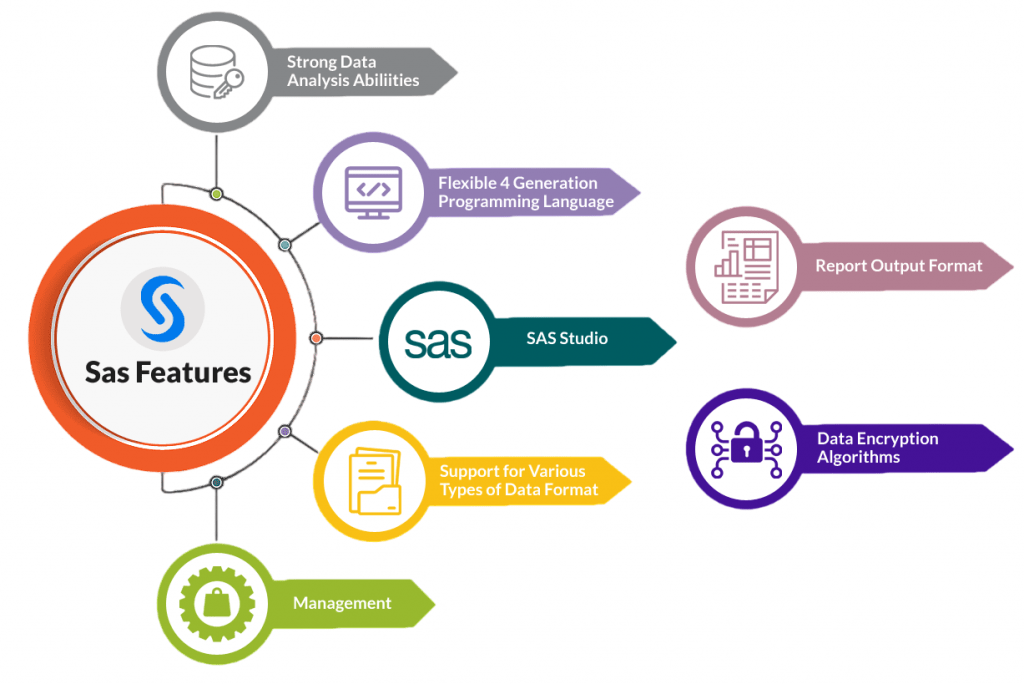
Core Components of SAS
SAS is a complete set of tools designed to manage various data-related tasks, not just a single software program. Base SAS is the foundation of the software. It provides the basics for data cleaning, programming, basic statistical analysis, and data management. It creates a necessary environment for preparing and manipulating data. SAS Enterprise Guide is ideal for users with limited programming skills. It offers a point-and-click interface that enables interactive analysis and automatic code generation. Data mining is the main focus of SAS Enterprise Miner. It helps users involved in more complex analytics by enabling predictive modeling, uncovering patterns, and evaluating or validating models. SAS Visual Analytics provides a web-based platform for interactive data analysis, dashboard development, and visual storytelling. It helps users understand complex data through easy-to-use visualizations. Finally, SAS Viya, with its AI driven, cloud-based design, represents the future of SAS. It easily connects with open-source languages like Python and R, allowing flexibility for modern analytics workflows. Together, What Is SAS Analytics tools serve a wide range of users, from business analysts and statisticians to data scientists, ensuring that everyone has the right tools for making data-driven decisions.
Data Preparation in SAS
Data preparation is a critical phase of any analytical project. SAS provides extensive functionality for data cleansing, transformation, and integration. Key features include:
- Market Basket Analysis: Retailers identify product purchase patterns to design promotions.
- Fraud Detection: Banks use data mining to detect unusual transaction patterns.
- Customer Segmentation: Businesses cluster customers based on buying behavior.
- Data Integration Studio: Drag-and-drop interface for ETL (Extract, Transform, Load) processes.
- Metadata Management: Keeps track of data lineage and enhances governance.
- Support for multiple formats: Works with Excel, CSV, databases, and Hadoop.
SAS’s structured environment ensures data integrity and reproducibility, which is crucial for audit and compliance.

Develop Your Skills with Web Developer Certification Course
Weekday / Weekend BatchesSee Batch DetailsPredictive Modeling Capabilities
Predictive analytics in SAS is powered by advanced algorithms and machine learning techniques. SAS Enterprise Miner and SAS Viya support:
- Regression Models: Linear, logistic, and generalized linear models.
- Decision Trees: Used for classification and regression tasks.
- Neural Networks: Especially for complex pattern recognition.
- Time Series Forecasting: PROC ARIMA, PROC UCM
SAS automates many steps of the modeling pipeline, including:
- Feature selection
- Model comparison
- Model deployment
- Scoring new data
It allows data scientists to develop production-grade models efficiently while ensuring model interpretability.
Statistical Analysis with SAS
One of SAS’s core strengths is its statistical analysis engine. Key procedures include
- Descriptive Statistics: PROC MEANS, PROC FREQ
- Inferential Statistics: PROC TTEST, PROC ANOVA
- Multivariate Analysis: PROC FACTOR, PROC CLUSTER
- Survival Analysis: PROC LIFETEST, PROC PHREG
- Econometrics and Forecasting: PROC AUTOREG, PROC ESM
SAS provides extensive documentation and repeatability of results, which is why it’s heavily used in regulated industries like pharmaceuticals and finance.
To Explore Web Developer in Depth, Check Out Our Comprehensive Web Developer Courses To Gain Insights From Our Experts!
Visualization and Reporting Tools
Insights need to be shared effectively for analytics to work, and SAS provides a full set of data visualization and reporting tools. SAS Visual Analytics (VA) is a strong platform that helps users create interactive dashboards, generate dynamic reports, and perform geospatial mapping. It also supports real-time data updates, which helps with timely and informed decisions. SAS offers the Output Delivery System (ODS) for traditional reporting needs, allowing users to create customized reports in various formats such as PDF, Excel, and HTML. SAS also has powerful graphing procedures like PROC SGPLOT and PROC GCHART that are used to create detailed statistical graphics and visual data displays. By encouraging collaboration and ensuring that insights are shared across different teams within an organization, these tools benefit both business users and technical experts.
Industries Using SAS
SAS is trusted by thousands of organizations worldwide. Some key industry applications include:Banking and Financial Services
- Credit scoring and risk modeling
- Anti-money laundering
- Fraud detection
Healthcare and Life Sciences
- Clinical trial analysis
- Patient risk stratification
- Drug development and approval
Retail and E-commerce
- Customer segmentation
- Campaign effectiveness analysis
- Inventory forecasting
Government
- Tax fraud detection
- Public health monitoring
- National security and intelligence
Education
- Student performance prediction
- Curriculum optimization
SAS’s reliability, scalability, and compliance features make it a go-to choice in mission-critical applications.
SAS vs Other Tools (R, Python, etc.)
SAS is often compared with open-source tools like R and Python. Here’s how they stack up:
| Feature | SAS | R | Python |
|---|---|---|---|
| Cost | Paid (commercial) | Free | Free |
| Statistical Analysis | Excellent | Excellent | Good |
| Visualization | Good | Excellent | Excellent | Excellent
| Ease of Learning | Moderate | Steep (for non-coders) | Easy (broadly supported) |
| Support | Dedicated support | Community | Community |
Pros of SAS:
- Stable and secure for enterprise use
- Comprehensive documentation
- Regulatory compliance (e.g., FDA submissions)
- Intuitive GUI for non-coders
Cons of SAS:
- Costly licensing
- Less flexible than Python/R for custom ML
- Smaller open-source ecosystem
Many enterprises use SAS in conjunction with open-source tools, especially with the SAS Viya platform allowing integration via APIs and Jupyter Notebooks.
Certification and Learning Resources
SAS offers a robust certification path that is highly valued by employers. Some top certifications include:
- SAS Certified Specialist: Base Programming
- SAS Certified Advanced Programmer
- SAS Certified Statistical Business Analyst
- SAS Data Scientist on Viya
- SAS Visual Business Analyst
Learning Resources:
- SAS Academy for Data Science
- Coursera and edX SAS Courses
- SAS E-learning and Webinars
- Books: “The Little SAS Book”, “Learning SAS by Example”
- Communities: SAS Support Communities, Stack Overflow
Certifications can greatly improve job prospects, especially in industries like pharma and finance where SAS remains dominant.
Future Outlook for SAS Analytics
By continuously evolving and adopting new technologies, SAS stays relevant and strong, even with increasing competition from open-source tools. One key development is its shift to cloud-native platforms. It is now fully compatible with major cloud providers like AWS, Azure, and Google Cloud Platform. This change offers flexibility and scalability for enterprise analytics. It has also entered the AI and machine learning space. SAS integrates deep learning models and AutoML features to automate complex analytical processes. Additionally, it encourages open-source collaboration by connecting proprietary and open-source ecosystems through powerful APIs. This enables smooth integration with popular programming languages like Python and R. SAS now offers real-time analytics capabilities. This allows businesses to process and analyze streaming or event-driven data as it arrives. This helps meet the growing demand for speed and agility. With these advancements, SAS remains a strong software choice for modern data science and analytics workflows.
Industry Standing:
- SAS is likely to remain dominant in regulated industries.
- Adoption in academia may decline due to cost, but enterprise usage remains high.
- SAS is positioning itself as a hybrid player in both proprietary and open ecosystems.
Organizations with large legacy systems and compliance obligations are expected to continue investing in including What Is SAS Analytics platforms.