Last updated on 17th Jun 2025| 11156
- Definition of Data Analytics
- Types: Descriptive, Diagnostic, Predictive, Prescriptive
- Data Analytics Lifecycle
- Key Tools (Excel, SQL, Python, Tableau)
- Importance of Data Cleaning
- Visualizing and Reporting Insights and Reporting Insights
- Use Cases in Business, Healthcare, Finance
- Career Paths in Data Analytics
- Data Analyst vs Data Scientist
- Certifications in Data Analytics
- Challenges in Data Analytics
- The Future of Data-Driven Decisions
- Conclusion
Definition of Data Analytics
Data analytics is the systematic computational analysis of data or statistics. It involves examining raw data to draw conclusions about the information they contain. Data analytics is used in many industries to allow companies and organizations to make better business decisions and in the sciences to verify or disprove existing models or theories. At its core, data analytics transforms data into actionable insights, helping stakeholders understand trends, patterns, and outliers. Data analytics is a process of analyzing raw data to discover patterns, draw conclusions, and make sound judgments. To arrive at useful conclusions that help in business intelligence and strategic planning, it involves data cleansing, gathering, transforming, and modeling. To turn data into informative information, this practice utilizes a wide range of methods, tools, and procedures. Data analytics incorporates several processes, including data collection, cleaning, transformation, modeling, and visualization. With the massive influx of data in the modern world, the role of data analytics has become crucial in harnessing the power of data to drive innovation, efficiency, and informed decision-making.
Would You Like to Know More About Web Developer? Sign Up For Our Web Developer Courses Now!
Types: Descriptive, Diagnostic, Predictive, Prescriptive
Data analytics can be categorized into four primary types:
- Descriptive Analytics—Focuses on summarizing past data. It answers the question, “What happened?” Common tools include dashboards, reports, and scorecards.
- Diagnostic Analytics—Goes a step further to answer, “Why did it happen?” This involves drilling down into data to discover causes and correlations.
- Predictive Analytics—Uses historical data to forecast future outcomes. Techniques such as machine learning, statistical modeling, and forecasting are used.
- Prescriptive Analytics—Suggests actions to achieve desired outcomes. It recommends decisions using simulation, optimization, and machine learning algorithms.
Data Analytics Lifecycle
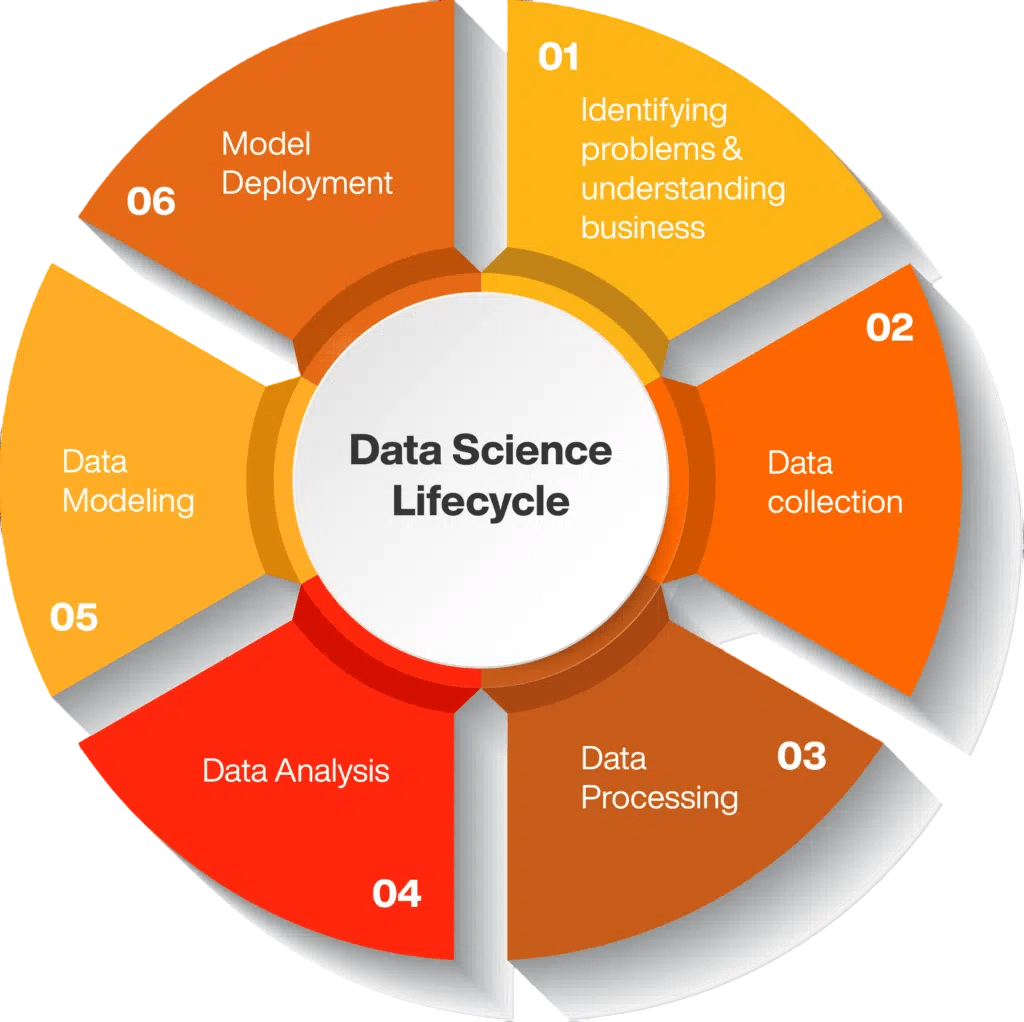
The data analytics lifecycle is a structured process that outlines the phases involved in analyzing data. Raw data is converted into actionable information through an iterative, methodical process known as the Data Analytics Lifecycle. It involves a series of related steps that ensure data is utilized effectively to achieve organizational goals, from problem identification to solution operationalization. The key stages include
- Discovery—Understanding the business problem and defining objectives.
- Data Preparation—Gathering, cleaning, and formatting data for analysis.
- Model Planning—Selecting appropriate analytical techniques and tools.
- Model Building—Creating data models using chosen techniques.
- Evaluation–Assessing model performance and validity.
- Deployment—Implementing the model into business processes.
- Feedback—Monitoring outcomes and refining the model as needed.
Are You Interested in Learning More About Web Developer? Sign Up For Our Web Developer Courses Today!
Key Tools (Excel, SQL, Python, Tableau)
Modern data analytics relies heavily on a variety of tools, each suited for specific tasks:
- Excel—Widely used for basic data analysis, especially for small datasets. Offers formulas, pivot tables, and charting tools.
- SQL (Structured Query Language)—Essential for querying and managing data in relational databases.
- Python–A powerful programming language with libraries like Pandas, NumPy, Matplotlib, and Scikit-learn for data manipulation and machine learning.
- Tableau–A leading visualization tool that helps users create interactive and shareable dashboards.
Importance of Data Cleaning
Data cleaning is a crucial step in the analytics process. It involves identifying and correcting (or removing) errors and inconsistencies in data to improve data quality. Dirty data can lead to incorrect analysis, flawed models, and poor decision-making. Cleaning typically includes. To ensure data quality, accuracy, and usability, cleaning of the data, or data scrubbing or cleansing, is crucial. It involves finding and correcting errors, inconsistencies, and blank spaces in a dataset. Data cleansing enhances decision-making, reduces time, enhances data credibility, and minimizes costs associated with incorrect information.
- Handling missing values
- Removing duplicates
- Correcting data formats
- Filtering outliers
- Standardizing entries Well-cleaned data ensures reliability and accuracy in all downstream analytics processes.
- Business– Customer segmentation, sales forecasting, supply chain optimization.
- Healthcare– Patient diagnostics, treatment effectiveness, hospital resource management.
- Finance– Fraud detection, risk management, credit scoring.
- Marketing– Campaign performance tracking, customer behavior analysis, and A/B testing.
- Retail—Inventory management, product recommendations, pricing strategies.
- Government—Policy planning, crime prediction, resource allocation.
- Data Analyst—Analyzes data and generates insights to inform decisions.To boost productivity and fortify business procedures, business analysts pinpoint areas that require improvement. To share their findings and assist in putting changes into place, they frequently collaborate closely with people at all levels of the organization’s hierarchy.
- Business Analyst—Focuses on business processes and integrates analytics to improve efficiency. In order to increase productivity and strengthen business procedures, business analysts identify areas that need improvement. To report their findings and help implement changes, they often work closely with individuals at all levels in the organization’s hierarchy.
- Data Scientist—Builds models and algorithms for predictive and prescriptive analytics. A data scientist is an expert who employs statistical, computational, and domain knowledge to analyze enormous amounts of data in order to extract meaningful insights and solve complex business problems.
- Data Engineer—Develops and maintains data infrastructure and pipelines. A data engineer designs, builds, and operates the systems that capture, store, and process data for a company in a manner where other groups, like data scientists and analysts, can use and access it.
- Power BI Developer—Creates dashboards and data visualizations.A Power BI developer is an expert in the creation, design, and management of Power BI reports and dashboards to extract meaningful insights from data. To transform raw data into information which is both visually attractive as well as helpful to business stakeholders, they utilize Power BI technology and tools.
- Statistician—Applies statistical theories to interpret data.To comprehend patterns, correlations, and trends in datasets, they apply their knowledge of statistical theory and modeling.
- Google Data Analytics Professional Certificate (Coursera)
- Microsoft Certified: Data Analyst Associate (Power BI)
- Tableau Desktop Specialist
- IBM Data Analyst Professional Certificate
- SAS Certified Specialist: Base Programming
- Data Privacy—Ensuring sensitive information is protected and compliant with regulations.
- Data Silos—Fragmented data across departments hindering unified analysis. Quality Issues—Incomplete, inconsistent, or outdated data affecting accuracy.
- Talent Gap—Shortage of skilled professionals in analytics.
- Changing Technologies—Rapidly evolving tools and methods require continuous learning. Addressing these challenges is crucial to achieving meaningful analytics outcomes.
- AI and Machine Learning—Automating analytics and enabling real-time decision-making.
- Augmented Analytics—Using AI to enhance human analysis with automated insights.
- Edge Analytics—Processing data closer to its source for faster insights.
- Ethical Analytics—Focusing on responsible data use and bias mitigation.
- Self-Service Analytics—Empowering non-technical users to explore data independently. Data-driven decision-making is transitioning from being a competitive advantage to a business necessity.

Develop Your Skills with Web Developer Certification Course
Weekday / Weekend BatchesSee Batch DetailsVisualizing and Reporting Insights
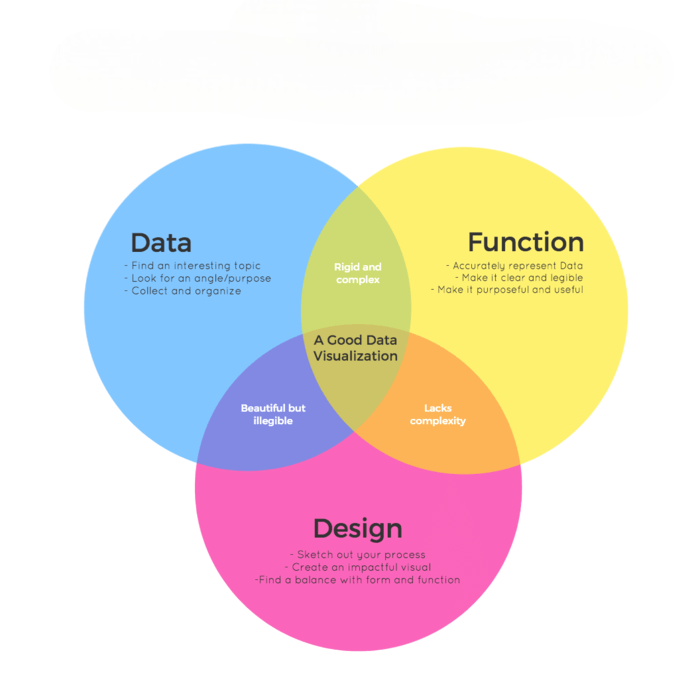
Data visualization is the graphical representation of information and data. By using visual elements like charts, graphs, and maps, data visualization tools make it easier to identify patterns, trends, and outliers. Effective visualization aids in storytelling and supports decision-making by providing a clearer understanding of the data. Reporting transforms raw findings into digestible formats, often through dashboards and summaries. Key performance indicators (KPIs), metrics, and trend analyses are commonly reported to stakeholders to drive strategic and operational decisions.
Do You Want to Learn More About Web Developer? Get Info From Our Web Developer Courses Today!
Use Cases in Business, Healthcare, Finance
Data analytics has numerous applications across sectors:
Career Paths in Data Analytics
Professionals in data analytics enjoy a wide range of career opportunities. Common roles include:
Data Analyst vs Data Scientist
While both roles are centered around data, their focus and skill sets differ:
| Feature | Data Analyst | Data Scientist |
|---|---|---|
| Focus | Interpreting existing data | Building models and predictions |
| Tools | Excel, SQL, Tableau | Python, R, Machine Learning libraries |
| Outcome | Reports and dashboards | Algorithms and automation |
| Education | Bachelor’s degree | Often advanced degrees (MS, PhD) |
Certifications in Data Analytics
Certifications help validate analytical skills and increase employability. Some widely recognized certifications include
Challenges in Data Analytics
Despite its advantages, data analytics faces several challenges:
The Future of Data-Driven Decisions
As technology advances, data analytics will play an even more pivotal role in decision-making. Key future trends include:
Conclusion
Data analytics is an essential discipline in today’s digital economy. From understanding customer behavior to predicting future trends, data analytics empowers organizations to make informed, strategic decisions. As the volume of data continues to grow, so does the importance of analytics. Whether through certifications, hands-on training, or advanced degrees, investing in data analytics skills is a smart move for professionals and organizations alike. With the right tools, mindset, and infrastructure, data analytics can unlock vast potential and drive transformative growth. By extracting meaningful information from data, data analytics allows companies to make informed choices that lead to better customer experiences, improved business efficiency, and a competitive edge. It is critical across most fields, such as business, medicine, and crime control, because it allows companies to identify patterns, solve problems, and predict future outcomes. Companies have to embrace data-driven approaches to stay competitive in this constantly changing field, which is being influenced by big data and artificial intelligence.