Last updated on 23rd May 2025| 9902
- Introduction to Nominal Data
- Difference Between Nominal and Ordinal Data
- Characteristics of Nominal Data
- Examples of Nominal Data in Real Life
- Nominal vs Interval and Ratio Data
- Encoding Nominal Data for Machine Learning (One-Hot Encoding)
- Statistical Tests for Nominal Data
- Visualizing Nominal Data (Bar Charts, Pie Charts)
- Handling Nominal Data in Python (Pandas, Scikit-Learn)
- Importance of Nominal Data in Data Science
- Common Challenges with Nominal Data
- Future Trends in Categorical Data Analysis
- Conclusion
Introduction to Nominal Data
Nominal data is a foundational category within categorical data, extensively applied in statistics, data science, and a variety of industry-specific analytics. It comprises labels or names that distinguish items or groups without any inherent ranking or measurable value, setting it apart from numerical data, which conveys quantities. Common examples include gender, nationality, colors, and product categories, each serving to classify or organize data without implying any order. This type of data is pivotal in structuring datasets for analysis, especially in applications involving data analytics, artificial intelligence, and machine learning. As part of comprehensive Data Science Training understanding how to preprocess nominal data using techniques like one-hot encoding or label encoding is essential for accurate model training and deeper analytical insight. Effective visualization through bar charts, pie charts, and frequency tables further enhances comprehension of category distributions, helping stakeholders make informed decisions. Moreover, as AI and machine learning technologies continue to advance, they are increasingly capable of handling nominal data with greater sophistication, enabling improved predictions and strategic planning. Understanding the characteristics, challenges, and evolving methodologies for analyzing nominal data is essential for leveraging its full potential in today’s data-driven environments.
Would You Like to Know More About Data Science? Sign Up For Our Data Science Course Training Now!
Difference Between Nominal and Ordinal Data
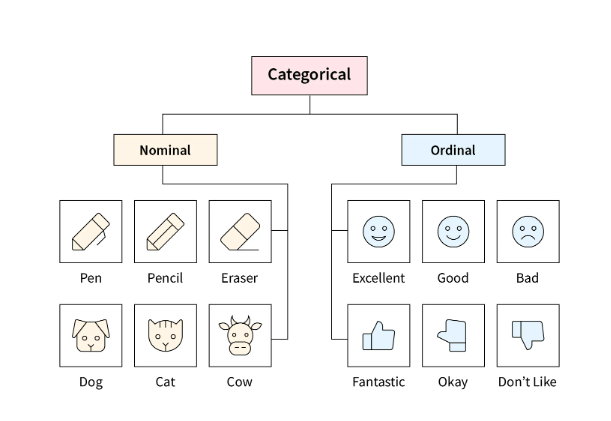
Categorical data can be broadly classified into two types: nominal data and ordinal data.
- Nominal Data: Represents categories without any inherent order (e.g., colors, countries, product brands). There is no logical sequence or ranking among these categories.
- Ordinal Data: Represents categories that have a meaningful order but no fixed numerical difference between them (e.g., education levels, survey responses like “poor,” “average,” “good”).
While both types of data are qualitative, ordinal data has a level of ranking, whereas nominal data does not. This distinction is essential when choosing appropriate statistical tests and encoding techniques for machine learning models.
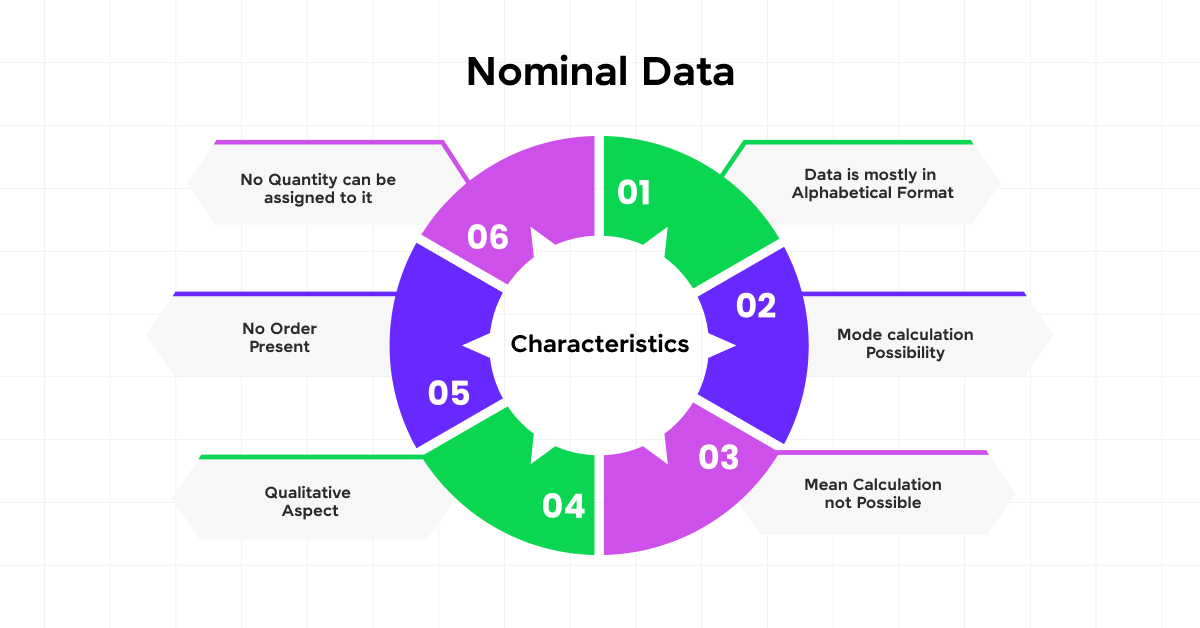
Characteristics of Nominal Data
Nominal data is defined by several key characteristics that shape how it is managed, analyzed, and interpreted across various fields. It is inherently categorical in nature, consisting of discrete labels or names that hold no numerical value, serving solely as identifiers for classification purposes. These categories have no intrinsic order, meaning there is no logical sequence or hierarchy among them; one category is not greater or lesser than another. A fundamental aspect of nominal data is mutual exclusivity, where each category is clearly distinct, and any given entity can belong to only one category at a time, eliminating overlap. Unlike numerical data types, nominal data does not support arithmetic operations; processes such as addition, subtraction, or averaging are meaningless in this context because the data lacks any quantitative interpretation. This makes nominal data particularly suited for classification tasks and clustering problems, where the goal is to group or differentiate entities based on shared characteristics rather than numerical relationships. As seen in applications of Artificial Intelligence in India these defining traits significantly influence how nominal data is processed and visualized bar charts and frequency tables are preferred over plots requiring numerical scales and determine the types of statistical techniques and models that can be effectively applied. Proper recognition and handling of these characteristics are essential for ensuring accurate data interpretation, meaningful comparisons, and reliable outcomes in both academic research and practical data applications.
Examples of Nominal Data in Real Life
Nominal data appears in various domains, including:
- Personal Identification: Names, nationalities, genders, social security numbers.
- Retail and Marketing: Product categories, brand names, store locations.
- Healthcare: Blood types, disease classifications, hospital departments.
- Education: Course names, university names, and subject categories.
- Sports: Team names, player positions, tournament categories.
Recognizing these examples helps in designing better data-driven models and strategies across industries.
Do You Want to Learn More About Data Science? Get Info From Our Data Science Course Training Today!
Nominal vs Interval and Ratio Data
Apart from nominal and ordinal data, there are two other types of data: interval and ratio data.
| Data Type | Definition | Example |
|---|---|---|
| Nominal | Categories without order | Colors (red, blue, green) |
| Ordinal | Ordered categories | Education levels (high school, college) |
| Interval | Ordered with meaningful differences, but no true zero | Temperature in Celsius |
| Ratio | Ordered, meaningful differences, with a true zero | Weight, height, income |
While nominal data lacks order, interval and ratio data involve numerical values where meaningful calculations can be performed.
Encoding Nominal Data for Machine Learning (One-Hot Encoding)
Machine learning algorithms are designed to process numerical input, which makes the conversion of nominal data into numerical form a necessary step in data preprocessing. Since nominal data consists of categories without any inherent numerical value or order, encoding techniques are employed to translate these categories into a machine-readable format. One of the most widely used methods is one-hot encoding, which transforms each category into a binary vector. For example, if the categories are “red,” “blue,” and “green,” one-hot encoding would represent them as [1,0,0], [0,1,0], and [0,0,1] respectively. This technique ensures that the algorithm treats all categories as equally distinct, without implying any ordinal relationship among them. Another popular method is label encoding, where each category is assigned a unique numerical value such as “cat” = 0, “dog” = 1, and “rabbit” = 2. While label encoding is straightforward and memory-efficient, it can unintentionally introduce a sense of ranking or order, which may mislead certain algorithms. Binary encoding offers an alternative approach by converting categories into binary representations, such as A = 01 and B = 10. This method reduces the dimensionality that arises with one-hot encoding, making it more efficient for datasets with high-cardinality categorical variables. In fields like Artificial Intelligence in Banking choosing the right encoding method is especially critical, as it directly impacts model accuracy, performance, and the overall reliability of the predictive outcomes. Among these techniques, one-hot encoding remains the preferred choice for nominal data because it eliminates the risk of implying a hierarchy or sequence that doesn’t actually exist.

Statistical Tests for Nominal Data
Nominal data requires specialized statistical tests, such as:
- Chi-Square Test: Evaluates relationships between two categorical variables.
- Fisher’s Exact Test: Used for small sample sizes to determine independence.
- Cramer’s V: Measures the strength of association between nominal variables.
- Mode Analysis: Identifies the most frequently occurring category.
These tests help analyze patterns, dependencies, and significance in categorical datasets.
Want to Pursue a Data Science Master’s Degree? Enroll For Data Science Masters Course Today!
Visualizing Nominal Data (Bar Charts, Pie Charts)
Nominal data, due to its categorical nature and lack of inherent numerical value, is best represented through specific types of visualizations that clearly depict the frequency and distribution of categories. Bar charts are one of the most effective tools for this purpose, as they display frequency counts of each category, making it easy to compare the prevalence of different labels within a dataset. Pie charts offer another common approach, visually illustrating the proportions of categories as segments of a circle, which is useful for showing how each category contributes to the whole. Count plots, similar to bar charts, are frequently used in data analysis to show the distribution of categorical variables, often enhanced with additional features like hue for subgroup comparisons. Stacked bar charts allow for even more detailed comparisons by displaying multiple categorical variables in a single bar, broken into segments that reflect subcategories, thus facilitating a multidimensional understanding of the data. These visualization techniques are essential for interpreting nominal data effectively, as they make patterns and trends in category distributions more accessible and understandable. In the context of What is Statistical Analysis selecting the right visual format helps analysts gain clearer insights, detect imbalances or anomalies, and communicate findings more efficiently to stakeholders, ultimately improving the quality of data-driven decisions.
Handling Nominal Data in Python (Pandas, Scikit-Learn)
Python provides efficient tools for managing nominal data:
Using Pandas for Encoding:- import pandas as pd
- df = pd.DataFrame({‘Color’: [‘Red’, ‘Blue’, ‘Green’]})
- df_encoded = pd.get_dummies(df[‘Color’])
- print(df_encoded)
- from sklearn.preprocessing import LabelEncoder
- le = LabelEncoder()
- df[‘Color_Encoded’] = le.fit_transform(df[‘Color’])
- print(df)
These approaches convert categorical data into numerical representations suitable for machine learning.
Importance of Nominal Data in Data Science
Nominal data plays a crucial role in a wide range of practical applications across different fields, serving as a foundation for organizing and interpreting non-numeric information. In classification tasks, it is essential for building models used in fraud detection, customer segmentation, and text categorization, where the goal is to assign inputs to predefined categories based on their characteristics. In survey analysis, nominal data is widely used to interpret responses, especially in market research and the social sciences, where participants’ answers often fall into labeled categories such as preferences, demographics, or opinions. In the medical field, nominal data is instrumental in categorizing diseases, treatment types, and genetic markers, enabling healthcare professionals to organize patient information and tailor diagnostic or therapeutic approaches based on categorical identifiers. As explored in Data Science Training recommendation systems also rely heavily on nominal data, using it to classify items like movies, products, or user preferences in order to generate personalized suggestions. Across all these domains, the ability to accurately process and analyze nominal data supports better decision-making, enhances model precision, and contributes to a deeper understanding of categorical relationships within datasets.
Common Challenges with Nominal Data
Challenges include:
- High Cardinality: Large numbers of unique categories increase dimensionality.
- Encoding Issues: Improper encoding can introduce bias.
- Data Imbalance: Unequal category distributions can distort predictions.
- Interpretability: Visualizing and drawing insights can be complex.
Future Trends in Categorical Data Analysis
Recent developments in data science have significantly expanded the ways in which nominal data can be analyzed and utilized, particularly through the integration of more sophisticated computational techniques. Automated feature engineering has emerged as a powerful tool, with advanced platforms now capable of automatically encoding categorical features, reducing the manual effort and improving model efficiency. In the realm of deep learning, innovative embedding techniques have been developed to handle categorical data more effectively, allowing models to learn complex relationships between categories in a dense, continuous vector space rather than relying on traditional encoding methods. Explainable AI (XAI) is also gaining traction, focusing on improving the interpretability of machine learning models that incorporate nominal data, thereby helping stakeholders understand how categorical inputs influence predictions and decisions. Another exciting trend is graph-based categorical analysis, where data is represented through network structures to uncover relationships and patterns that might be missed with conventional methods. As explored in What is Data Architecture these advancements collectively enhance the analytical power of models that utilize nominal data, leading to more accurate, transparent, and insightful outcomes in a wide range of applications.
Conclusion
Nominal data is a fundamental type of categorical data, widely utilized across industries such as healthcare, marketing, and education due to its ability to classify information into distinct, non-ordered categories like gender, product type, or hair color. These categories serve a labeling purpose without implying any quantitative or ordinal value. Key characteristics of nominal data include mutual exclusivity and collective exhaustiveness, ensuring that each data point belongs to one clearly defined category. Although it cannot be analyzed using standard mathematical operations, nominal data can be prepared for computational use through encoding methods such as one-hot and label encoding, with one-hot encoding being particularly suitable as it prevents any unintended ordinal associations. Through Data Science Training professionals can learn how to effectively apply these encoding techniques and leverage visualization tools such as bar charts, pie charts, and frequency tables to uncover patterns and category distributions within nominal datasets. While nominal data presents certain analytical limitations, ongoing advancements in artificial intelligence and machine learning have significantly improved how this data type is processed and interpreted. These technologies now allow for more sophisticated handling of nominal variables in complex models, enhancing predictive accuracy and enabling more informed decision-making. As a result, the importance of nominal data in real-world applications continues to grow, highlighting its enduring value in the evolving landscape of data science.