Last updated on 30th Apr 2025| 10171
- Introduction to Value Stream Mapping
- Importance in Process Improvement
- Key Components of VSM
- Creating a Value Stream Map
- Identifying Waste and Bottlenecks
- Implementing Improvements
- Measuring Efficiency Gains
- Tools and Software for VSM
Introduction to Value Stream Mapping
Value Stream Mapping (VSM) is a powerful tool for visualizing, analyzing, and optimizing the flow of materials and information required to deliver a product or service to customers. Originating from Toyota’s Lean Manufacturing methodology, VSM has been widely adopted across various industries, including manufacturing, healthcare, logistics, software development, and the service sector. It provides a visual representation of the entire process, from the receipt of raw materials or initiation of services to final delivery, showing each step in sequence, which can be further optimized with Data Science Training. VSM is crucial for identifying and eliminating waste, redundancies, and inefficiencies in processes. By mapping out the current state of a process and envisioning the future state, organizations can pinpoint areas for improvement, streamline workflows, reduce cycle times, and enhance overall efficiency. This leads to higher quality, faster delivery, and improved customer satisfaction. The use of VSM facilitates continuous improvement by offering a clear, structured approach for operational excellence. By understanding the value stream, organizations can create a roadmap for optimizing processes, driving productivity, and achieving long-term success.
Interested in Obtaining Your Data Science Certificate? View The Data Science Course Training Offered By ACTE Right Now!
Importance in Process Improvement
Value Stream Mapping (VSM) plays a critical role in improving organizational processes by identifying and addressing inefficiencies. One of its key strengths is the identification of waste, such as unnecessary waiting times, overproduction, excessive transportation, and bottlenecks that hinder workflow. By mapping the current state of processes, VSM helps organizations pinpoint inefficiencies and re-engineer processes to eliminate waste, thereby maximizing flow and enhancing overall efficiency, much like managing the Sprint Backlog in Agile to prioritize tasks effectively. VSM also fosters collaboration across functions by providing a common visual representation of the entire process, encouraging stakeholders to work together toward shared objectives. This collaboration leads to better alignment and faster problem-solving. As a result, customer satisfaction improves because companies can eliminate inefficiencies, reduce lead times, enhance product/service quality, and deliver faster.
Additionally, VSM serves as a foundation for continuous improvement efforts, such as Lean and Six Sigma, ensuring ongoing progress. By optimizing processes, VSM helps organizations lower costs, streamline resource utilization, and ultimately improve profitability. This combination of waste reduction, process efficiency, and collaboration drives long-term success and operational excellence.
Key Components of VSM
- Kaizen Bursts: These symbols indicate opportunities for improvement or areas where problem-solving activities can be implemented to enhance process efficiency.
- Process Boxes: These represent individual steps where specific activities occur, such as manufacturing, inspection, transportation, or service provision. They help visualize each part of the workflow.
- Material Flow: This shows the movement of materials through the process, highlighting efficiency, enhanced by Master Data Visualization and Storytelling Techniques.
- Information Flow: Represents communication channels like orders, schedules, and feedback loops that control the process. This is essential for coordination and ensuring that all steps are aligned with customer requirements.
- Inventory and Wait Times: This section highlights buffer stocks, work-in-progress (WIP), and waiting times between process steps. It helps identify bottlenecks, excessive inventory, or unnecessary delays that affect overall performance.
- Timeline and Metrics: The time it takes to complete a single task or process step. The total time from the start to the end of the process. The rate at which products need to be manufactured to meet customer demand.
- Define the Scope: Start by identifying the boundaries of the process you want to map, including the start and end points. This could range from receiving raw materials to the final product delivery.
- Identify Key Process Steps: List all the major activities or steps in the process, such as manufacturing, inspection, packaging, and transportation. Represent these with process boxes.
- Map Material Flow: Draw arrows to show the flow of goods, similar to how the Best Certifications for Project Managers Career guide process management.
- Map Information Flow: Identify how information, such as orders, schedules, or instructions, flows between different process steps. This is crucial for coordinating activities.
- Track Inventory and Wait Times: Indicate where inventory is stored and where work-in-progress (WIP) accumulates. Also, show wait times between process steps to spot inefficiencies.
- Measure Key Metrics: Add performance indicators such as Cycle Time (CT), Lead Time (LT), and Takt Time to understand process efficiency and areas for improvement.
- Identify Improvement Opportunities: Use Kaizen Bursts to mark areas where inefficiencies or waste exist. This helps highlight opportunities for process optimization and improvement.
- Analyze Root Causes: Start by using techniques like root cause analysis or fishbone diagrams to identify the underlying issues causing inefficiencies, waste, or bottlenecks in the process.
- Prioritize Improvements: Once the root causes are identified, prioritize the changes based on impact and feasibility. Focus on improvements that will offer the most significant benefits in terms of efficiency, cost savings, and customer satisfaction.
- Develop a Plan: Create an implementation plan with steps, responsibilities, timeline, and resources, aligning with Product-Market Fit The Secret to Business Growth.
- Engage Employees: Involve employees at all levels in the improvement process. Their insights and commitment are essential for successfully implementing changes and ensuring long-term sustainability.
- Pilot the Changes: Before full implementation, test improvements on a small scale to measure their impact. This helps identify potential issues and make necessary adjustments.
- Monitor and Measure: Use key performance indicators (KPIs) to track the success of the changes. Monitor metrics like cycle time, lead time, and quality to ensure improvements are effective.
- Sustain Improvements: Implement control mechanisms, such as regular audits and continuous monitoring, to ensure that improvements are maintained and further opportunities for optimization are identified.
To Earn Your Data Science Certification, Gain Insights From Leading Data Science Experts And Advance Your Career With ACTE’s Data Science Course Training Today!
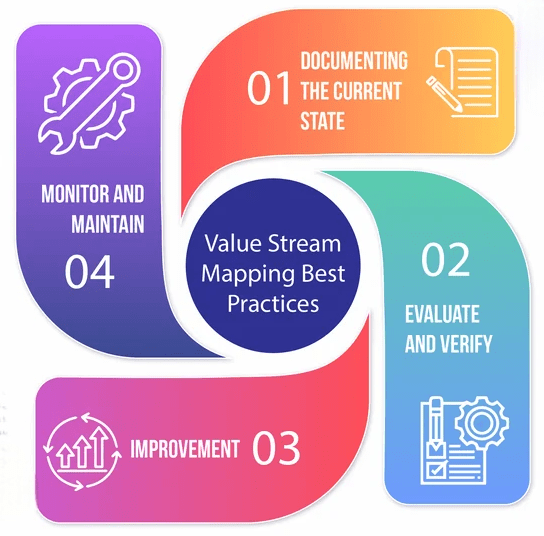
Creating a Value Stream Map

Identifying Waste and Bottlenecks
Identifying waste and bottlenecks is a critical part of process optimization, particularly in Lean and Six Sigma methodologies. Waste refers to any activity that does not add value to the customer, such as excessive inventory, unnecessary transportation, waiting times, defects, overproduction, and unused talent. By closely analyzing the value stream and process flows, organizations can spot these non-value-added activities and eliminate or reduce them. On the other hand, bottlenecks are specific points in a process where work slows down due to limitations in capacity, resources, or inefficiencies, which can be identified and addressed through Data Science Training. These bottlenecks cause delays and reduce the overall throughput of the process. Identifying bottlenecks involves tracking key metrics like cycle times, lead times, and work-in-progress inventory. Once waste and bottlenecks are identified, solutions can be implemented, such as redistributing resources, eliminating unnecessary steps, or optimizing workflows. This leads to increased efficiency, reduced costs, and enhanced customer satisfaction by streamlining processes and improving flow. Identifying and addressing waste and bottlenecks is essential for continuous improvement and operational excellence.
Want to Pursue a Data Science Master’s Degree? Enroll For Data Science Masters Course Today!
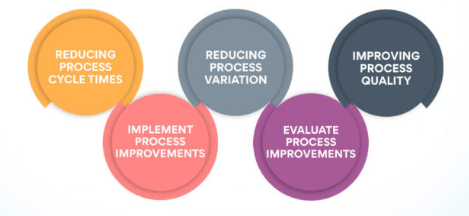
Implementing Improvements
Measuring Efficiency Gains
To measure the effectiveness of Value Stream Mapping (VSM), organizations track several key efficiency indicators. Lead Time (LT) is a primary metric, reflecting the total process time from start to finish. A reduction in lead time indicates improved process efficiency and quicker product or service delivery. Cycle Time (CT) measures the time taken to complete individual steps in the process. By reducing cycle time, organizations can streamline operations and increase throughput. Waste Reduction is another crucial indicator, as VSM identifies and eliminates non-value-added activities such as excessive inventory, unnecessary transport, and waiting times, which directly improves efficiency and aids in Resource Allocation. Throughput measures the increased output achieved with the same or fewer resources. Higher throughput indicates better utilization of resources and more efficient workflows. Cost Savings are tracked by analyzing reductions in labor, inventory, and operational costs, all of which contribute to greater financial efficiency. Finally, Customer Satisfaction is a key outcome of VSM, as improvements in delivery times and service quality enhance the overall customer experience, leading to stronger customer loyalty. These efficiency indicators collectively demonstrate the positive impact of VSM on operational performance.
Preparing for a Data Science Job Interview? Check Out Our Blog on Data Science Interview Questions & Answer
Tools and Software for VSM
There are various tools and software available to assist in creating and analyzing Value Stream Maps (VSM). Traditional tools, such as paper-based diagrams and manual drawing, remain popular, especially in lean environments, where teams can quickly sketch out the current and future state maps. However, for more complex processes, digital tools provide better efficiency and accuracy. Microsoft Visio is a commonly used software for VSM, offering templates and shapes for creating process flow diagrams. Another popular tool is Lucidchart, an online platform that enables real-time collaboration and easy integration with other business tools, especially when combined with Data Science Training for enhanced data visualization and analysis. For those seeking specialized features, iGrafx and LeanKit offer advanced VSM capabilities, including process simulation, performance tracking, and integration with other Lean or Six Sigma methods. Minitab, primarily a statistical software, also offers VSM templates and can be used to analyze data and perform root cause analysis. Additionally, VSM apps such as Value Stream Mapping Tool and ProcessMaker are available, designed specifically for process mapping and workflow optimization. These tools and software simplify the VSM process, ensuring teams can identify inefficiencies and drive continuous improvement more effectively.