Last updated on 18th Jun 2025| 10264
- Introduction SAS and R Overview
- Licensing and Cost
- Learning Curve and Accessibility
- Data Handling and Processing
- Statistical Capabilities Comparison
- Visualization Strengths
- Customization and Extensibility
- Community Support and Resources
Introduction SAS and R Overview
SAS (Statistical Analysis System) and R are two powerful tools widely used in the fields of data analysis, statistical modeling, and data science. SAS is a commercial software suite developed by SAS Institute, known for its robust data handling capabilities, advanced analytics, and strong support for enterprise-level applications, especially in industries like healthcare, finance, and government. It offers a user-friendly interface, extensive documentation, and reliable technical support, making it ideal for large organizations with structured data needs. In contrast, R is an open-source programming language and environment that excels in statistical computing, data visualization, and Data Science training Developed by statisticians, R provides a vast ecosystem of packages contributed by its active community, enabling users to perform cutting-edge statistical techniques and create sophisticated graphics. While SAS emphasizes stability, scalability, and compliance, R offers flexibility, innovation, and cost-effectiveness. Both tools have unique strengths: SAS is often preferred in regulated environments due to its validated processes, whereas R is favored in academic and research settings for its adaptability and extensive libraries. Understanding both SAS and R equips data professionals with the versatility to choose the most appropriate tool based on project requirements, data complexity, and organizational needs. This overview sets the foundation for exploring their capabilities in greater detail.
Would You Like to Know More About Data Science? Sign Up For Our Data Science Course Training Now!
Licensing and Cost
- SAS Licensing Model: SAS operates on a commercial licensing model, where users must purchase licenses for individual modules or enterprise-wide access. The cost can be high, making it more suitable for large organizations with significant budgets for software and support.
- Subscription-Based Pricing: SAS offers subscription-based pricing, which provides flexibility for users to pay for the services they need on an annual basis. This model is often preferred by businesses looking to scale or adjust their needs over time, especially when considering the most valuable data science skills to learn.
- Free and Open-Source R: In stark contrast, R is free and open-source, meaning that anyone can download, use, and modify it without any associated licensing fees. This makes R a popular choice for academics, researchers, and small businesses with limited budgets.
When considering the use of SAS and R, one of the key factors to evaluate is the licensing and associated costs. These two tools offer very different pricing models, each catering to specific user needs and organizational preferences.
- Support Costs for R: While R itself is free, users may need to pay for third-party support services or specialized packages for advanced analytics, which could add to the overall cost.
- Enterprise Support for SAS: SAS offers comprehensive customer support, training, and documentation, but these services come at an additional cost. For organizations, this level of support is often seen as a major benefit in comparison to other software options.
- Total Cost of Ownership: While SAS can be expensive upfront, its robust capabilities and support network can justify the cost for large enterprises. In comparison, R’s low cost makes it highly attractive for smaller projects and academic work, though users must manage support and maintenance independently.
Learning Curve and Accessibility
- Ease of Use for New Users: A smooth learning curve means that users, especially beginners, can quickly understand how to use a system without feeling overwhelmed. Platforms designed with a low learning curve offer intuitive interfaces that help reduce the initial friction for users.
- Adaptability to Different Skill Levels: Tools with varying levels of complexity can cater to both novice and expert users. A good design allows users to grow in their skills over time, offering advanced features as their familiarity with the system increases.
- Inclusive Design for Accessibility:Accessibility features, such as screen readers, voice commands, and customizable text sizes, are crucial for individuals with disabilities. Tools that account for these needs provide equal opportunities for all users to learn and use the platform effectively, supporting a diverse range of individuals on their Data Science Career Path
- Feedback and Support Systems: Comprehensive help systems, tutorials, and in-app guidance ease the learning process. Support systems like FAQs, chatbots, or human assistance ensure that users can get help when encountering obstacles, making the system more accessible.
- Consistency and Predictability: A consistent design allows users to easily predict how different parts of the system function. This predictability helps decrease the cognitive load, making it easier to learn and use the system with fewer errors.
- Cross-Platform Accessibility: Accessibility across different devices and operating systems ensures that users can access tools from their preferred devices. Whether on a mobile phone, desktop, or tablet, accessibility across platforms ensures a more inclusive user experience.
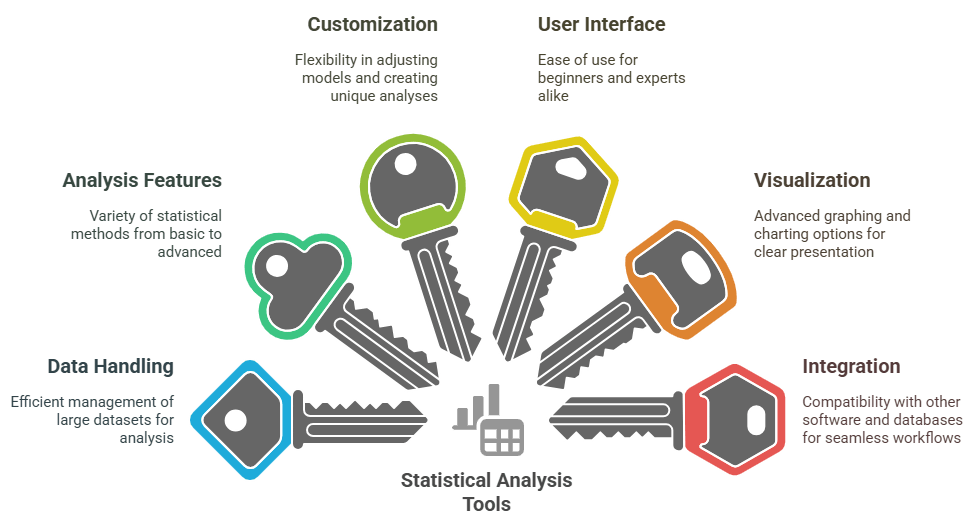
- Data Handling and Management: Some tools excel in managing large datasets, while others might struggle with big data. The ability to import, clean, and organize data efficiently is crucial for any statistical analysis.
- Analysis Features and Techniques: Statistical software may offer a variety of analysis methods, from basic descriptive statistics to more advanced techniques like regression analysis, ANOVA, and machine learning. A comparison should highlight which tools support the techniques you need.
- Customization and Flexibility: Advanced users often require flexibility in customizing their models or creating unique analyses. Some tools allow extensive scripting and parameter adjustments, while others may be more rigid in functionality, especially in the context of Data Science training
- User Interface and Ease of Use: The complexity of the user interface can significantly affect how quickly users can perform statistical tasks. Tools with a user-friendly interface may appeal to beginners, while more complex platforms might be suited for experts.
- Visualization Capabilities: Effective data visualization is an important part of statistical analysis. Some tools provide advanced graphing and charting options to present results in a more comprehensible and visually appealing way.
- Integration and Compatibility: The ability to integrate with other software or databases is vital for seamless data analysis workflows. Tools that support popular programming languages (like R or Python) and are compatible with other platforms may offer greater flexibility in complex analyses.
The learning curve refers to the rate at which a person learns a new skill or task over time. In the context of technology, tools, or software, the learning curve can significantly impact how easily users can start utilizing a system. Accessibility, on the other hand, ensures that all users, regardless of their abilities, can use these tools efficiently. When combined, these two concepts influence the effectiveness of any platform or tool, especially in diverse user environments. Here are six points that detail the importance of the learning curve and accessibility:
Want to Pursue a Data Science Master’s Degree? Enroll For Data Science Masters Course Today!
Data Handling and Processing
Data handling and processing involve the collection, storage, organization, and transformation of raw data into meaningful insights. This process is essential in various industries to support decision-making, forecasting, and analysis. The first step in data handling is gathering data from multiple sources, which could include databases, sensors, or online platforms. Once collected, data needs to be cleaned and organized to ensure accuracy, as raw data often contains inconsistencies, duplicates, or irrelevant information. This is a key step in What Does a Data Scientist Do And How they transform raw data into actionable insights. After cleaning, the next stage is processing, which includes tasks like data transformation, aggregation, and analysis. Tools such as algorithms, statistical models, and machine learning techniques are used to extract valuable information and patterns. Data processing can be done in real-time or in batches, depending on the application. Effective data handling and processing also involve ensuring data security, privacy, and compliance with legal standards. Moreover, scalability is important, as data volumes can grow rapidly, requiring systems that can handle large datasets efficiently. In the age of big data, organizations rely on advanced technologies such as cloud computing, distributed processing, and automation to manage and process vast amounts of information, ultimately enabling them to make informed decisions, optimize operations, and enhance business outcomes.

Statistical Capabilities Comparison
When evaluating tools or software for statistical analysis, it’s essential to compare their capabilities to ensure they meet the specific needs of the user. Different platforms may offer a range of features, including data manipulation, statistical modeling, and visualization, each catering to different types of analysis. A thorough comparison of these capabilities allows users to choose the best tool based on factors like ease of use, flexibility, and computational power.
Visualization Strengths
Visualization plays a crucial role in data analysis, transforming raw numbers into meaningful insights through graphical representation. The strength of visualization tools lies in their ability to present complex data in a more digestible, intuitive format, enabling users to quickly identify patterns, trends, and outliers. Effective visualization tools offer a range of features, such as interactive charts, customizable graphs, and heatmaps, which help in communicating data findings clearly to both technical and non-technical audiences, making them an essential part of an R certification overview. The ability to create visually appealing dashboards that provide real-time insights is another strength, allowing for dynamic and efficient decision-making. Furthermore, advanced visualization tools support various types of visual representations, including scatter plots, histograms, line graphs, and geographical maps, to cater to different types of data and analysis needs. These tools also enhance the exploration of data by enabling drill-down features, where users can zoom in on specific segments or categories for deeper analysis. Another important strength is their compatibility with data transformation and filtering, allowing users to manipulate datasets and instantly see the impact on the visualizations. Overall, visualization tools enhance understanding, improve communication, and facilitate data-driven decisions, making them an essential component in any analytical process.
Customization and Extensibility
Customization and extensibility are critical features for any tool or platform, especially when catering to the diverse needs of users across different industries and fields. Customization allows users to tailor the software or system to their specific requirements, whether it’s adjusting user interfaces, modifying default settings, or creating personalized workflows. This flexibility ensures that the tool fits the unique processes and preferences of individual users or organizations. Extensibility goes a step further, enabling the integration of third-party plugins, add-ons, or custom scripts to enhance functionality, which is a key aspect of What is Data Analytics is all about. This is particularly important in fields like data analysis, software development, or enterprise solutions, where additional features or specialized capabilities might be required over time. Platforms with strong extensibility support can adapt to evolving needs, allowing users to introduce new features or adapt the tool as technologies and methodologies change. Whether through APIs, custom modules, or scripting languages, extensibility ensures that users aren’t limited by the out-of-the-box capabilities but can build and scale according to their specific goals. The combination of customization and extensibility empowers users to create a more efficient, personalized, and future-proof experience, making these features essential for long-term satisfaction and success in any software or platform.
Go Through These Data Science Interview Questions & Answer to Excel in Your Upcoming Interview.
Community Support and Resources
Community support and resources play an invaluable role in the overall user experience of any software or platform. A strong community fosters collaboration, knowledge-sharing, and troubleshooting among users, which is essential for both beginners and experienced professionals. Community-driven forums, online groups, and discussion platforms allow users to ask questions, share solutions, and provide feedback, creating a collaborative environment where everyone can learn. Additionally, the availability of resources like tutorials, documentation, webinars, and user guides is crucial for empowering users to fully understand and utilize the platform. These resources ensure that users have access to step-by-step instructions and best practices, reducing the learning curve and minimizing obstacles, especially in Data Science training Furthermore, a vibrant community often leads to the development of open-source contributions, plugins, or extensions, which enhance the functionality of the platform. Regular updates, FAQs, and active customer support also contribute to an overall positive user experience. The more robust and engaged the community, the greater the support and opportunities for users to get the most out of their tools. In this way, community support and resources not only help users solve immediate problems but also foster a long-term relationship with the platform, ensuring continuous growth and improvement.