Last updated on 21st May 2025| 9999
- Introduction to Hierarchical Clustering
- Difference Between Agglomerative and Divisive Clustering
- Importance of Hierarchical Clustering in ML
- Dendrograms in Hierarchical Clustering
- Linkage Methods: Single, Complete, Average
- Implementing Hierarchical Clustering in Python
- Visualizing Hierarchical Clustering Results
- Applications of Hierarchical Clustering
Introduction to Hierarchical Clustering
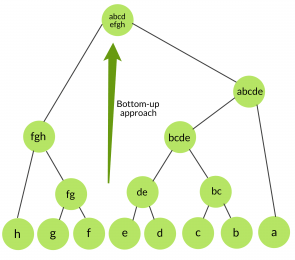
Hierarchical clustering is an unsupervised machine learning technique used to group similar data points into clusters based on their distance or similarity. Unlike other clustering methods, hierarchical clustering builds a hierarchy of clusters in the form of a tree-like structure called a dendrogram. This approach does not require the user to predefine the number of clusters, making it especially useful for exploratory data analysis. There are two main types of hierarchical clustering: agglomerative and divisive. Agglomerative clustering is a bottom-up approach where each data point starts in its own cluster, and pairs of clusters are merged as one moves up the hierarchy a technique often covered in Data Science Training. Divisive clustering, on the other hand, takes a top-down approach, starting with all data in one cluster and recursively splitting it. The similarity or distance between clusters is typically measured using metrics like Euclidean distance, and linkage methods such as single, complete, average, or Ward’s linkage determine how clusters are joined or split. Hierarchical clustering is widely used in fields such as bioinformatics, marketing segmentation, and social network analysis. The resulting dendrogram provides a visual representation of the cluster structure, allowing users to choose the optimal number of clusters based on the level of granularity desired.
Interested in Obtaining Your Data Science Certificate? View The Data Science Course Training Offered By ACTE Right Now!
Difference Between Agglomerative and Divisive Clustering
Agglomerative and divisive clustering are two fundamental approaches in hierarchical clustering, each differing in how they construct the cluster hierarchy. Agglomerative clustering follows a bottom-up strategy. It begins by treating each data point as its own individual cluster. These clusters are then merged step by step based on a chosen distance metric and linkage criterion, gradually forming larger clusters until all data points belong to a single cluster or until a stopping condition is met, similar to how Top Excel AI Tools for Smarter Data Analysis streamline the process. This method is more commonly used in practice due to its simplicity and efficiency in handling small to medium-sized datasets. In contrast, divisive clustering employs a top-down approach.
It starts with the entire dataset as one large cluster and progressively splits it into smaller clusters. At each step, the algorithm identifies the best way to divide a cluster based on dissimilarity measures, continuing the process until each data point is in its own cluster or a predefined number of clusters is reached. While divisive clustering can produce more balanced clusters, it is computationally more intensive and less frequently used. The choice between these methods depends on the nature of the data, computational resources, and the specific goals of the clustering task.
Importance of Hierarchical Clustering in ML
- Unsupervised Learning: Hierarchical clustering is a popular unsupervised machine learning technique, meaning it does not require labeled data, making it useful for exploratory data analysis.
- No Predefined Clusters: Unlike other clustering algorithms, hierarchical clustering does not require the number of clusters to be specified in advance, providing flexibility and enabling the discovery of natural groupings in the data.
- Dendrogram Visualization: The resulting dendrogram helps visualize the relationships between data points and clusters, making it easier to understand the data’s structure and guide decision-making.
- Scalability: Though computationally expensive, hierarchical clustering balances scalability and accuracy, especially for Large Language Models with smaller datasets.
- Versatility: It is applicable in diverse fields such as bioinformatics, customer segmentation, image analysis, and social network analysis, demonstrating its broad usefulness in various machine learning tasks.
- Capturing Complex Relationships: The algorithm’s ability to consider the proximity of data points at different levels of granularity enables it to capture complex relationships and patterns.
- Interpretability: Hierarchical clustering provides easy-to-interpret results, allowing data scientists and analysts to understand the rationale behind the grouping of data points, which aids in deriving actionable insights.
- Definition: A dendrogram is a tree-like diagram that illustrates the process of hierarchical clustering, showing how individual data points are merged into clusters step by step.
- Structure: Each leaf at the bottom of the dendrogram represents a single data point, while branches indicate cluster merges. The vertical lines show which clusters are combined and the level at which they merge.
- Height Interpretation: The height of each merge corresponds to the distance or dissimilarity between the clusters. A higher merge means the clusters were less similar when they were joined, a concept covered in Data Science Training.
- Linkage Influence: The shape of the dendrogram depends on the linkage method used (e.g., single, complete, average, or Ward’s), as it determines how distances between clusters are measured.
- Visual Insights: Dendrograms help detect the natural grouping in data and highlight patterns, outliers, and the relative proximity between clusters.
- Determining Clusters: To identify clusters, a horizontal line is drawn across the dendrogram. The number of vertical lines intersected by this cut indicates the number of clusters formed.
- Practical Usage: Commonly used in bioinformatics, marketing, and text analysis, dendrograms make hierarchical clustering results more interpretable and support better decision-making.
- Import Required Libraries: Begin by importing essential libraries such as pandas for data handling, matplotlib.pyplot and scipy.cluster.hierarchy for visualization and clustering, and sklearn for additional tools.
- Load and Prepare Data: Load your dataset using pandas and inspect it for missing values or irrelevant features. Normalize or scale the data using StandardScaler if required to ensure uniform distance measurement.
- Calculate Distance Matrix: Use scipy.spatial.distance.pdist() to compute pairwise distances for clustering, useful in AI Image Generator Tools.
- Apply Linkage Method: Choose a linkage method such as ‘single’, ‘complete’, ‘average’, or ‘ward’ and apply it using scipy.cluster.hierarchy.linkage() to generate the hierarchical cluster tree.
- Plot Dendrogram: Visualize the clustering hierarchy using scipy.cluster.hierarchy.dendrogram(). This helps identify the optimal number of clusters by analyzing where to “cut” the tree.
- Form Flat Clusters: Use scipy.cluster.hierarchy.fcluster() to extract flat clusters from the hierarchy based on a specified distance threshold or number of clusters.
- Analyze Results: Interpret and evaluate the resulting clusters by visualizing them in 2D plots or comparing them to known labels if available, ensuring meaningful groupings were achieved.
To Earn Your Data Science Certification, Gain Insights From Leading Data Science Experts And Advance Your Career With ACTE’s Data Science Course Training Today!
Dendrograms in Hierarchical Clustering

Linkage Methods: Single, Complete, Average
In hierarchical clustering, linkage methods play a crucial role in determining how the distance between clusters is calculated during the merging process. The three most commonly used linkage methods are single, complete, and average linkage, each influencing the shape and composition of clusters differently. Single linkage (or minimum linkage) measures the distance between the closest pair of points one from each cluster. This method tends to produce elongated or “chained” clusters, as it prioritizes the minimum distance, which can sometimes result in less cohesive groupings. In contrast, complete linkage (or maximum linkage) considers the distance between the farthest pair of points in two clusters, Impact of Loss Functions on Deep Learning Performance. This leads to more compact and spherical clusters, as it merges clusters only when all elements are relatively close to each other. However, it can be sensitive to outliers. Average linkage offers a balance between the two extremes by computing the average distance between all pairs of points in the two clusters. This approach generally yields well-formed clusters and is less sensitive to noise and outliers. The choice of linkage method significantly impacts the resulting dendrogram and clustering outcomes, so selecting the appropriate one depends on the data structure and the desired clustering characteristics.
Are You Considering Pursuing a Master’s Degree in Data Science? Enroll in the Data Science Masters Course Today!
Implementing Hierarchical Clustering in Python
Visualizing Hierarchical Clustering Results
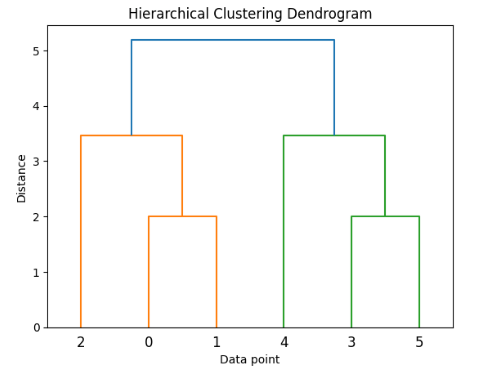
Visualizing the results of hierarchical clustering is essential for interpreting and understanding the structure of the formed clusters. The most common and effective visualization tool for this purpose is the dendrogram. A dendrogram is a tree-like diagram that illustrates the merging or splitting of clusters at various levels of hierarchy. Each leaf of the tree represents an individual data point, while the branches show how these points are grouped together based on their similarity or distance. The height at which two branches merge indicates the distance between the clusters being combined, a concept useful when working with an AI Checker Tool. By drawing a horizontal line across the dendrogram at a chosen threshold, users can visually identify and determine the optimal number of clusters. This is particularly useful for exploratory data analysis, where the number of clusters is not known beforehand. Libraries such as Scipy and Seaborn in Python provide tools to generate dendrograms and cluster heatmaps, enhancing visual interpretation. Cluster heatmaps combine dendrograms with a color-coded matrix that reflects data values and relationships, offering additional insight into patterns across clusters. Through these visualizations, analysts can better assess the cohesion and separation of clusters, identify outliers, and make more informed decisions based on the clustering structure.
Want to Learn About Data Science? Explore Our Data Science Interview Questions & Answer Featuring the Most Frequently Asked Questions in Job Interviews.
Applications of Hierarchical Clustering
Hierarchical clustering has a wide range of applications across various domains due to its ability to reveal the underlying structure in data without requiring a predefined number of clusters. In bioinformatics, it is commonly used to analyze genetic and protein sequences, where dendrograms help identify relationships between genes or organisms based on sequence similarity. In marketing and customer segmentation, businesses use hierarchical clustering to group customers based on purchasing behavior, demographics, or preferences, allowing for targeted marketing strategies and personalized services. In social network analysis, it helps uncover communities or groups with similar interaction patterns, improving understanding of user behavior and network dynamics, a key focus in Data Science Training. Document and text clustering is another popular application, where hierarchical clustering organizes articles, research papers, or web pages into topic-based groups. In image segmentation, it assists in grouping similar pixels or regions, improving the quality of object detection and recognition tasks. Additionally, in healthcare, hierarchical clustering is used to classify patients based on symptoms, medical history, or treatment responses, which supports more effective diagnosis and personalized treatment planning. Its versatility and interpretability make hierarchical clustering a valuable tool for discovering patterns and relationships in complex datasets across multiple industries.