
Last updated on 22nd May 2025| 9470
- Introduction to Data Science
- Key Python Libraries for Data Science
- Data Cleaning and Preprocessing in Python
- Exploratory Data Analysis (EDA) in Python
- Statistical Analysis Using Python
- Machine Learning with Python
- Data Visualization in Python
- Big Data Processing with Python
Introduction to Data Science
Data Science is a dynamic and interdisciplinary field that focuses on extracting meaningful insights and knowledge from both structured and unstructured data. It integrates techniques from statistics, computer science, and mathematics, while also drawing upon domain-specific expertise. By leveraging methods such as data mining, machine learning, and predictive analytics, Data Science empowers organizations to make informed, data-driven decisions. In today’s digital age, the volume of data generated from various sources such as social media, sensors, online transactions, and mobile devices has grown exponentially. As a result, Data Science Training has become a vital asset for industries aiming to stay competitive and innovative. It is widely applied in sectors including healthcare, finance, marketing, logistics, and e-commerce. In healthcare, Data Science is used to predict disease outbreaks, personalize treatment plans, and improve diagnostics. In finance, it helps detect fraudulent activities, assess credit risk, and optimize investment strategies. Marketing teams use it to understand consumer behavior and enhance targeting, while e-commerce platforms use it to provide personalized product recommendations and optimize supply chains. Overall, Data Science continues to shape how we analyze, interpret, and apply data, making it a crucial tool for solving complex real-world problems and driving technological progress.
Interested in Obtaining Your Data Science Certificate? View The Data Science Course Training Offered By ACTE Right Now!
Key Python Libraries for Data Science
Python has become the go-to programming language for Data Science due to its simplicity, versatility, and vast ecosystem of powerful libraries. These libraries provide tools for data manipulation, visualization, statistical analysis, and machine learning, making the data science workflow efficient and scalable. One of the most essential libraries is NumPy, which offers support for large, multi-dimensional arrays and a wide range of mathematical functions, a valuable skill for anyone looking to understand How can I get certified as a Google Data Engineer. Pandas is another core library, widely used for data manipulation and analysis, providing data structures like DataFrames that make handling structured data straightforward. For data visualization, Matplotlib and Seaborn allow the creation of high-quality plots and graphs that help uncover patterns and trends.
When it comes to machine learning, Scikit-learn is a comprehensive library that provides easy-to-use tools for classification, regression, clustering, and more. TensorFlow and PyTorch are powerful libraries used for deep learning, allowing the construction and training of neural networks. Additionally, SciPy complements NumPy with modules for optimization, integration, and statistics. For working with big data and distributed computing, Dask and PySpark are gaining popularity. These libraries collectively empower data scientists to turn raw data into actionable insights efficiently and effectively.
Data Cleaning and Preprocessing in Python
- Removing Duplicates: Duplicated data can be easily identified and removed using the drop_duplicates() method in Pandas, ensuring data integrity.
- Data Aggregation: Pandas provides powerful grouping and aggregation methods, such as groupby(), for summarizing data based on categories, useful for analyzing large datasets.
- Feature Engineering: Creating new features from existing ones using Pandas is a common preprocessing task, much like how you can Boost Productivity with Excel AutoSum Features.
- Handling Missing Data: Python’s Pandas library provides functions like fillna() and dropna() to handle missing values, either by replacing them with a specific value or removing the rows or columns containing them.
- Data Transformation: Pandas allows data transformation techniques, such as changing data types with astype() and normalizing or scaling numerical features using Scikit-learn’s MinMaxScaler or StandardScaler.
- Handling Categorical Data: Pandas and Scikit-learn offer methods like get_dummies() and LabelEncoder to convert categorical variables into numerical formats, making them suitable for machine learning models.
- Outlier Detection: Outliers can be detected using box plots from Seaborn or statistical techniques like the Z-score or IQR method to identify and handle anomalous values.
- Outlier Detection: Box plots and Z-score methods can identify outliers, which are critical to address before modeling to improve performance.
- Data Import and Cleaning: Python’s Pandas library is commonly used for importing and cleaning datasets. Functions like read_csv() and dropna() help load and preprocess data by handling missing values, duplicates, and outliers.
- Data Visualization: Matplotlib and Seaborn are essential tools for visualizing distributions, correlations, and trends in data, especially in Data Science Training.
- Summary Statistics: Pandas offers functions like describe() to generate summary statistics, such as mean, median, standard deviation, and quantiles, helping to quickly understand the data’s central tendencies and variability.
- Data Distribution: Visualizing the distribution of variables with histograms or Seaborn’s distplot() helps identify skewness, outliers, and the underlying distribution type, which is essential for choosing the right modeling techniques.
- Correlation Analysis: The corr() function in Pandas calculates correlation coefficients, and heatmaps in Seaborn visually represent these correlations, aiding in feature selection and multicollinearity detection.
- Feature Engineering: Based on insights gained from EDA, feature transformation, scaling, and encoding techniques can be applied to prepare the dataset for machine learning models.
- Deep Learning: For more advanced tasks like image recognition and natural language processing, Python offers TensorFlow and PyTorch for building deep neural networks.
- Model Evaluation: Python provides tools to evaluate model performance using metrics like accuracy, precision, recall, and F1 score, helping improve model accuracy and reliability.
- Integration with Big Data: Python integrates well with big data tools like Apache Spark and Hadoop, enabling machine learning at scale for large datasets, which is highly valuable in Data Science in Finance.
- Popular Libraries: Python offers key libraries for machine learning, such as Scikit-learn, TensorFlow, and Keras, which provide easy-to-use tools for building and evaluating machine learning models.
- Data Preprocessing: Pandas and NumPy are essential for data cleaning, handling missing values, and transforming data into suitable formats for machine learning algorithms.
- Supervised Learning: Python supports a wide range of supervised learning algorithms, including linear regression, logistic regression, support vector machines, and decision trees, all accessible via Scikit-learn.
- Unsupervised Learning: Unsupervised learning techniques like k-means clustering and principal component analysis (PCA) are easily implemented in Python to discover hidden patterns in data.
Would You Like to Know More About Data Science? Sign Up For Our Data Science Course Training Now!
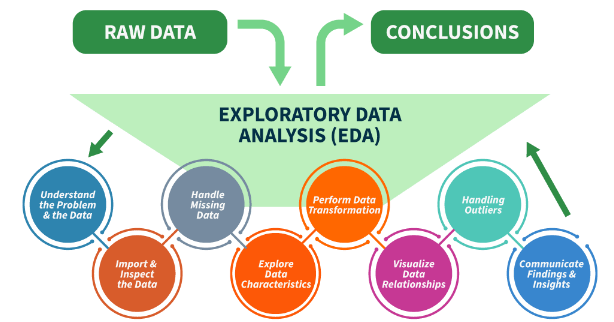
Exploratory Data Analysis (EDA) in Python

Statistical Analysis Using Python
Statistical analysis is a fundamental component of Data Science, and Python offers a rich ecosystem of libraries that make performing statistical tasks straightforward and efficient. Using Python, data scientists can explore data distributions, identify patterns, and draw meaningful conclusions through various statistical techniques. The SciPy library provides a wide range of statistical functions such as probability distributions, hypothesis testing, and descriptive statistics. Statsmodels is another powerful library designed specifically for statistical modeling, offering tools for linear regression, time series analysis, and ANOVA, which are integral to the Top 8 Data Science Applications. With Pandas, users can easily compute basic statistical measures like mean, median, variance, and correlation within tabular datasets. Visualization tools like Matplotlib and Seaborn further enhance statistical analysis by enabling graphical representations such as histograms, box plots, and scatter plots, which help interpret data intuitively. Python also supports Bayesian analysis through libraries like PyMC3 and PyStan, which are useful for modeling uncertainty. Whether it’s performing simple descriptive analysis or complex inferential statistics, Python provides a flexible and powerful platform for statistical work. Its open-source nature and strong community support make it a preferred choice for both academic research and industry applications in data analysis.
Gain Your Master’s Certification in Data Science by Enrolling in Our Data Science Masters Course.
Machine Learning with Python
Data Visualization in Python
Data visualization is a crucial aspect of data analysis, allowing complex information to be communicated clearly and effectively through visual formats. Python offers a variety of powerful libraries specifically designed for creating informative and visually appealing charts, graphs, and dashboards. Matplotlib is one of the most widely used libraries, known for its flexibility in generating a wide range of static, animated, and interactive plots such as line charts, bar graphs, histograms, and scatter plots, which are often used in Classification in Data Mining. Seaborn, built on top of Matplotlib, provides a higher-level interface and includes advanced features like statistical plotting and aesthetically pleasing default styles, making it ideal for visualizing distributions and relationships in data. For interactive visualizations, Plotly and Bokeh allow users to build dynamic charts and dashboards that can be embedded into web applications. Pandas also includes basic visualization capabilities, enabling quick plotting directly from DataFrames. Additionally, Altair offers a declarative approach to visualization, emphasizing simplicity and clear syntax for building complex plots with minimal code. These tools make it easier for data scientists to explore data, uncover patterns, and present findings in a way that supports better decision-making and storytelling with data.
Preparing for Data Science Job? Have a Look at Our Blog on Data Science Interview Questions & Answer To Ace Your Interview!
Big Data Processing with Python
As data volumes grow exponentially, processing big data efficiently has become a critical challenge. Python, known for its simplicity and rich ecosystem, offers several libraries and frameworks that support big data processing at scale. One of the most prominent tools is PySpark, the Python API for Apache Spark, which enables distributed computing across clusters for tasks such as data transformation, machine learning, and SQL-based querying. Dask is another powerful library that extends Python’s native data structures like NumPy arrays and Pandas DataFrames to work in parallel, enabling efficient processing of datasets that don’t fit into memory, making it an important tool in Data Science Training. For working with large-scale data pipelines, Apache Airflow provides workflow orchestration and scheduling, helping automate complex data processing tasks. Additionally, Hadoop Streaming can be used with Python to run MapReduce jobs. Python also integrates well with big data storage systems like HDFS, Amazon S3, and Google Cloud Storage, allowing seamless access to massive datasets. With support for cloud-based tools and real-time data processing through libraries like Kafka-Python, Python proves to be a versatile choice for handling big data challenges, making it widely adopted in industries such as finance, e-commerce, and healthcare.