
Last updated on 20th May 2025| 9764
- Introduction to ANOVA (Analysis of Variance)
- Importance of ANOVA in Data Analysis
- Types of ANOVA: One-Way vs Two-Way
- Assumptions of ANOVA Test
- Performing One-Way ANOVA in Statistics
- Two-Way ANOVA and Interaction Effects
- Post-Hoc Tests in ANOVA (Tukey’s Test)
- ANOVA Applications in Business and Healthcare
Introduction to ANOVA (Analysis of Variance)
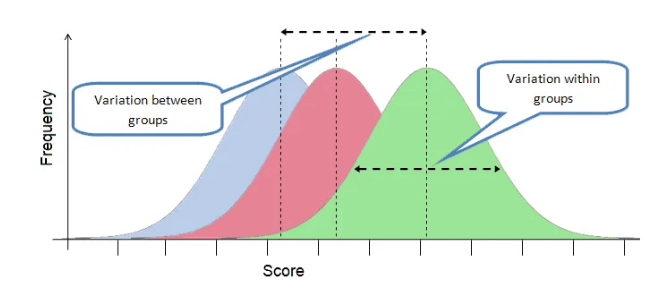
Analysis of Variance (ANOVA) is a powerful statistical method used to compare the means of three or more independent groups to determine whether there are any statistically significant differences among them. Unlike a t-test, which is limited to comparing two groups, ANOVA is ideal for analyzing complex experiments or studies with multiple groups or variables. The core idea behind ANOVA is to break down the observed variability in a dataset into components: within-group variance (how much individual data points differ within each group) and between-group variance (how much group means differ from one another). By comparing these variances, ANOVA assesses whether the differences among group means are likely due to actual effects or merely random chance, a concept that is thoroughly covered in Data Science Training. A high ratio of between-group to within-group variance suggests that at least one group mean is significantly different. This conclusion is based on an F-statistic and a corresponding p-value. ANOVA is commonly applied in fields like medical research, marketing, psychology, and quality control, where researchers or analysts seek to evaluate the effectiveness of different treatments, strategies, or conditions. It serves as a foundation for more advanced techniques like two-way ANOVA and multivariate analysis, enabling deeper insights into data patterns and relationships.
Are You Interested in Learning More About Data Science? Sign Up For Our Data Science Course Training Today!
Importance of ANOVA in Data Analysis
Analysis of Variance (ANOVA) plays a crucial role in data analysis by providing a systematic method for comparing the means of three or more groups. It helps researchers and analysts determine whether observed differences in data are statistically significant or simply due to random variation. ANOVA is particularly important when working with experimental designs, where multiple conditions or treatments need to be evaluated simultaneously. One of the key strengths of ANOVA is its ability to handle multiple group comparisons without increasing the risk of Type I error, which is common when conducting multiple t-tests, much like how Natural Language Processing techniques manage and process vast amounts of textual data efficiently. By analyzing both between-group and within-group variability, ANOVA provides a clear measure of how much variation in a dataset can be attributed to the treatment or condition being tested.
ANOVA is widely used across disciplines such as medicine, psychology, business, agriculture, and engineering. For example, it can help determine if different medications produce different effects, if marketing strategies influence sales performance, or if teaching methods impact student outcomes. Overall, ANOVA enhances the reliability of conclusions drawn from data by offering a statistically sound method for identifying meaningful differences, guiding decision-making, and informing further research or experimentation.
Types of ANOVA: One-Way vs. Two-Way
- Mixed-Design ANOVA: Also known as split-plot ANOVA, it combines between-subjects and within-subjects factors, ideal for complex experimental designs.
- Factorial ANOVA: A broader form of Two-Way ANOVA, it evaluates more than two independent variables and their interactions, allowing deeper insight into multifactor experiments.
- ANCOVA (Analysis of Covariance): ANCOVA combines ANOVA and regression, controlling for the effect of one or more covariates. It helps isolate the true effect of the independent variable.
- One-Way ANOVA: One-Way ANOVA compares the means of three or more independent groups based on one independent variable, a concept often explored in advanced programs like MTech in AI and ML.
- Two-Way ANOVA: Two-Way ANOVA examines the effect of two independent variables on a single dependent variable, along with their interaction. It is useful when analyzing the combined impact of multiple factors, such as treatment type and patient age on recovery time.
- Repeated Measures ANOVA: This type analyzes data collected from the same subjects under different conditions or over time. It is widely used in longitudinal studies, such as measuring blood pressure before, during, and after treatment.
- Multivariate ANOVA (MANOVA): MANOVA is an extension of ANOVA that assesses multiple dependent variables simultaneously. It is useful in studies where several outcomes are measured, such as evaluating both mental and physical health indicators.
- Homogeneity of Variances: The variance within each group should be roughly equal. This ensures that the groups are comparable, and the differences between them are meaningful.
- Random Sampling: Data should be collected through random sampling from each population or group being studied. This helps avoid bias in the results.
- Independence of Observations: The data points in each group must be independent of each other, meaning no individual can belong to multiple groups or affect the results of others, a principle emphasized in Data Science Training.
- Normality: The data in each group should follow a normal distribution. This is particularly important for small sample sizes, as ANOVA is sensitive to deviations from normality in these cases.
- Additivity of Effects: The effects of factors on the response variable are assumed to be additive, meaning there are no interactions between factors.
- Fixed Factors: The levels of the factors being tested should be fixed, meaning the groups are predetermined and not random.
- Balanced Design (optional): While not strictly necessary, a balanced design where all groups have the same sample size helps increase the power and accuracy of the test.
- Significance of Interaction: A significant interaction effect means the influence of one factor depends on the level of the other factor. If there’s no interaction, the effects of the two factors can be considered independently.
- Interpretation: Interaction effects are critical because they provide deeper insights into the combined influence of factors.
- Visual Representation: Interaction effects are often represented in plots, showing how the levels of one factor alter the effect of the other factor, much like how The Power of Python’s Pass Keyword for Syntactical Flexibility can simplify code structure in programming.
- Two Independent Variables: A Two-Way ANOVA examines the effect of two factors (independent variables) simultaneously on a dependent variable, which allows for more complex analysis.
- Main Effects: The test assesses the main effects of each factor individually. For example, if the two factors are “diet” and “exercise,” the main effect of diet would evaluate how diet alone impacts the dependent variable, regardless of exercise.
- Interaction Effect: The interaction effect tests whether the combination of the two factors has a different impact on the dependent variable than would be expected from the sum of their individual effects.
To Explore Data Science in Depth, Check Out Our Comprehensive Data Science Course Training To Gain Insights From Our Experts!
Assumptions of ANOVA Test

Performing One-Way ANOVA in Statistics
One-way ANOVA is a statistical technique used to compare the means of three or more independent groups based on a single factor or independent variable. It helps determine whether the observed differences among group means are statistically significant or likely due to random chance. This method is widely used in experimental research, quality control, and business analytics when testing the effect of one factor on a dependent variable. To perform a one-way ANOVA, the first step is to clearly define the groups and collect data. The assumptions must be checked: the data should be approximately normally distributed, the variances across groups should be equal (homogeneity of variance), and the observations must be independent, similar to how Data Reduction in Data Mining helps simplify large datasets while preserving key information. The process involves calculating the between-group variance (variation due to the factor being tested) and the within-group variance (random variation within each group). These values are used to compute the F-statistic, which indicates the ratio of between-group to within-group variance. A higher F-value suggests greater differences between group means. If the resulting p-value is less than the chosen significance level (commonly 0.05), it indicates that at least one group mean is significantly different. A post hoc test, like Tukey’s HSD, can then identify which specific groups differ.
Gain Your Master’s Certification in Data Science by Enrolling in Our Data Science Masters Course.
Two-Way ANOVA and Interaction Effects
Post-Hoc Tests in ANOVA (Tukey’s Test)
Post-hoc tests are used in ANOVA when the overall analysis indicates a statistically significant difference among group means, but does not specify which groups differ. One of the most commonly used post-hoc tests is Tukey’s Honest Significant Difference (HSD) test, which is specifically designed for pairwise comparisons between group means while controlling the Type I error rate. Tukey’s test works by comparing all possible pairs of group means and calculating the difference between each pair. It then determines whether each difference is statistically significant, based on a calculated critical value that accounts for the number of comparisons being made, similar to how Macros in Excel automate repetitive tasks and analyses. This makes Tukey’s test a powerful and reliable method for identifying which specific groups differ from each other after a significant ANOVA result. Tukey’s HSD is especially useful when the sample sizes are equal or nearly equal and the assumptions of ANOVA (normality and homogeneity of variances) are met. It provides confidence intervals for the differences between means, offering clear insight into the direction and strength of those differences. In practical applications, such as medical trials or marketing studies, Tukey’s test helps researchers draw precise conclusions and avoid misleading results that could arise from multiple comparisons.
Want to Learn About Data Science? Explore Our Data Science Interview Questions & Answer Featuring the Most Frequently Asked Questions in Job Interviews.
ANOVA Applications in Business and Healthcare
Analysis of Variance (ANOVA) is a valuable statistical tool widely used in both business and healthcare to support data-driven decision-making. In business, ANOVA is commonly applied to evaluate the effectiveness of different strategies, campaigns, or operational processes. For example, a company might use ANOVA to compare the sales performance across multiple marketing campaigns or to assess customer satisfaction levels among different service branches. By identifying whether differences in outcomes are statistically significant, businesses can allocate resources more effectively and fine-tune their strategies for better performance. In healthcare, ANOVA plays a crucial role in clinical research and treatment evaluation, a technique covered extensively in Data Science Training. It is used to compare the effectiveness of various medical treatments or drugs across patient groups. For instance, researchers may apply one-way ANOVA to determine if different medications result in significantly different recovery rates for a specific condition. In hospital management, ANOVA can be used to evaluate patient wait times across departments or the impact of workflow changes on operational efficiency. By analyzing group-level differences with statistical rigor, ANOVA helps organizations in both fields reduce guesswork, make informed decisions, and implement interventions that are backed by reliable data and proven outcomes.