
Last updated on 26th Apr 2025| 9914
- Introduction to Probability Distributions
- Types of Probability Distributions
- Discrete vs. Continuous Distributions
- Normal Distribution (Gaussian) and Its Properties
- Binomial Distribution and Real-World Examples
- Poisson Distribution and Event Counting
- Exponential Distribution and Waiting Time Analysis
- Uniform Distribution and Equal Probabilities
- Skewness and Kurtosis in Distributions
- Applications of Probability Distributions in AI & ML
- Probability Distribution in Financial Modeling
- How to Visualize Probability Distributions
- Conclusion
Introduction to Probability Distributions
A probability distribution is a mathematical function that describes how probabilities are distributed across possible outcomes. It defines the likelihood of different results in a random experiment. Probability distributions are fundamental in statistics, Data Science Course Training , and machine learning, helping model uncertainty and randomness. They are used for predictive analysis, risk assessment, and decision-making in various fields.
Types of Probability Distributions
Probability distributions are broadly classified into two categories:
- Discrete Distributions: Discrete distributions represent countable outcomes, such as the number of defective products in a batch or the number of goals scored in a match. These distributions are used when the Advantages and Disadvantages of Python Programming Language can only take specific, distinct values. Examples include the Poisson distribution, which models the number of events occurring in a fixed interval, and the binomial distribution, which models the number of successes in a fixed number of trials. Discrete distributions are essential in situations where events or items are counted, and they are commonly applied in areas like quality control, inventory management, and risk analysis.
- Continuous Distributions: Continuous distributions deal with infinitely possible values over a range, such as measuring height, weight, or temperature. Unlike discrete distributions, continuous distributions represent data that can take any value within a specified range. A well-known example is the normal distribution, which is used to model a wide variety of natural phenomena. Exponential distributions are another type used to model the time between events in processes like queuing or failure rates. Continuous distributions are fundamental in fields like physics, economics, and finance, particularly in modeling stock prices, interest rates, and other variables that change continuously over time.
- Example of discrete: Binomial distribution models the probability of success in a series of trials.
- Example of continuous: Normal distribution models real-world variables like height and weight.
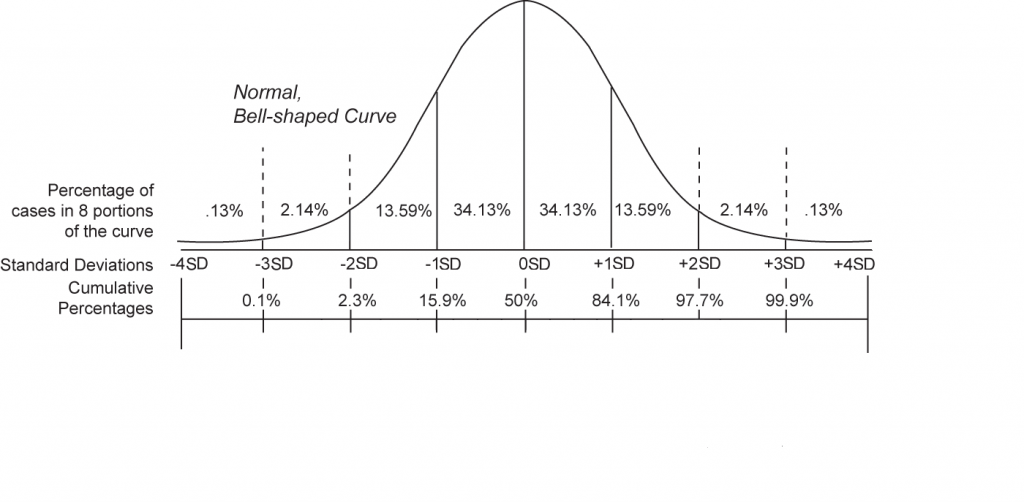
- Mean = Median = Mode.
- 68-95-99.7 rule: About 68% of values fall within one standard deviation, 95% within two, and 99.7% within three.
- n = number of trials.
- p = probability of success.
- Modeling uncertainty: Bayesian networks use distributions for probabilistic inference.
- Data sampling: Algorithms randomly sample data points based on probability distributions.
- Anomaly detection: Outliers are identified by comparing data to a normal distribution.
- Generative models: GANs and VAEs rely on distributions to generate synthetic data. These applications help in predictive analytics and decision-making.
- Stock returns: Often modeled using the normal distribution.
- Value at Risk (VaR): Uses distribution curves to measure potential losses.
- Monte Carlo simulations: Simulate market scenarios using distributions.
- Poisson distribution: Models rare financial modeling events, such as defaults.
- Histograms: Display the frequency of values in bins.
- Density plots: Show the probability density function (PDF).
- Box plots: Visualize the median, quartiles, and outliers.
- Q-Q plots: Compare sample data to a theoretical distribution.
Learn the fundamentals of Data Science with this Data Science Online Course .
Discrete vs. Continuous Distributions
Discrete distributions apply to variables with finite or countable values, like dice rolls or customer arrivals. In contrast, continuous distributions apply to variables with infinite possible values over an interval, such as temperature or stock prices.
Normal Distribution (Gaussian) and Its Properties
The normal distribution, also known as the Gaussian distribution, is the most common continuous probability distribution. Data Mining vs Machine Learning has a bell-shaped curve and is symmetrical around the mean. Normal distribution is widely used in finance, biology, and AI for modeling natural phenomena. Its properties include:
Binomial Distribution and Real-World Examples
The binomial distribution is a discrete distribution used to model the number of successes in a fixed number of trials. For example, when flipping a coin 10 times, the binomial distribution models the probability of getting 6 heads. It is widely applied in A/B testing, quality control, and survey analysis. It is defined by:
Dive into Data Science by enrolling in this Data Science Online Course today.
Poisson Distribution and Event Counting
The Poisson distribution models the probability of a given number of events occurring in a fixed time or space interval. Reasons you Should Learn R Python and Hadoop is ideal for rare events and is defined by: λ (lambda) = average event rate. Applications include predicting customer arrivals, website hits, or accidents. The Poisson distribution is widely used in queueing theory, call centers, and traffic management.
Exponential Distribution and Waiting Time Analysis
The exponential distribution models the time between events in a Poisson process. It is used to describe the duration between occurrences of random events. Its key properties include, Memoryless property, meaning the probability of an event occurring in the future is independent of the past. Used in reliability engineering, it models failure times of machines or waiting times in queues.

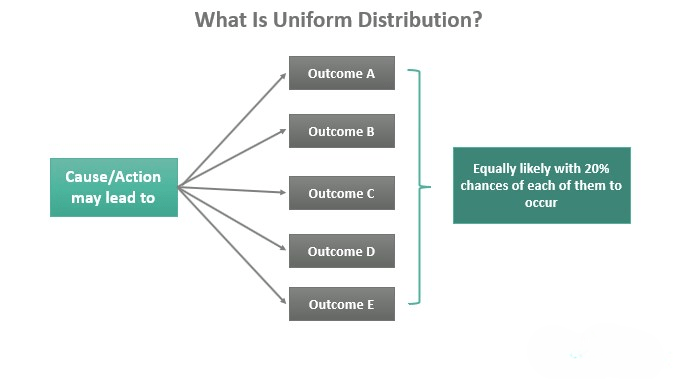
Uniform Distribution and Equal Probabilities
The uniform distribution represents equally likely outcomes over a defined range. It is characterized by, A constant probability density function (PDF). Equal likelihood for all values. For example, rolling a fair six-sided die results in a uniform distribution, as each face has an equal probability of appearing. This distribution is used in random sampling, simulations, and lotteries.
Skewness and Kurtosis in Distributions
Skewness and kurtosis are essential statistical measures that provide valuable insights into the shape of a data distribution. Skewness measures the asymmetry of a distribution, where positive skew indicates that the tail is longer on the right, meaning most of the data points are clustered on the left with a few larger values pulling the mean to the right. Negative skew, on the other hand, shows that the tail is longer on the left, with the data concentrated on the right and a Data Science Course Training values pulling the mean to the left. Kurtosis measures the “tailedness” of the distribution, with leptokurtic distributions having heavy tails and more outliers, indicating a higher likelihood of extreme values. In contrast, platykurtic distributions have light tails and fewer outliers, showing a lower probability of extreme values. Understanding skewness and kurtosis is crucial for interpreting data shapes and identifying outliers. These measures help identify deviations from normality and can guide decisions on data transformations or model adjustments, especially in fields like finance, quality control, and risk management, where recognizing unusual data behavior is vital.
Take charge of your Data Science career by enrolling in ACTE’s Data Science Master Program Training Course today!
Applications of Probability Distributions in AI & ML
Probability distributions are widely used in AI and machine learning for:
Probability Distribution in Financial Modeling
In finance, probability distributions model risks and predict future events.Financial analysts use these distributions for risk Normality Test in Minitab, portfolio management, and pricing models. Examples include:
How to Visualize Probability Distributions
Visualizing probability distributions helps in understanding Big Data vs Data Science. Tools like Matplotlib, Seaborn, and Power BI are commonly used for distribution visualization. Common visualization methods include:
Want to ace your Data Science interview? Read our blog on Data Science Interview Questions and Answers now!
Conclusion
Probability distributions are foundational in statistics, data analysis, and machine learning. From normal and binomial distributions to Poisson and exponential models, each distribution serves a specific purpose. Mastering them allows professionals to model uncertainty, interpret data, and make informed decisions. As Data Science Course Training evolves, understanding and applying probability distributions will remain a core skill for analysts, engineers, and data scientists.