
Last updated on 18th Apr 2025| 10552
- What is a MIS report in Excel?
- Excel MIS Report Types
- What Makes a MIS Report Useful?
- How to Use Excel to Create a MIS Report
- Commonly Used MIS Reports in Excel
- Excel MIS Report Benefits
- Conclusion
In today’s business world, data-driven decision-making is crucial for maintaining competitiveness and efficiency. One of the most powerful tools for organizing, analyzing, and presenting data is the Management Information System (MIS) report. When combined with Excel’s functionality, businesses can easily streamline their data processes and generate insightful reports. In Data Science Course Training article, we will discuss an Excel MIS report, its various types, and why they are essential. We will also provide a step-by-step guide on how to create one.
What is a MIS report in Excel?
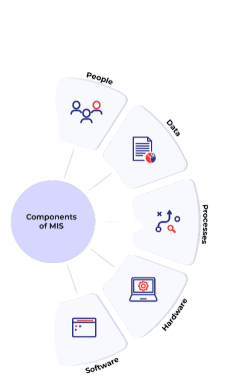
An Excel MIS (Management Information System) report is a document created in Microsoft Excel that consolidates and analyzes data from different business operations to provide actionable insights. Role of Citizen Data Scientists in Todays Business reports are generated to assist management in making informed decisions based on accurate and real-time information. The primary goal of an MIS Reports in Excel is to transform raw data into an understandable, meaningful, and actionable format, helping businesses track performance, monitor KPIs, and identify areas for improvement. Excel is one of the most widely used business tools. CRM systems offer a wide range of features such as data processing, analysis, and visualization that make it an ideal platform for creating MIS reports. Excel for MIS can include tables, charts, pivot tables, and advanced formulas to deliver accurate, up-to-date, and comprehensive insights.
Learn how to manage and deploy cloud services by joining this Data Science Online Course today.
Excel MIS Report Types
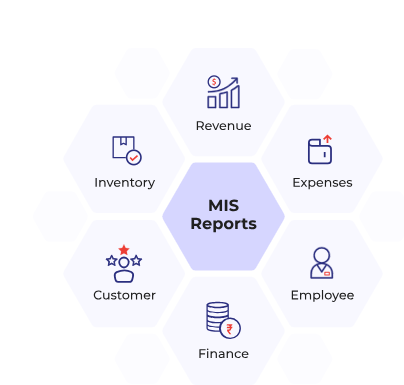
Excel MIS reports can vary depending on the business function, the department, and the data involved. Below are some of the common types of Management Information System reports created in Excel:
Sales MIS Report: A sales MIS report helps track sales performance by summarizing data such as sales numbers, regions, salespeople, and products. Decision Making provides insights into the effectiveness of sales strategies, identifies trends, and allows managers to monitor targets and actuals.
Key Metrics in a Sales Report:
- Total sales revenue.
- Sales by product, region, or salesperson.
- Sales growth or decline over a specific period.
- Comparison with sales targets.
- Profit and loss statement (P&L).
- Revenue, costs, and expenses.
- Cash flow and liquidity status.
- Variance analysis (budgeted vs. actual).
- Stock on hand.
- Reorder levels.
- Product sales frequency.
- Stockouts and overstocking rates.
- Employee attendance and leave data.
- Hiring and recruitment metrics.
- Employee performance reviews.
- Training and development needs.
- Project timelines and milestones.
- Budget allocation vs. actual spending.
- Resource utilization.
- Project risks and issues.
- Lead generation and conversion rates.
- Return on investment (ROI) for campaigns.
- Social media engagement and growth.
- Customer acquisition costs.
Financial MIS Report: A financial MIS report provides insights into a company’s economic performance. It helps assess whether the business is meeting its financial goals and how it is managing Data Science vs Data Analytics vs Machine Learning expenses and revenues.
Key Metrics in a Financial Report::
Inventory MIS Report: Inventory management is crucial for businesses that deal with physical products. An inventory MIS report tracks stock levels, replenishment needs, and turnover.
Key Metrics in an Inventory Report::
Human Resources MIS Report:HR MIS reports track workforce performance, attendance, and other key human resource metrics. These reports help workforce management and identify trends like absenteeism, turnover rates, and performance issues.
Key Metrics in an HR Report:
Enhance your knowledge in Data Science. Join this Data Science Online Course now.
Project Management MIS Report: A project management MIS report provides a snapshot of ongoing projects, tracking their progress and highlighting any risks or issues with CRM systems.
Key Metrics in a Project Report::
Marketing MIS Report:A marketing MIS report tracks the effectiveness of marketing campaigns and initiatives, providing The Importance of Machine Learning for Data Scientists into how well marketing goals are being met.
Key Metrics in a Marketing Report:
What Makes a MIS Report Useful?
Management Information System reports serve several vital functions for businesses, and there are many reasons why they are essential. Here are a few key benefits of using MIS reports. Data-Driven Decision Making MIS reports provide accurate, real-time information that enables businesses to make informed decisions. With reliable data, managers can identify trends, assess risks, and Decision Making based on business performance rather than assumptions. Regular MIS reports allow businesses to track their performance over time. Organizations can easily spot underperformance and take corrective actions by analyzing data such as sales figures, expenses, or project completion rates. MIS reports allow businesses to identify historical patterns in the data. By analyzing trends, companies can make more accurate predictions about future business performance, sales cycles, and customer behavior. Automating data collection, analysis, and reporting reduces the time and effort required to generate reports. Excel’s capabilities, such as PivotTables, Data Science Course Training, and charts, allow you to create automated, dynamic reports that update in real-time, saving resources and time. MIS reports help ensure that all stakeholders—from department heads to senior executives—have access to the same data. This fosters transparency and ensures that everyone is aligned on goals, progress, and challenges.

How to Use Excel to Create a MIS Report
Creating an MIS report in Excel is a straightforward process, especially when using Excel’s powerful features, such as pivot tables, charts, and formulas. Here’s a step-by-step guide to creating an MIS report in Excel:
Step 1: Define the Objective
Start by clearly defining the purpose of your MIS report. What data are you tracking, and why is it important? For example, if Dispersion in Statistics creating a sales report, your objective might be to track monthly sales performance and compare it with the targets.
Step 2: Gather and Organize the Data
Collect the necessary data from relevant sources, such as databases, spreadsheets, or CRM systems. In Excel, organize this data into columns and rows. For example, a sales report has columns for date, salesperson, region, and sales amount.
Step 3: Use Excel Formulas to Process the Data
Excel offers a variety of formulas to process and analyze the data in your MIS report. Some valuable formulas include:
- SUM: Adds up values in a specified range.
- AVERAGE: Calculates the average of a dataset.
- COUNTIF: Counts how many times a specific condition is met.
- IF: Performs conditional calculations based on specific criteria.
- Select your data.
- Go to the “Insert” tab and click on “PivotTable.”
- Drag and drop fields into the rows, columns, and values sections to summarize data.
Step 4: Create Pivot Tables
One of the most powerful features in Excel for MIS summarizing and analyzing data is the Pivot Table. PivotTables help you quickly analyze large datasets and summarize them by different categories. For example, you can use a pivot table to calculate total sales by region or salesperson.To create a PivotTable:
Step 5: Add Charts and Visualizations
Once you have organized and processed the data, you can add charts to Simple Linear Regression key information. Excel for MIS has a variety of chart types, such as bar charts, line charts, pie charts, and more. For example, a bar chart can display sales by region, or a line chart can show sales trends over time.
Step 6: Format and Customize the Report
Ensure your MIS report is easy to read and visually appealing by formatting it effectively, Use bold headings and color-coding to differentiate between sections. Apply conditional formatting to highlight specific figures (e.g., high sales). Add borders, shading, and alignment to improve readability.
Step 7: Share the Report
Once the MIS report is complete, save it in the desired format (e.g., Excel, PDF) and share it with the relevant stakeholders. You can email it, share it via cloud storage, or print it for physical distribution.
Looking to master Data Science? Sign up for ACTE’s Data Science Master Program Training Course and begin your journey today!
Commonly Used MIS Reports in Excel
Some widely used MIS reports that businesses create in Excel include:
- Sales Performance Report: This report tracks overall sales, sales by region, product, and salesperson, as well as sales growth and target comparisons.
- Budget vs. Actual Report: Compares budgeted figures against actual performance, helping businesses manage expenses and stay on track financially.
- Inventory Tracking Report: Monitors stock levels, reorder points, and inventory turnover.
- Employee Performance Report: Tracks employee performance, attendance, and productivity metrics.
- Project Status Report: An overview of project milestones, budgets, timelines, and resources.
Boost your chances in Data Science interviews by checking out our blog on Data Science Interview Questions and Answers!
Excel MIS Report Benefits
Using Excel for MIS reporting comes with several advantages:
- Cost-Effective: Excel is widely available and Sales Performance Report: This report tracks overall sales, sales by region, product, and salesperson, as well as sales growth and target comparisons. Budget vs. Actual Report: Compares budgeted figures against actual performance, helping businesses manage expenses and stay on track financially. Inventory Tracking Report: Monitors stock levels, reorder points, and inventory turnover. Employee Performance Report: Tracks employee performance, attendance, and productivity metrics. Project Status Report: An overview of project milestones, budgets, timelines, and resources. Boost your chances in Data Science interviews by checking out our blog on Data Science Interview Questions and Answers! Excel MIS Report Benefits Using Excel for MIS reporting comes with several advantages: Cost-Effective: Excel is widely available and https://www.acte.in/comprehensive-data-science-course-syllabus , making it a budget-friendly business solution. Ease of Use: Excel’s user-friendly interface and familiar features make it accessible to users with varying levels of expertise. Customizable: Excel allows you to tailor reports to business needs and preferences. Dynamic and Interactive: Excel MIS reports can be interactive and updated in real-time with features like pivot tables, dynamic charts, and formulas. Data Integration: Excel can easily integrate with other business systems and data sources, allowing for seamless data import. Comprehensive Data Science Course Syllabus , making it a budget-friendly business solution.
- Ease of Use: Excel’s user-friendly interface and familiar features make it accessible to users with varying levels of expertise.
- Customizable: Excel allows you to tailor reports to business needs and preferences.
- Dynamic and Interactive: Excel MIS reports can be interactive and updated in real-time with features like pivot tables, dynamic charts, and formulas.
- Data Integration: Excel can easily integrate with other business systems and data sources, allowing for seamless data import.
Conclusion
Excel MIS reports are essential for businesses to track, analyze, and visualize critical operational data. Whether for sales, finance, inventory, CRM systems For marketing, Data Science Course Training reports provide valuable insights that help businesses make informed Decision Making, monitor performance, and optimize operations. Following the steps outlined in this guide, you can create practical and insightful MIS reports in Excel to help your organization stay on track and achieve its business objectives.