Last updated on 26th May 2025| 9245
- Introduction to Data Analysis as a Career
- Required Educational Background
- Essential Skills for Data Analysts
- Programming Languages: SQL, Python, and R
- Data Cleaning and Preprocessing Techniques
- Data Visualization Skills and Tools
- Statistical Analysis and Interpretation
- Building a Data Analyst Portfolio
Introduction to Data Analysis as a Career
Data analysis is a thriving and highly sought-after profession that empowers individuals and businesses to make informed, data-driven decisions. In today’s digital age, organizations generate and collect vast amounts of data from various sources, making the ability to interpret and analyze this information effectively more important than ever. A data analyst’s primary role is to transform raw data into clear, actionable insights that help businesses optimize processes, enhance customer experiences, and foster innovation. Data Science Training teaches that by examining trends, patterns, and relationships within data, data analysts provide valuable recommendations that support strategic decision-making. This profession spans across numerous industries, including healthcare, finance, education, marketing, and technology, reflecting its broad applicability. Because data plays a crucial role in almost every sector, data analysts enjoy diverse career opportunities with strong job security and competitive salaries. Moreover, the field is continuously evolving, offering ongoing learning prospects and growth potential. For those who enjoy working with numbers, problem-solving, and uncovering stories hidden in data, a career as a data analyst can be both fulfilling and impactful, making it an excellent choice in the modern workforce.
Do You Want to Learn More About Data Science? Get Info From Our Data Science Course Training Today!
Required Educational Background
The required educational background for a career in data analysis typically includes a strong foundation in mathematics, statistics, and computer science. Most data analyst roles require at least a bachelor’s degree in related fields such as statistics, mathematics, computer science, information technology, economics, or engineering. Top Data Science Programming Languages are taught in programs that provide essential skills in data management, statistical analysis, and programming, which are crucial for working with complex datasets. Additionally, many employers value candidates who have experience with data visualization tools, database management, and programming languages like Python, R, and SQL. Beyond formal education, gaining practical experience through internships, projects, or online courses can significantly enhance a candidate’s qualifications.
Certifications in data analysis or specialized tools like Tableau, Power BI, or Google Analytics can also boost employability and demonstrate proficiency. For advanced positions, such as data scientist or machine learning engineer, a master’s degree or Ph.D. in quantitative fields is often preferred or required. Importantly, the field of data analysis is dynamic, so continuous learning and staying updated with emerging technologies, methodologies, and tools is essential. This combination of formal education, practical skills, and lifelong learning prepares individuals to excel in the fast-evolving world of data analysis.
Essential Skills for Data Analysts
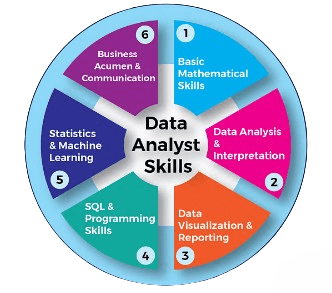
- Statistical Knowledge: Understanding concepts like mean, median, standard deviation, probability, and hypothesis testing is fundamental for analyzing data and drawing accurate conclusions.
- Programming Skills: Proficiency in languages like Python or R enables data analysts to manipulate data, perform analyses, and automate repetitive tasks efficiently.
- Data Wrangling: The ability to clean, preprocess, and transform raw data into a usable format is crucial, as real-world data is often messy and incomplete.
- SQL and Database Management: The Role of Citizen Data Scientists in Today’s Business includes knowing how to query databases using SQL, which helps analysts extract relevant data from large datasets stored in relational databases.
- Data Visualization: Skills in tools like Tableau, Power BI, or libraries such as Matplotlib and Seaborn help present data insights clearly through charts, graphs, and dashboards.
- Critical Thinking and Problem-Solving: Analysts must interpret data in context, identify trends, and provide actionable recommendations to solve business problems.
- Communication Skills: The ability to explain complex findings clearly and effectively to non-technical stakeholders is essential for driving data-informed decisions.
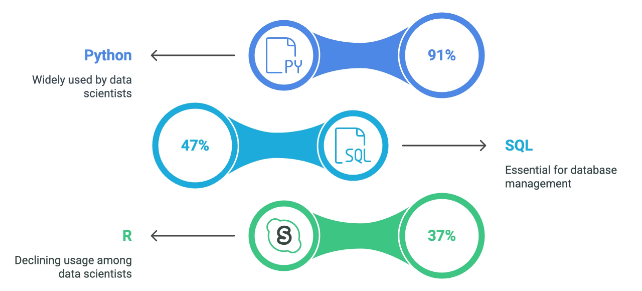
- Python: Widely used in data science and analysis due to its simplicity and powerful libraries like Pandas, NumPy, and Scikit-learn, Python is ideal for data manipulation, statistical analysis, and machine learning.
- R: A language designed specifically for statistical computing and graphics, R excels at data visualization and advanced statistical modeling, making it popular among statisticians and researchers.
- SQL: Data Science Training emphasizes that SQL is essential for querying and managing data stored in relational databases, allowing analysts to efficiently extract, update, and manipulate large datasets.
- JavaScript: Primarily used in web development, JavaScript is also valuable for creating interactive data visualizations on the web with libraries like D3.js.
- Java: Known for its stability and scalability, Java is often used in large enterprise environments and can be integrated with big data technologies like Hadoop.
- SAS: A specialized software suite used for advanced analytics, business intelligence, and data management, particularly popular in finance and healthcare sectors.
- Julia: A newer language gaining traction for high-performance numerical and scientific computing, Julia combines speed with ease of use, ideal for complex data analysis tasks.
- Understanding Visualization Principles: Knowing how to choose the right chart type (bar, line, scatter, pie) based on data and audience ensures clear and effective communication of insights.
- Storytelling with Data: The ability to create a narrative through visuals helps highlight key trends and patterns, making data more accessible and engaging for stakeholders.
- Proficiency in Tableau: Tableau is a leading data visualization tool that allows users to build interactive dashboards and reports without extensive coding.
- Skills in Power BI: Microsoft Power BI integrates well with other Microsoft products and, combined with Python Generators, enables the creation of dynamic visual reports for business intelligence.
- Experience with Python Visualization Libraries: Libraries like Matplotlib, Seaborn, and Plotly enable customized, programmatic visualizations for in-depth data exploration and presentation.
- Knowledge of Excel Charts and Graphs: Excel remains a fundamental tool for quick and simple visualizations, especially in business settings.
- Familiarity with D3.js: For web-based, interactive visualizations, D3.js is a powerful JavaScript library that allows highly customized graphics directly in web browsers.
Would You Like to Know More About Data Science? Sign Up For Our Data Science Course Training Now!
Programming Languages: SQL, Python, and R

Data Cleaning and Preprocessing Techniques
Data cleaning and preprocessing are crucial steps in the data analysis process, ensuring that the data is accurate, consistent, and ready for meaningful analysis. Raw data often contains errors, missing values, duplicates, and inconsistencies that can lead to misleading results if not properly addressed. Data cleaning involves identifying and correcting these issues by removing or imputing missing values, fixing errors, and eliminating duplicate records. This process improves the overall quality of the dataset and helps avoid biases or inaccuracies in analysis. The Importance of Machine Learning for Data Scientists includes preprocessing, which goes a step further by transforming the cleaned data into a suitable format for analysis or modeling. Common preprocessing techniques include normalization or scaling, which adjust numerical values to a standard range, and encoding categorical variables to convert them into numerical formats usable by algorithms. Additionally, feature engineering creating new variables or modifying existing ones can enhance the predictive power of models. Effective data cleaning and preprocessing are essential because they directly impact the quality of insights derived from the data. By investing time and effort in these steps, analysts ensure that subsequent analyses, visualizations, and models are reliable and robust, ultimately leading to more accurate decision-making and business outcomes.
Want to Pursue a Data Science Master’s Degree? Enroll For Data Science Masters Course Today!
Data Visualization Skills and Tools
Statistical Analysis and Interpretation
Statistical analysis and interpretation form the backbone of data-driven decision-making, enabling analysts to summarize, explore, and draw meaningful conclusions from data. Statistical analysis involves applying mathematical techniques to describe data characteristics, test hypotheses, and identify relationships between variables. Descriptive statistics such as mean, median, mode, variance, and standard deviation provide a summary of data distribution and variability, helping to understand the overall trends and patterns. Python Career Opportunities often require knowledge of inferential statistics, which allow analysts to make predictions or generalizations about a population based on sample data. Techniques like hypothesis testing, confidence intervals, correlation, and regression analysis help determine whether observed effects are statistically significant and how variables are related. Interpreting statistical results requires careful consideration of the context, assumptions, and limitations of the methods used. It is essential to communicate findings clearly and accurately, highlighting what the data reveals and its practical implications. Misinterpretation or misuse of statistical results can lead to flawed conclusions and poor decision-making. Overall, strong statistical analysis and interpretation skills empower professionals to convert raw data into actionable insights, supporting evidence-based strategies that drive organizational success across various industries.
Preparing for Data Science Job? Have a Look at Our Blog on Data Science Interview Questions & Answer To Ace Your Interview!
Building a Data Analyst Portfolio
Building a strong data analyst portfolio is essential for showcasing your skills, experience, and ability to solve real-world problems using data. A well-crafted portfolio demonstrates your proficiency in data cleaning, analysis, visualization, and interpretation, making you stand out to potential employers or clients. Start by including a variety of projects that highlight different aspects of data analysis, such as exploratory data analysis, predictive modeling, or business intelligence. Use publicly available datasets or datasets from internships and personal projects to create compelling case studies. Data Science Training stresses that each project should clearly explain the problem, the data sources, the tools and techniques used, and the insights or outcomes achieved. Visualizations such as charts, graphs, and dashboards can effectively communicate your findings and make your portfolio more engaging. In addition to project work, consider including your proficiency with key tools like Python, R, SQL, Excel, and visualization platforms such as Tableau or Power BI. Sharing your code on platforms like GitHub or creating interactive notebooks on Jupyter can also demonstrate your technical skills. A strong portfolio not only reflects your technical capabilities but also your critical thinking and communication skills, which are vital for a successful career in data analysis.